Overflow Staffing Services Market Size and Share Forecast Outlook 2025 to 2035

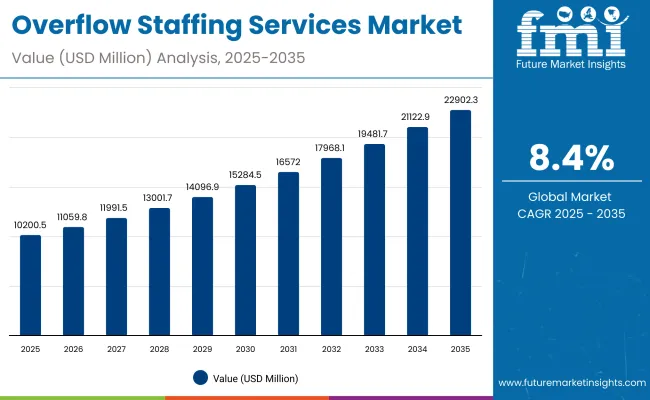
The Overflow Staffing Services Market is expected to record a valuation of USD 10,200.5 million in 2025 and USD 22,902.3 million in 2035, with an increase of USD 12,701.8 million, which equals a growth of approximately 124.5% over the decade. The overall expansion represents a CAGR of 8.4% and more than a 2X increase in market size.
Quick Stats for Overflow Staffing Services Market

  • Overflow Staffing Services Market Value (2025): USD 10,200.5 million
  • Overflow Staffing Services Market Forecast Value (2035): USD 22,902.3 million
  • Overflow Staffing Services Market Forecast CAGR (2025 to 2035): 8.4%
  • Leading Segment in Overflow Staffing Services Market in 2025: Temporary Staffing (53.4%)
  • Key Growth Regions in the Overflow Staffing Services Market: Asia-Pacific (notably India and China), North America, Europe
  • Top Key Players in Overflow Staffing Services Market: Adecco, Randstad, ManpowerGroup, Kelly Services, Allegis Group, TrueBlue, Robert Half, Express Employment, Hays, Aerotek

Overflow Staffing Services Market

Overflow Staffing Services Market Key Takeaways

Metric Value
Market Estimated Value in (2025E) USD 10,200.5 million
Market Forecast Value in (2035F) USD 22,902.3 million
Forecast CAGR (2025 to 2035) 8.4%

During the first five-year period from 2025 to 2030, the market increases from USD 10,200.5 million to USD 15,284.5 million, adding USD 5,084 million, which accounts for 40% of the total decade growth. This phase records steady adoption of on-demand workforce models, particularly in logistics, retail, and IT services, driven by labor flexibility and cost control. Hourly contracts dominate this period, comprising 64.3% of market value in 2025, due to their suitability for short-term and surge staffing needs.

The second half from 2030 to 2035 contributes USD 7,617.8 million, equal to 60% of total growth, as the market jumps from USD 15,284.5 million to USD 22,902.3 million. This acceleration is powered by the rising integration of automation in workforce management, AI-driven staff scheduling, and remote staffing platforms. Large enterprises increasingly rely on hybrid staffing solutions, pushing their share to over 59% by the end of the decade. Value-added services and digital workforce platforms expand recurring revenue streams, contributing to a more service-centric revenue mix.

From 2020 to 2024, the Overflow Staffing Services Market saw steady expansion as companies increasingly adopted flexible hiring models to manage fluctuating labor needs. Although detailed pre-2025 values are not shown, the 2025 baseline of USD 10.2 billion reflects strong pent-up demand and structural changes in workforce strategies post-COVID-19. During this period, the market was led by major staffing providers like Adecco, Randstad, and Manpower Group, with temporary staffing accounting for over half (53.4%) of total market revenue. Competitive differentiation was driven by speed of talent deployment, scalability, and sector specialization, particularly in logistics, healthcare, and IT.

By 2025, demand is accelerating due to the rise of gig platforms, on-demand staffing pools, and remote-ready workforce solutions. While traditional players maintain leadership, they face growing competition from tech-driven staffing platforms and workforce automation providers. Companies are shifting toward hybrid staffing models, blending hourly and project-based contracts, with a growing emphasis on data-driven workforce planning. Asia-Pacific emerges as the fastest-growing region, led by India (20.0% CAGR) and China (17.8% CAGR), driven by large enterprise demand and digital workforce transformation. Meanwhile, North America and Europe continue to represent mature, high-value markets with strong adoption across healthcare, IT, and logistics sectors.

Why the Overflow Staffing Services Market is growing?

The rapid growth of e-commerce and omni-channel retail has created unpredictable fluctuations in demand for labor, especially in warehousing, order fulfillment, and last-mile delivery. Overflow staffing services enable logistics companies to quickly scale their workforce during peak seasons and special sales events without long-term commitments. This flexibility reduces operational costs and mitigates risks associated with labor shortages, driving the increased adoption of temporary and surge staffing solutions in the sector.

Advancements in digital workforce management platforms and AI-powered talent matching have revolutionized how companies source and manage overflow staff. Remote staffing pools now allow enterprises to tap into geographically dispersed talent on demand, supporting business continuity and reducing dependency on local labor markets. Hybrid workforce models that blend onsite and remote staff provide companies with greater agility, especially in IT and back-office functions, significantly fueling the growth of overflow staffing services.

Segmental Analysis

The Overflow Staffing Services Market is segmented by service type, industry, client size, contract type, and region. Service types include temporary staffing, seasonal surge support, and remote staffing pools, with temporary staffing leading due to demand for flexible short-term labor. Key industries served are retail & e-commerce, healthcare, logistics, IT & back office, and events, reflecting diverse workforce needs across sectors. Large enterprises hold a dominant share in client size, though SMBs are increasingly adopting overflow staffing. Contract types span hourly, weekly, and project-based engagements, with hourly contracts prevailing for immediate labor flexibility. Regionally, North America remains a mature market, Asia-Pacific leads in growth driven by India and China, and Europe continues steady expansion supported by robust staffing infrastructures.
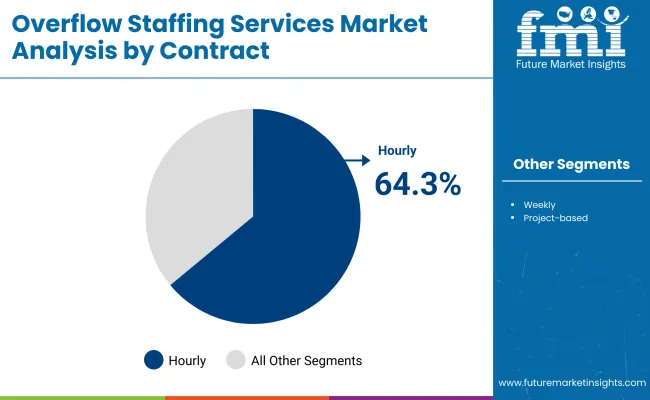
Insights into Contract Types with Hourly Contracts Leading Market Share

Overflow Staffing Services Market By Contract

Contract Value Share% 2025
Hourly 64.3%
Others 35.7%

Hourly contracts are projected to account for 64.3% of the Overflow Staffing Services Market revenue, establishing themselves as the dominant contract type. This preference is driven by businesses' need for flexible, short-term labor solutions that allow rapid workforce scaling to meet fluctuating demands across industries such as logistics, retail, and healthcare. Hourly contracts offer employers agility in managing peak workloads without long-term commitments.

The growth of the hourly contract segment is further supported by the increasing adoption of digital workforce platforms, enabling efficient scheduling and real-time management of temporary staff. Meanwhile, other contract types, including weekly and project-based engagements, are gaining traction as companies look to optimize staffing strategies for longer-term and specialized projects. Overall, hourly contracts will continue to be the backbone of overflow staffing services, reflecting market priorities for flexibility and responsiveness.
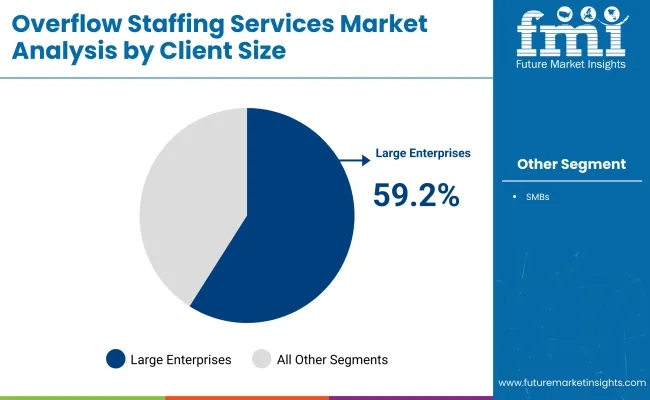
Insights into the Client Size Segment with Large Enterprises Leading Demand

Overflow Staffing Services Market By Client

Client Size Value Share% 2025
Large enterprises 59.2%
Others 40.8%

Large enterprises are projected to hold 59.2% of the Overflow Staffing Services Market share, driving the majority of demand for overflow staffing solutions. These organizations require scalable and flexible workforce solutions to manage complex operations across multiple locations, often facing fluctuating labor needs in sectors like logistics, healthcare, and IT services. Large enterprises benefit from established partnerships with staffing providers that can rapidly deploy skilled temporary workers at scale.

The significant market share held by large enterprises is supported by their increasing adoption of hybrid workforce models, combining permanent staff with flexible temporary and remote workers to optimize costs and agility. Meanwhile, small and medium-sized businesses (SMBs) continue to grow their adoption rates, but large enterprises remain the primary market drivers due to their volume and operational complexity.
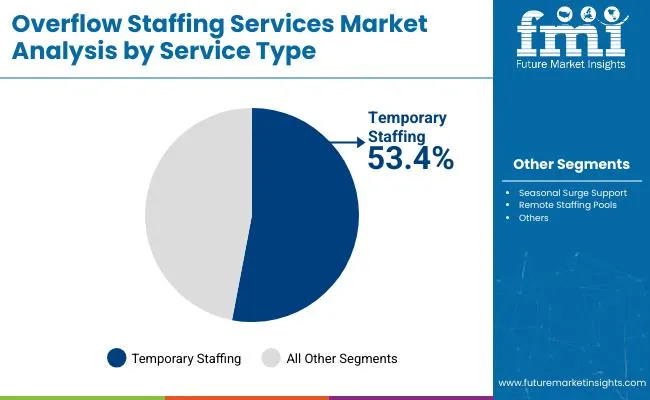
Insights into the Service Type Segment with Temporary Staffing Leading Market Share

Overflow Staffing Services Market By Service

Service Type Value Share% 2025
Temporary staffing 53.4%
Others 46.6%

Temporary staffing is projected to hold 53.4% of the Overflow Staffing Services Market revenue, making it the leading service type segment. This dominance is driven by organizations’ increasing reliance on temporary workers to address short-term labor needs, seasonal demand spikes, and project-specific workforce requirements. Temporary staffing provides companies with the flexibility to scale their labor force quickly without the long-term obligations associated with permanent hires.

The preference for temporary staffing is especially strong in industries such as retail, logistics, and healthcare, where demand volatility and rapid response times are critical. Meanwhile, other service types, including seasonal surge support and remote staffing pools, are growing as businesses seek more diversified and agile workforce solutions to meet evolving operational challenges.

What are the Drivers, Restraints, and Key Trends of the Overflow Staffing Services Market?

Rising Demand for Flexible Labor in Seasonal and Peak Periods

The growing unpredictability of consumer demand, especially in retail, logistics, and healthcare sectors, is driving the need for flexible labor solutions. Overflow staffing services allow companies to swiftly scale their workforce during seasonal surges, promotional events, and unexpected demand spikes without the burden of permanent hiring. This flexibility helps optimize labor costs and maintain service levels, making temporary staffing an essential strategy for businesses aiming to stay agile in volatile markets.

Advancements in Digital Workforce Management Technologies

The adoption of AI-powered talent platforms, cloud-based scheduling, and remote staffing tools is revolutionizing the overflow staffing landscape. These technologies enable efficient candidate matching, real-time workforce tracking, and seamless integration of remote and onsite labor pools. By enhancing operational efficiency and reducing time-to-hire, digital platforms empower organizations to deploy overflow staff quickly and cost-effectively, fostering broader acceptance of overflow staffing services across industries like IT, healthcare, and manufacturing.

Restraint: Regulatory and Compliance Challenges Across Geographies

Stringent and often inconsistent labor regulations present a significant hurdle for overflow staffing providers. Variations in worker classification laws, minimum wage standards, and contractual obligations increase the complexity and cost of compliance. This regulatory uncertainty can delay staffing deployments, discourage flexible workforce arrangements, and limit market penetration in regions with rigid labor laws. Consequently, companies may be hesitant to fully leverage overflow staffing, restraining market growth and innovation in certain markets.

Trend: Emergence of Hybrid Workforce Models Integrating Onsite and Remote Staff

Organizations are increasingly adopting hybrid workforce models that blend temporary onsite workers with remote and project-based staff. This approach addresses both immediate labor shortages and long-term skill gaps, enhancing operational agility and workforce resilience. Enabled by digital collaboration tools and flexible contract structures, hybrid staffing supports diverse work preferences and geographic dispersal. As a result, companies can optimize costs, improve productivity, and better respond to fluctuating business demands, driving broader acceptance of overflow staffing solutions.
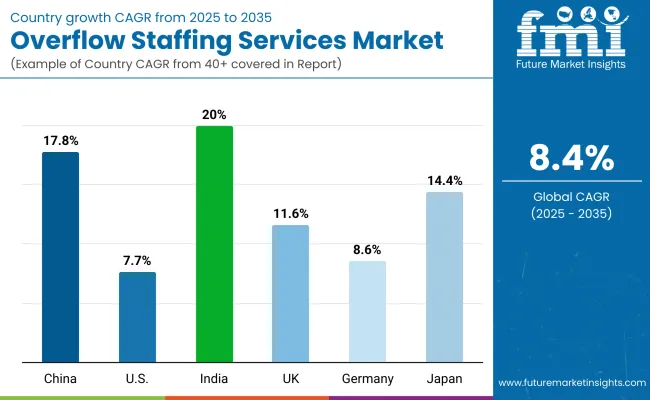
Analysis of Overflow Staffing Services Market By Key Countries

Overflow Staffing Services Market By Country

Countries Estimated CAGR (2025 to 2035)
China 17.8%
USA 7.7%
India 20.0%
UK 11.6%
Germany 8.6%
Japan 14.4%

The Overflow Staffing Services Market is set to witness diverse growth rates across key regions over the next decade. India is forecasted to lead with the highest CAGR of 20.0%, driven by rapid industrialization and an expanding service sector demanding flexible workforce solutions. China follows closely at 17.8%, supported by digital transformation initiatives and growing e-commerce logistics. Japan (14.4%) and the UK (11.6%) also show strong growth, propelled by technological adoption and evolving labor models. Germany and the U.S. display moderate growth at 8.6% and 7.7%, respectively, reflecting mature markets with steady demand for overflow staffing services.
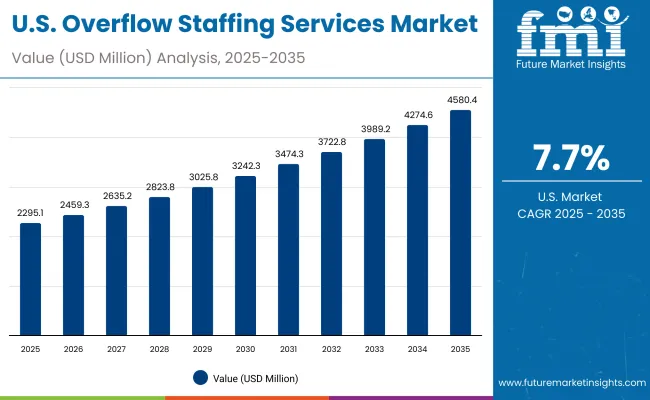
Sales Outlook for Overflow Staffing Services Market in the United States (2025 to 2035)

Overflow Staffing Services Market Usa

Year USA Overflow Staffing Services Market (USD Million)
2025 2295.11
2026 2459.32
2027 2635.27
2028 2823.81
2029 3025.84
2030 3242.32
2031 3474.30
2032 3722.87
2033 3989.22
2034 4274.63
2035 4580.46

The U.S. Overflow Staffing Services Market is projected to nearly double in value, growing from USD 2,295.11 million in 2025 to USD 4,580.46 million by 2035. This growth is driven by rising demand for flexible and specialized workforce solutions across technology-driven and high-precision industries such as aerospace, automotive, and defense. Companies increasingly rely on overflow staffing to handle project surges, maintain operational efficiency, and meet tight deadlines.

Healthcare, particularly hospitals and dental laboratories, represents a growing segment, with temporary staffing solutions helping manage fluctuating workloads efficiently. Additionally, the IT, entertainment, and education sectors are leveraging skilled temporary staff for short-term projects and digital modeling initiatives, creating new opportunities for overflow staffing providers.

The trend toward integrated service models, where staffing providers bundle personnel with training, technology support, or project management services, is encouraging closer collaboration between staffing firms and client organizations, optimizing workforce utilization and operational outcomes.

  • Skilled temporary workforce adoption in aerospace, automotive, and defense for precision projects.
  • Flexible staffing solutions in healthcare and dental laboratories to manage workload peaks.
  • Preference for bundled staffing + technology support services by IT, industrial design, and digital modeling teams.

Growth and Expansion Outlook for Overflow Staffing Services Market in the United Kingdom

The Overflow Staffing Services Market in the United Kingdom is expected to grow at a CAGR of 11.6%, supported by rising demand across engineering design, advanced manufacturing, and project-based industries requiring flexible workforce solutions. Motorsport and automotive engineering firms are increasingly leveraging overflow staffing to manage prototype development, testing, and race-part validation efficiently. Cultural institutions, museums, and heritage organizations are using temporary skilled staff for digitization and preservation projects. In retail and e-commerce, temporary talent is being deployed for AR-based design, virtual try-ons, and product visualization projects. Support from government innovation programs, public-private partnerships, and academic collaborations continues to drive enterprise and public-sector adoption of flexible staffing models.

  • Engineering teams in motorsports and automotive use temporary experts to accelerate prototype testing and lightweight component validation.
  • Institutions and heritage organizations hire skilled staff for artifact digitization and virtual archive creation.
  • Retailers and e-commerce platforms leverage temporary talent to integrate AR, scanning, and digital visualization tools for customer engagement.

Growth and Expansion Outlook for Overflow Staffing Services Market in India

India is witnessing rapid growth in the Overflow Staffing Services Market, which is forecast to expand at a CAGR of 20.0% through 2035. Growth is being driven by increased adoption across tier-2 and tier-3 cities due to cost efficiencies and rising awareness among MSMEs. Automotive suppliers are leveraging temporary skilled staff to validate component geometry and ensure alignment of CAD files with production processes. Educational institutes and vocational centers are incorporating scanning technologies into digital manufacturing and workforce training programs. Public infrastructure and archaeology departments are also investing in 3D scans for digital documentation of national monuments and historic sites.

  • Deployment of temporary skilled staff in smaller cities is rising to support cost-effective technology adoption.
  • Automotive suppliers are utilizing overflow staffing for CAD alignment, prototype validation, and production support.
  • Educational institutes and vocational centers are training students in scanning and digital manufacturing roles.

Sales Outlook for Overflow Staffing Services in China

The Overflow Staffing Services Market in China is expected to grow at a CAGR of 17.8%, the highest among leading economies. This strong growth is driven by smart factory implementations, city modeling programs, and competitive innovation from domestic technology firms. Industrial demand for automated inspection, rapid prototyping, and specialized project staffing has surged across electronics and automotive sectors. Municipal governments are increasingly leveraging skilled temporary staff for LiDAR-based city modeling, digital twin creation, and infrastructure planning. Affordable local solutions are also enabling widespread adoption of staffing for technology-driven projects in education, fashion, and e-commerce. Cross-sector digitization continues to be a primary growth driver.

  • City modeling initiatives and LiDAR deployments are increasing demand for skilled project staff.
  • Electronics and automotive firms are engaging overflow staffing for inspection, R&D, and prototyping tasks.
  • Competitive pricing from domestic technology providers is enabling mass adoption of skilled staffing in emerging sectors.

In-depth Analysis of Overflow Staffing Services in Germany

Countries 2025 Share (%)
USA 22.1%
China 11.3%
Japan 6.6%
Germany 14.5%
UK 8.0%
India 4.6%
Countries 2035 Share (%)
USA 19.6%
China 12.2%
Japan 7.9%
Germany 12.6%
UK 6.9%
India 5.6%

The Overflow Staffing Services Market in Germany is projected to grow at a CAGR of 8.6, driven by the country’s leadership in precision engineering, industrial automation, and high-end manufacturing. Factory floors are increasingly integrating skilled temporary staff to manage inline 3D scanning operations paired with robotic arms for dimensional inspection and live quality assurance monitoring. CNC workshops are utilizing structured light scanning specialists to validate complex geometries during milling and production processes. Dental and orthopedic laboratories are hiring skilled staff to implement digital modeling using intraoral and handheld scanners. Compliance with EU manufacturing standards, along with the rising emphasis on sustainable prototyping, continues to fuel the demand for specialized overflow staffing in traditional and additive manufacturing sectors.
  • Inline scanning operations are being paired with robotics to optimize QA and dimensional checks using temporary skilled staff.
  • Structured light scanning specialists support CNC processes for real-time geometry validation.
  • Dental and orthopedic labs are hiring staff for transitioning from mold-based to scanner-based digital modeling workflows.

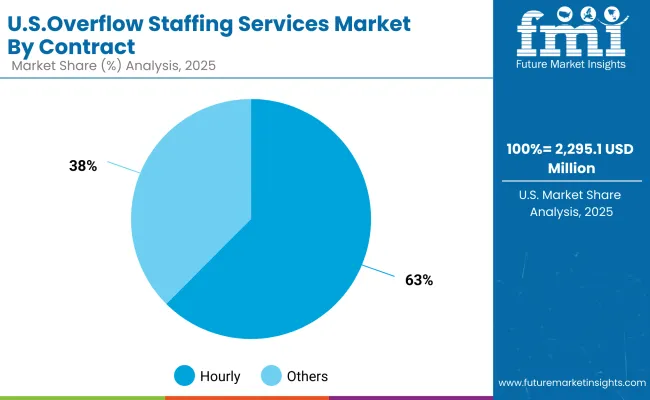
Growth Outlook for Overflow Staffing Services Market in USA

Overflow Staffing Services Market Usa 2

USA by Contract Value Share% 2025
Hourly 62.5%
Others 37.5%

The Overflow Staffing Services Market in the United States is projected at USD 2,295.11 million in 2025. Temporary staffing for high-skill roles dominates, with hourly contracts accounting for 62.5% of the market, reflecting demand for flexible, project-based workforce solutions. Specialized staffing services are increasingly bundled with digital platforms, training, and workflow integration, highlighting a shift toward value-added, data-driven workforce solutions.

Growth is fueled by industries such as aerospace, automotive, and IT, where continuous data modeling, digital twin implementation, and AI-driven predictive analytics require temporary deployment of skilled personnel. Companies are prioritizing seamless integration of project staff into digital workflows, enabling faster ramp-up times, enhanced productivity, and reduced operational risk.
  • Hourly contracts dominate at 62.5%, reflecting demand for flexible project-based staffing.
  • Growth driven by digital twin implementation, predictive analytics, and AI-based inspection in aerospace, automotive, and IT.
  • Bundled staffing solutions with training and technology support enhance workforce productivity and efficiency.

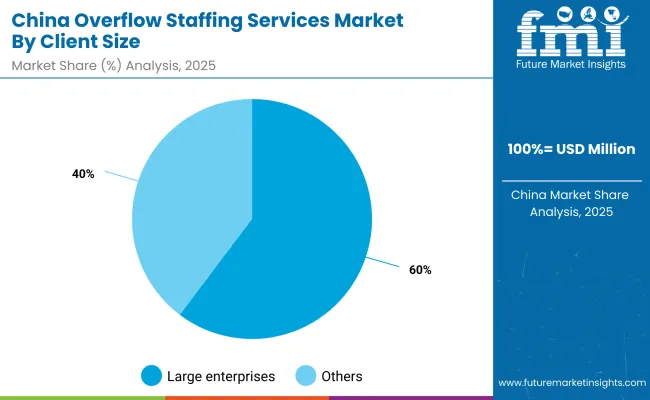
Opportunity Analysis of China Overflow Staffing Services Market

Overflow Staffing Services Market China

China by Client Size Value Share% 2025
Large enterprises 60.3%
Others 39.7%

The Overflow Staffing Services Market in China is projected to see strong growth in 2025, driven primarily by large enterprises, which account for 60.3% of the market. These companies require specialized temporary staff to manage high-volume, technology-intensive projects in sectors such as electronics, automotive, and advanced manufacturing. Short-term staffing solutions enable rapid scale-up for prototyping, production line optimization, and quality assurance workflows.

Smaller firms are increasingly adopting skilled overflow staffing for flexible project execution, particularly in emerging sectors like e-commerce, education, and smart city initiatives. The combination of government incentives, local talent availability, and competitive pricing from domestic providers supports widespread adoption across client segments.
  • Large enterprises dominate with 60.3% share, reflecting high demand for specialized project staff.
  • SMEs and smaller organizations are gradually adopting overflow staffing for digital, manufacturing, and infrastructure projects.
  • Rapid deployment of skilled personnel enables accelerated prototyping, quality assurance, and workflow integration in key industrial sectors.

Competitive Landscape of Overflow Staffing Services Market

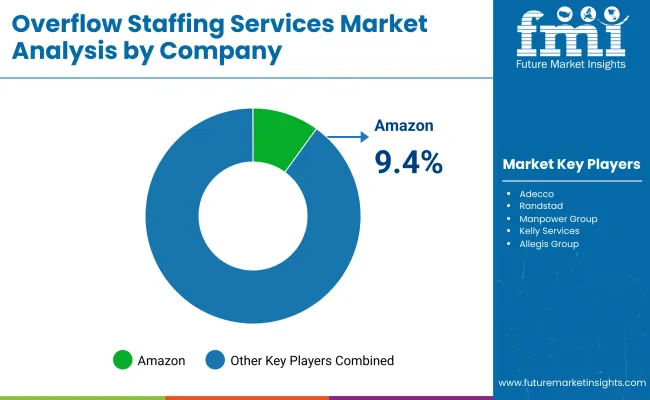
Overflow Staffing Services Market By Company

The Overflow Staffing Services Market is moderately fragmented, with global leaders, mid-sized innovators, and niche-focused specialists competing across multiple industries. The top 10 players Adecco, Randstad, ManpowerGroup, Kelly Services, Allegis Group, TrueBlue, Robert Half, Express Employment, Hays, and Aerotek hold significant market presence, offering specialized temporary staffing solutions for high-demand sectors such as automotive, aerospace, healthcare, and IT.

These companies focus on delivering flexible workforce solutions, project-based talent deployment, and value-added services, including training, digital workflow integration, and workforce analytics. Mid-sized and specialized providers complement these offerings by catering to niche industries, regional markets, or highly skilled temporary roles.

Competitive differentiation is increasingly shifting from simply providing personnel to offering integrated staffing ecosystems, combining predictive analytics, AR/VR-enabled training, digital workflow support, and subscription-based talent services to enhance client outcomes.

  • Top global players dominate with established client networks and large-scale project capabilities.
  • Mid-sized providers offer agility and specialized expertise in specific sectors.
  • Niche providers focus on application-specific staffing for smaller industries or regional markets.
  • Integrated digital solutions and value-added services are becoming key differentiators.

Key Developments in Overflow Staffing Services Market

  • 2024: Expansion of AI-driven staffing platforms - Leading staffing firms such as Randstad and Adecco integrated AI-based workforce analytics and predictive tools to optimize temporary talent allocation, improving efficiency in project staffing across automotive, aerospace, and IT sectors.
  • 2025: Rise of hybrid staffing models - Companies increasingly adopted hybrid solutions combining on-site temporary staff with remote digital workforce support, enabling flexible deployment for high-precision projects, training, and digital workflow integration.

Scope of the Report

Item Value
Quantitative Units USD 10,200.5 Million
Service Type Temporary staffing, Seasonal surge support, Remote staffing pools
Industry Retail & e-commerce, Healthcare, Logistics, IT & back office, Events
Client Size SMBs, Large enterprises
Contract Hourly, Weekly, Project-based
Regions Covered North America, Europe, Asia-Pacific, Latin America, Middle East & Africa
Country Covered United States, Canada, Germany, France, United Kingdom, China, Japan, India, Brazil, South Africa
Key Companies Profiled Adecco, Randstad, Manpower Group, Kelly Services, Allegis Group, TrueBlue, Robert Half, Express Employment, Hays, Aerotek
Additional Attributes Dollar revenue by service type and industry vertical, adoption trends in temporary and project-based staffing, rising demand for remote and hybrid workforce solutions, sector-specific growth in IT, healthcare, automotive, retail, and logistics, revenue segmentation by contract type (hourly, weekly, project-based), integration with digital workforce management platforms and AI-driven staffing analytics, regional trends influenced by labor regulations and digitization initiatives, and innovations in workforce optimization, skill-based deployment, and flexible staffing models.

Key Segments

By Service Type:

  • Temporary staffing
  • Seasonal surge support
  • Remote staffing pools

By Industry:

  • Retail & e-commerce
  • Healthcare
  • Logistics
  • IT & back office
  • Events

By Client Size:

  • SMBs
  • Large enterprises

By Contract:

  • Hourly
  • Weekly
  • Project-based

By Region:

  • North America
  • Latin America
  • Europe
  • East Asia
  • South Asia & Pacific
  • Middle East and Africa

Table of Content

  1. Executive Summary
    • Global Market Outlook
    • Demand-side Trends
    • Supply-side Trends
    • Technology Roadmap Analysis
    • Analysis and Recommendations
  2. Market Overview
    • Market Coverage / Taxonomy
    • Market Definition / Scope / Limitations
  3. Market Background
    • Market Dynamics
      • Drivers
      • Restraints
      • Opportunity
      • Trends
    • Scenario Forecast
      • Demand in Optimistic Scenario
      • Demand in Likely Scenario
      • Demand in Conservative Scenario
    • Opportunity Map Analysis
    • Product Life Cycle Analysis
    • Supply Chain Analysis
      • Supply Side Participants and their Roles
        • Producers
        • Mid-Level Participants (Traders/ Agents/ Brokers)
        • Wholesalers and Distributors
      • Value Added and Value Created at Node in the Supply Chain
      • List of Raw Material Suppliers
      • List of Existing and Potential Buyer’s
    • Investment Feasibility Matrix
    • Value Chain Analysis
      • Profit Margin Analysis
      • Wholesalers and Distributors
      • Retailers
    • PESTLE and Porter’s Analysis
    • Regulatory Landscape
      • By Key Regions
      • By Key Countries
    • Regional Parent Market Outlook
    • Production and Consumption Statistics
    • Import and Export Statistics
  4. Global Market Analysis 2020 to 2024 and Forecast, 2025 to 2035
    • Historical Market Size Value (USD Million) & Volume (Units) Analysis, 2020 to 2024
    • Current and Future Market Size Value (USD Million) & Volume (Units) Projections, 2025 to 2035
      • Y-o-Y Growth Trend Analysis
      • Absolute $ Opportunity Analysis
  5. Global Market Analysis 2020 to 2024 and Forecast 2025 to 2035, By Service Type
    • Introduction / Key Findings
    • Historical Market Size Value (USD Million) & Volume (Units) Analysis By Service Type, 2020 to 2024
    • Current and Future Market Size Value (USD Million) & Volume (Units) Analysis and Forecast By Service Type, 2025 to 2035
      • Temporary staffing
      • Seasonal surge support
      • Remote staffing pools
    • Y-o-Y Growth Trend Analysis By Service Type, 2020 to 2024
    • Absolute $ Opportunity Analysis By Service Type, 2025 to 2035
  6. Global Market Analysis 2020 to 2024 and Forecast 2025 to 2035, By Industry
    • Introduction / Key Findings
    • Historical Market Size Value (USD Million) & Volume (Units) Analysis By Industry, 2020 to 2024
    • Current and Future Market Size Value (USD Million) & Volume (Units) Analysis and Forecast By Industry, 2025 to 2035
      • Retail & e-commerce
      • Healthcare
      • Logistics
      • IT & back office
      • Events
    • Y-o-Y Growth Trend Analysis By Industry, 2020 to 2024
    • Absolute $ Opportunity Analysis By Industry, 2025 to 2035
  7. Global Market Analysis 2020 to 2024 and Forecast 2025 to 2035, By Client Size
    • Introduction / Key Findings
    • Historical Market Size Value (USD Million) & Volume (Units) Analysis By Client Size, 2020 to 2024
    • Current and Future Market Size Value (USD Million) & Volume (Units) Analysis and Forecast By Client Size, 2025 to 2035
      • SMBs
      • Large enterprises
    • Y-o-Y Growth Trend Analysis By Client Size, 2020 to 2024
    • Absolute $ Opportunity Analysis By Client Size, 2025 to 2035
  8. Global Market Analysis 2020 to 2024 and Forecast 2025 to 2035, By Contract
    • Introduction / Key Findings
    • Historical Market Size Value (USD Million) & Volume (Units) Analysis By Contract, 2020 to 2024
    • Current and Future Market Size Value (USD Million) & Volume (Units) Analysis and Forecast By Contract, 2025 to 2035
      • Hourly
      • Weekly
      • Project-based
    • Y-o-Y Growth Trend Analysis By Contract, 2020 to 2024
    • Absolute $ Opportunity Analysis By Contract, 2025 to 2035
  9. Global Market Analysis 2020 to 2024 and Forecast 2025 to 2035, By Region
    • Introduction
    • Historical Market Size Value (USD Million) & Volume (Units) Analysis By Region, 2020 to 2024
    • Current Market Size Value (USD Million) & Volume (Units) Analysis and Forecast By Region, 2025 to 2035
      • North America
      • Latin America
      • Europe
      • East Asia
      • South Asia & Pacific
      • Middle East and Africa
    • Market Attractiveness Analysis By Region
  10. North America Market Analysis 2020 to 2024 and Forecast 2025 to 2035, By Country
    • Historical Market Size Value (USD Million) & Volume (Units) Trend Analysis By Market Taxonomy, 2020 to 2024
    • Market Size Value (USD Million) & Volume (Units) Forecast By Market Taxonomy, 2025 to 2035
      • By Country
        • USA
        • Canada
      • By Service Type
      • By Industry
      • By Client Size
      • By Contract
    • Market Attractiveness Analysis
      • By Country
      • By Service Type
      • By Industry
      • By Client Size
      • By Contract
    • Key Takeaways
  11. Latin America Market Analysis 2020 to 2024 and Forecast 2025 to 2035, By Country
    • Historical Market Size Value (USD Million) & Volume (Units) Trend Analysis By Market Taxonomy, 2020 to 2024
    • Market Size Value (USD Million) & Volume (Units) Forecast By Market Taxonomy, 2025 to 2035
      • By Country
        • Brazil
        • Mexico
        • Colombia
        • Rest of Latin America
      • By Service Type
      • By Industry
      • By Client Size
      • By Contract
    • Market Attractiveness Analysis
      • By Country
      • By Service Type
      • By Industry
      • By Client Size
      • By Contract
    • Key Takeaways
  12. Europe Market Analysis 2020 to 2024 and Forecast 2025 to 2035, By Country
    • Historical Market Size Value (USD Million) & Volume (Units) Trend Analysis By Market Taxonomy, 2020 to 2024
    • Market Size Value (USD Million) & Volume (Units) Forecast By Market Taxonomy, 2025 to 2035
      • By Country
        • Germany
        • UK
        • France
        • Italy
        • Spain
        • Belgium
        • Netherlands
        • Nordic
        • Switzerland
        • Russia
        • Poland
        • Rest of Europe
      • By Service Type
      • By Industry
      • By Client Size
      • By Contract
    • Market Attractiveness Analysis
      • By Country
      • By Service Type
      • By Industry
      • By Client Size
      • By Contract
    • Key Takeaways
  13. East Asia Market Analysis 2020 to 2024 and Forecast 2025 to 2035, By Country
    • Historical Market Size Value (USD Million) & Volume (Units) Trend Analysis By Market Taxonomy, 2020 to 2024
    • Market Size Value (USD Million) & Volume (Units) Forecast By Market Taxonomy, 2025 to 2035
      • By Country
        • China
        • Japan
        • South Korea
      • By Service Type
      • By Industry
      • By Client Size
      • By Contract
    • Market Attractiveness Analysis
      • By Country
      • By Service Type
      • By Industry
      • By Client Size
      • By Contract
    • Key Takeaways
  14. South Asia & Pacific Market Analysis 2020 to 2024 and Forecast 2025 to 2035, By Country
    • Historical Market Size Value (USD Million) & Volume (Units) Trend Analysis By Market Taxonomy, 2020 to 2024
    • Market Size Value (USD Million) & Volume (Units) Forecast By Market Taxonomy, 2025 to 2035
      • By Country
        • India
        • Thailand
        • Malaysia
        • Indonesia
        • Singapore
        • Vietnam
        • Australia
        • New Zealand
        • Rest of South Asia
      • By Service Type
      • By Industry
      • By Client Size
      • By Contract
    • Market Attractiveness Analysis
      • By Country
      • By Service Type
      • By Industry
      • By Client Size
      • By Contract
    • Key Takeaways
  15. Middle East and Africa Market Analysis 2020 to 2024 and Forecast 2025 to 2035, By Country
    • Historical Market Size Value (USD Million) & Volume (Units) Trend Analysis By Market Taxonomy, 2020 to 2024
    • Market Size Value (USD Million) & Volume (Units) Forecast By Market Taxonomy, 2025 to 2035
      • By Country
        • Turkey
        • UAE
        • Saudi Arabia
        • Israel
        • Other GCC Countries
        • North Africa
        • South Africa
      • By Service Type
      • By Industry
      • By Client Size
      • By Contract
    • Market Attractiveness Analysis
      • By Country
      • By Service Type
      • By Industry
      • By Client Size
      • By Contract
    • Key Takeaways
  16. Key Countries Market Analysis
    • USA
      • Pricing Analysis
      • Market Share Analysis, 2024
        • By Service Type
        • By Industry
        • By Client Size
        • By Contract
    • Canada
      • Pricing Analysis
      • Market Share Analysis, 2024
        • By Service Type
        • By Industry
        • By Client Size
        • By Contract
    • Brazil
      • Pricing Analysis
      • Market Share Analysis, 2024
        • By Service Type
        • By Industry
        • By Client Size
        • By Contract
    • Mexico
      • Pricing Analysis
      • Market Share Analysis, 2024
        • By Service Type
        • By Industry
        • By Client Size
        • By Contract
    • Colombia
      • Pricing Analysis
      • Market Share Analysis, 2024
        • By Service Type
        • By Industry
        • By Client Size
        • By Contract
    • Germany
      • Pricing Analysis
      • Market Share Analysis, 2024
        • By Service Type
        • By Industry
        • By Client Size
        • By Contract
    • UK
      • Pricing Analysis
      • Market Share Analysis, 2024
        • By Service Type
        • By Industry
        • By Client Size
        • By Contract
    • France
      • Pricing Analysis
      • Market Share Analysis, 2024
        • By Service Type
        • By Industry
        • By Client Size
        • By Contract
    • Italy
      • Pricing Analysis
      • Market Share Analysis, 2024
        • By Service Type
        • By Industry
        • By Client Size
        • By Contract
    • Spain
      • Pricing Analysis
      • Market Share Analysis, 2024
        • By Service Type
        • By Industry
        • By Client Size
        • By Contract
    • Belgium
      • Pricing Analysis
      • Market Share Analysis, 2024
        • By Service Type
        • By Industry
        • By Client Size
        • By Contract
    • Netherlands
      • Pricing Analysis
      • Market Share Analysis, 2024
        • By Service Type
        • By Industry
        • By Client Size
        • By Contract
    • Nordic
      • Pricing Analysis
      • Market Share Analysis, 2024
        • By Service Type
        • By Industry
        • By Client Size
        • By Contract
    • Switzerland
      • Pricing Analysis
      • Market Share Analysis, 2024
        • By Service Type
        • By Industry
        • By Client Size
        • By Contract
    • Russia
      • Pricing Analysis
      • Market Share Analysis, 2024
        • By Service Type
        • By Industry
        • By Client Size
        • By Contract
    • Poland
      • Pricing Analysis
      • Market Share Analysis, 2024
        • By Service Type
        • By Industry
        • By Client Size
        • By Contract
    • China
      • Pricing Analysis
      • Market Share Analysis, 2024
        • By Service Type
        • By Industry
        • By Client Size
        • By Contract
    • Japan
      • Pricing Analysis
      • Market Share Analysis, 2024
        • By Service Type
        • By Industry
        • By Client Size
        • By Contract
    • South Korea
      • Pricing Analysis
      • Market Share Analysis, 2024
        • By Service Type
        • By Industry
        • By Client Size
        • By Contract
    • India
      • Pricing Analysis
      • Market Share Analysis, 2024
        • By Service Type
        • By Industry
        • By Client Size
        • By Contract
    • Thailand
      • Pricing Analysis
      • Market Share Analysis, 2024
        • By Service Type
        • By Industry
        • By Client Size
        • By Contract
    • Indonesia
      • Pricing Analysis
      • Market Share Analysis, 2024
        • By Service Type
        • By Industry
        • By Client Size
        • By Contract
    • Australia
      • Pricing Analysis
      • Market Share Analysis, 2024
        • By Service Type
        • By Industry
        • By Client Size
        • By Contract
    • New Zealand
      • Pricing Analysis
      • Market Share Analysis, 2024
        • By Service Type
        • By Industry
        • By Client Size
        • By Contract
    • Turkey
      • Pricing Analysis
      • Market Share Analysis, 2024
        • By Service Type
        • By Industry
        • By Client Size
        • By Contract
    • UAE
      • Pricing Analysis
      • Market Share Analysis, 2024
        • By Service Type
        • By Industry
        • By Client Size
        • By Contract
    • Saudi Arabia
      • Pricing Analysis
      • Market Share Analysis, 2024
        • By Service Type
        • By Industry
        • By Client Size
        • By Contract
    • Israel
      • Pricing Analysis
      • Market Share Analysis, 2024
        • By Service Type
        • By Industry
        • By Client Size
        • By Contract
    • North Africa
      • Pricing Analysis
      • Market Share Analysis, 2024
        • By Service Type
        • By Industry
        • By Client Size
        • By Contract
    • South Africa
      • Pricing Analysis
      • Market Share Analysis, 2024
        • By Service Type
        • By Industry
        • By Client Size
        • By Contract
  17. Market Structure Analysis
    • Competition Dashboard
    • Competition Benchmarking
    • Market Share Analysis of Top Players
      • By Regional
      • By Service Type
      • By Industry
      • By Client Size
      • By Contract
  18. Competition Analysis
    • Competition Deep Dive
      • Adecco
        • Overview
        • Product Portfolio
        • Profitability by Market Segments (Product/Age /Sales Channel/Region)
        • Sales Footprint
        • Strategy Overview
          • Marketing Strategy
          • Product Strategy
          • Channel Strategy
      • Randstad
        • Overview
        • Product Portfolio
        • Profitability by Market Segments (Product/Age /Sales Channel/Region)
        • Sales Footprint
        • Strategy Overview
          • Marketing Strategy
          • Product Strategy
          • Channel Strategy
      • ManpowerGroup
        • Overview
        • Product Portfolio
        • Profitability by Market Segments (Product/Age /Sales Channel/Region)
        • Sales Footprint
        • Strategy Overview
          • Marketing Strategy
          • Product Strategy
          • Channel Strategy
      • Kelly Services
        • Overview
        • Product Portfolio
        • Profitability by Market Segments (Product/Age /Sales Channel/Region)
        • Sales Footprint
        • Strategy Overview
          • Marketing Strategy
          • Product Strategy
          • Channel Strategy
      • Allegis Group
        • Overview
        • Product Portfolio
        • Profitability by Market Segments (Product/Age /Sales Channel/Region)
        • Sales Footprint
        • Strategy Overview
          • Marketing Strategy
          • Product Strategy
          • Channel Strategy
      • TrueBlue
        • Overview
        • Product Portfolio
        • Profitability by Market Segments (Product/Age /Sales Channel/Region)
        • Sales Footprint
        • Strategy Overview
          • Marketing Strategy
          • Product Strategy
          • Channel Strategy
      • Robert Half
        • Overview
        • Product Portfolio
        • Profitability by Market Segments (Product/Age /Sales Channel/Region)
        • Sales Footprint
        • Strategy Overview
          • Marketing Strategy
          • Product Strategy
          • Channel Strategy
      • Express Employment
        • Overview
        • Product Portfolio
        • Profitability by Market Segments (Product/Age /Sales Channel/Region)
        • Sales Footprint
        • Strategy Overview
          • Marketing Strategy
          • Product Strategy
          • Channel Strategy
      • Hays
        • Overview
        • Product Portfolio
        • Profitability by Market Segments (Product/Age /Sales Channel/Region)
        • Sales Footprint
        • Strategy Overview
          • Marketing Strategy
          • Product Strategy
          • Channel Strategy
      • Aerotek
        • Overview
        • Product Portfolio
        • Profitability by Market Segments (Product/Age /Sales Channel/Region)
        • Sales Footprint
        • Strategy Overview
          • Marketing Strategy
          • Product Strategy
          • Channel Strategy
      • Others
        • Overview
        • Product Portfolio
        • Profitability by Market Segments (Product/Age /Sales Channel/Region)
        • Sales Footprint
        • Strategy Overview
          • Marketing Strategy
          • Product Strategy
          • Channel Strategy
  19. Assumptions & Acronyms Used
  20. Research Methodology

List of Tables

  • Table 1: Global Market Value (USD Million) Forecast by Region, 2020-2035
  • Table 2: Global Market Volume (Units) Forecast by Region, 2020-2035
  • Table 3: Global Market Value (USD Million) Forecast by Service Type, 2020-2035
  • Table 4: Global Market Volume (Units) Forecast by Service Type, 2020-2035
  • Table 5: Global Market Value (USD Million) Forecast by Industry, 2020-2035
  • Table 6: Global Market Volume (Units) Forecast by Industry, 2020-2035
  • Table 7: Global Market Value (USD Million) Forecast by Client Size, 2020-2035
  • Table 8: Global Market Volume (Units) Forecast by Client Size, 2020-2035
  • Table 9: Global Market Value (USD Million) Forecast by Contract, 2020-2035
  • Table 10: Global Market Volume (Units) Forecast by Contract, 2020-2035
  • Table 11: North America Market Value (USD Million) Forecast by Country, 2020-2035
  • Table 12: North America Market Volume (Units) Forecast by Country, 2020-2035
  • Table 13: North America Market Value (USD Million) Forecast by Service Type, 2020-2035
  • Table 14: North America Market Volume (Units) Forecast by Service Type, 2020-2035
  • Table 15: North America Market Value (USD Million) Forecast by Industry, 2020-2035
  • Table 16: North America Market Volume (Units) Forecast by Industry, 2020-2035
  • Table 17: North America Market Value (USD Million) Forecast by Client Size, 2020-2035
  • Table 18: North America Market Volume (Units) Forecast by Client Size, 2020-2035
  • Table 19: North America Market Value (USD Million) Forecast by Contract, 2020-2035
  • Table 20: North America Market Volume (Units) Forecast by Contract, 2020-2035
  • Table 21: Latin America Market Value (USD Million) Forecast by Country, 2020-2035
  • Table 22: Latin America Market Volume (Units) Forecast by Country, 2020-2035
  • Table 23: Latin America Market Value (USD Million) Forecast by Service Type, 2020-2035
  • Table 24: Latin America Market Volume (Units) Forecast by Service Type, 2020-2035
  • Table 25: Latin America Market Value (USD Million) Forecast by Industry, 2020-2035
  • Table 26: Latin America Market Volume (Units) Forecast by Industry, 2020-2035
  • Table 27: Latin America Market Value (USD Million) Forecast by Client Size, 2020-2035
  • Table 28: Latin America Market Volume (Units) Forecast by Client Size, 2020-2035
  • Table 29: Latin America Market Value (USD Million) Forecast by Contract, 2020-2035
  • Table 30: Latin America Market Volume (Units) Forecast by Contract, 2020-2035
  • Table 31: Europe Market Value (USD Million) Forecast by Country, 2020-2035
  • Table 32: Europe Market Volume (Units) Forecast by Country, 2020-2035
  • Table 33: Europe Market Value (USD Million) Forecast by Service Type, 2020-2035
  • Table 34: Europe Market Volume (Units) Forecast by Service Type, 2020-2035
  • Table 35: Europe Market Value (USD Million) Forecast by Industry, 2020-2035
  • Table 36: Europe Market Volume (Units) Forecast by Industry, 2020-2035
  • Table 37: Europe Market Value (USD Million) Forecast by Client Size, 2020-2035
  • Table 38: Europe Market Volume (Units) Forecast by Client Size, 2020-2035
  • Table 39: Europe Market Value (USD Million) Forecast by Contract, 2020-2035
  • Table 40: Europe Market Volume (Units) Forecast by Contract, 2020-2035
  • Table 41: East Asia Market Value (USD Million) Forecast by Country, 2020-2035
  • Table 42: East Asia Market Volume (Units) Forecast by Country, 2020-2035
  • Table 43: East Asia Market Value (USD Million) Forecast by Service Type, 2020-2035
  • Table 44: East Asia Market Volume (Units) Forecast by Service Type, 2020-2035
  • Table 45: East Asia Market Value (USD Million) Forecast by Industry, 2020-2035
  • Table 46: East Asia Market Volume (Units) Forecast by Industry, 2020-2035
  • Table 47: East Asia Market Value (USD Million) Forecast by Client Size, 2020-2035
  • Table 48: East Asia Market Volume (Units) Forecast by Client Size, 2020-2035
  • Table 49: East Asia Market Value (USD Million) Forecast by Contract, 2020-2035
  • Table 50: East Asia Market Volume (Units) Forecast by Contract, 2020-2035
  • Table 51: South Asia & Pacific Market Value (USD Million) Forecast by Country, 2020-2035
  • Table 52: South Asia & Pacific Market Volume (Units) Forecast by Country, 2020-2035
  • Table 53: South Asia & Pacific Market Value (USD Million) Forecast by Service Type, 2020-2035
  • Table 54: South Asia & Pacific Market Volume (Units) Forecast by Service Type, 2020-2035
  • Table 55: South Asia & Pacific Market Value (USD Million) Forecast by Industry, 2020-2035
  • Table 56: South Asia & Pacific Market Volume (Units) Forecast by Industry, 2020-2035
  • Table 57: South Asia & Pacific Market Value (USD Million) Forecast by Client Size, 2020-2035
  • Table 58: South Asia & Pacific Market Volume (Units) Forecast by Client Size, 2020-2035
  • Table 59: South Asia & Pacific Market Value (USD Million) Forecast by Contract, 2020-2035
  • Table 60: South Asia & Pacific Market Volume (Units) Forecast by Contract, 2020-2035
  • Table 61: Middle East and Africa Market Value (USD Million) Forecast by Country, 2020-2035
  • Table 62: Middle East and Africa Market Volume (Units) Forecast by Country, 2020-2035
  • Table 63: Middle East and Africa Market Value (USD Million) Forecast by Service Type, 2020-2035
  • Table 64: Middle East and Africa Market Volume (Units) Forecast by Service Type, 2020-2035
  • Table 65: Middle East and Africa Market Value (USD Million) Forecast by Industry, 2020-2035
  • Table 66: Middle East and Africa Market Volume (Units) Forecast by Industry, 2020-2035
  • Table 67: Middle East and Africa Market Value (USD Million) Forecast by Client Size, 2020-2035
  • Table 68: Middle East and Africa Market Volume (Units) Forecast by Client Size, 2020-2035
  • Table 69: Middle East and Africa Market Value (USD Million) Forecast by Contract, 2020-2035
  • Table 70: Middle East and Africa Market Volume (Units) Forecast by Contract, 2020-2035

List of Figures

  • Figure 1: Global Market Value (USD Million) by Service Type, 2025-2035
  • Figure 2: Global Market Value (USD Million) by Industry, 2025-2035
  • Figure 3: Global Market Value (USD Million) by Client Size, 2025-2035
  • Figure 4: Global Market Value (USD Million) by Contract, 2025-2035
  • Figure 5: Global Market Value (USD Million) by Region, 2025-2035
  • Figure 6: Global Market Value (USD Million) Analysis by Region, 2020-2035
  • Figure 7: Global Market Volume (Units) Analysis by Region, 2020-2035
  • Figure 8: Global Market Value Share (%) and BPS Analysis by Region, 2025-2035
  • Figure 9: Global Market Y-o-Y Growth (%) Projections by Region, 2025-2035
  • Figure 10: Global Market Value (USD Million) Analysis by Service Type, 2020-2035
  • Figure 11: Global Market Volume (Units) Analysis by Service Type, 2020-2035
  • Figure 12: Global Market Value Share (%) and BPS Analysis by Service Type, 2025-2035
  • Figure 13: Global Market Y-o-Y Growth (%) Projections by Service Type, 2025-2035
  • Figure 14: Global Market Value (USD Million) Analysis by Industry, 2020-2035
  • Figure 15: Global Market Volume (Units) Analysis by Industry, 2020-2035
  • Figure 16: Global Market Value Share (%) and BPS Analysis by Industry, 2025-2035
  • Figure 17: Global Market Y-o-Y Growth (%) Projections by Industry, 2025-2035
  • Figure 18: Global Market Value (USD Million) Analysis by Client Size, 2020-2035
  • Figure 19: Global Market Volume (Units) Analysis by Client Size, 2020-2035
  • Figure 20: Global Market Value Share (%) and BPS Analysis by Client Size, 2025-2035
  • Figure 21: Global Market Y-o-Y Growth (%) Projections by Client Size, 2025-2035
  • Figure 22: Global Market Value (USD Million) Analysis by Contract, 2020-2035
  • Figure 23: Global Market Volume (Units) Analysis by Contract, 2020-2035
  • Figure 24: Global Market Value Share (%) and BPS Analysis by Contract, 2025-2035
  • Figure 25: Global Market Y-o-Y Growth (%) Projections by Contract, 2025-2035
  • Figure 26: Global Market Attractiveness by Service Type, 2025-2035
  • Figure 27: Global Market Attractiveness by Industry, 2025-2035
  • Figure 28: Global Market Attractiveness by Client Size, 2025-2035
  • Figure 29: Global Market Attractiveness by Contract, 2025-2035
  • Figure 30: Global Market Attractiveness by Region, 2025-2035
  • Figure 31: North America Market Value (USD Million) by Service Type, 2025-2035
  • Figure 32: North America Market Value (USD Million) by Industry, 2025-2035
  • Figure 33: North America Market Value (USD Million) by Client Size, 2025-2035
  • Figure 34: North America Market Value (USD Million) by Contract, 2025-2035
  • Figure 35: North America Market Value (USD Million) by Country, 2025-2035
  • Figure 36: North America Market Value (USD Million) Analysis by Country, 2020-2035
  • Figure 37: North America Market Volume (Units) Analysis by Country, 2020-2035
  • Figure 38: North America Market Value Share (%) and BPS Analysis by Country, 2025-2035
  • Figure 39: North America Market Y-o-Y Growth (%) Projections by Country, 2025-2035
  • Figure 40: North America Market Value (USD Million) Analysis by Service Type, 2020-2035
  • Figure 41: North America Market Volume (Units) Analysis by Service Type, 2020-2035
  • Figure 42: North America Market Value Share (%) and BPS Analysis by Service Type, 2025-2035
  • Figure 43: North America Market Y-o-Y Growth (%) Projections by Service Type, 2025-2035
  • Figure 44: North America Market Value (USD Million) Analysis by Industry, 2020-2035
  • Figure 45: North America Market Volume (Units) Analysis by Industry, 2020-2035
  • Figure 46: North America Market Value Share (%) and BPS Analysis by Industry, 2025-2035
  • Figure 47: North America Market Y-o-Y Growth (%) Projections by Industry, 2025-2035
  • Figure 48: North America Market Value (USD Million) Analysis by Client Size, 2020-2035
  • Figure 49: North America Market Volume (Units) Analysis by Client Size, 2020-2035
  • Figure 50: North America Market Value Share (%) and BPS Analysis by Client Size, 2025-2035
  • Figure 51: North America Market Y-o-Y Growth (%) Projections by Client Size, 2025-2035
  • Figure 52: North America Market Value (USD Million) Analysis by Contract, 2020-2035
  • Figure 53: North America Market Volume (Units) Analysis by Contract, 2020-2035
  • Figure 54: North America Market Value Share (%) and BPS Analysis by Contract, 2025-2035
  • Figure 55: North America Market Y-o-Y Growth (%) Projections by Contract, 2025-2035
  • Figure 56: North America Market Attractiveness by Service Type, 2025-2035
  • Figure 57: North America Market Attractiveness by Industry, 2025-2035
  • Figure 58: North America Market Attractiveness by Client Size, 2025-2035
  • Figure 59: North America Market Attractiveness by Contract, 2025-2035
  • Figure 60: North America Market Attractiveness by Country, 2025-2035
  • Figure 61: Latin America Market Value (USD Million) by Service Type, 2025-2035
  • Figure 62: Latin America Market Value (USD Million) by Industry, 2025-2035
  • Figure 63: Latin America Market Value (USD Million) by Client Size, 2025-2035
  • Figure 64: Latin America Market Value (USD Million) by Contract, 2025-2035
  • Figure 65: Latin America Market Value (USD Million) by Country, 2025-2035
  • Figure 66: Latin America Market Value (USD Million) Analysis by Country, 2020-2035
  • Figure 67: Latin America Market Volume (Units) Analysis by Country, 2020-2035
  • Figure 68: Latin America Market Value Share (%) and BPS Analysis by Country, 2025-2035
  • Figure 69: Latin America Market Y-o-Y Growth (%) Projections by Country, 2025-2035
  • Figure 70: Latin America Market Value (USD Million) Analysis by Service Type, 2020-2035
  • Figure 71: Latin America Market Volume (Units) Analysis by Service Type, 2020-2035
  • Figure 72: Latin America Market Value Share (%) and BPS Analysis by Service Type, 2025-2035
  • Figure 73: Latin America Market Y-o-Y Growth (%) Projections by Service Type, 2025-2035
  • Figure 74: Latin America Market Value (USD Million) Analysis by Industry, 2020-2035
  • Figure 75: Latin America Market Volume (Units) Analysis by Industry, 2020-2035
  • Figure 76: Latin America Market Value Share (%) and BPS Analysis by Industry, 2025-2035
  • Figure 77: Latin America Market Y-o-Y Growth (%) Projections by Industry, 2025-2035
  • Figure 78: Latin America Market Value (USD Million) Analysis by Client Size, 2020-2035
  • Figure 79: Latin America Market Volume (Units) Analysis by Client Size, 2020-2035
  • Figure 80: Latin America Market Value Share (%) and BPS Analysis by Client Size, 2025-2035
  • Figure 81: Latin America Market Y-o-Y Growth (%) Projections by Client Size, 2025-2035
  • Figure 82: Latin America Market Value (USD Million) Analysis by Contract, 2020-2035
  • Figure 83: Latin America Market Volume (Units) Analysis by Contract, 2020-2035
  • Figure 84: Latin America Market Value Share (%) and BPS Analysis by Contract, 2025-2035
  • Figure 85: Latin America Market Y-o-Y Growth (%) Projections by Contract, 2025-2035
  • Figure 86: Latin America Market Attractiveness by Service Type, 2025-2035
  • Figure 87: Latin America Market Attractiveness by Industry, 2025-2035
  • Figure 88: Latin America Market Attractiveness by Client Size, 2025-2035
  • Figure 89: Latin America Market Attractiveness by Contract, 2025-2035
  • Figure 90: Latin America Market Attractiveness by Country, 2025-2035
  • Figure 91: Europe Market Value (USD Million) by Service Type, 2025-2035
  • Figure 92: Europe Market Value (USD Million) by Industry, 2025-2035
  • Figure 93: Europe Market Value (USD Million) by Client Size, 2025-2035
  • Figure 94: Europe Market Value (USD Million) by Contract, 2025-2035
  • Figure 95: Europe Market Value (USD Million) by Country, 2025-2035
  • Figure 96: Europe Market Value (USD Million) Analysis by Country, 2020-2035
  • Figure 97: Europe Market Volume (Units) Analysis by Country, 2020-2035
  • Figure 98: Europe Market Value Share (%) and BPS Analysis by Country, 2025-2035
  • Figure 99: Europe Market Y-o-Y Growth (%) Projections by Country, 2025-2035
  • Figure 100: Europe Market Value (USD Million) Analysis by Service Type, 2020-2035
  • Figure 101: Europe Market Volume (Units) Analysis by Service Type, 2020-2035
  • Figure 102: Europe Market Value Share (%) and BPS Analysis by Service Type, 2025-2035
  • Figure 103: Europe Market Y-o-Y Growth (%) Projections by Service Type, 2025-2035
  • Figure 104: Europe Market Value (USD Million) Analysis by Industry, 2020-2035
  • Figure 105: Europe Market Volume (Units) Analysis by Industry, 2020-2035
  • Figure 106: Europe Market Value Share (%) and BPS Analysis by Industry, 2025-2035
  • Figure 107: Europe Market Y-o-Y Growth (%) Projections by Industry, 2025-2035
  • Figure 108: Europe Market Value (USD Million) Analysis by Client Size, 2020-2035
  • Figure 109: Europe Market Volume (Units) Analysis by Client Size, 2020-2035
  • Figure 110: Europe Market Value Share (%) and BPS Analysis by Client Size, 2025-2035
  • Figure 111: Europe Market Y-o-Y Growth (%) Projections by Client Size, 2025-2035
  • Figure 112: Europe Market Value (USD Million) Analysis by Contract, 2020-2035
  • Figure 113: Europe Market Volume (Units) Analysis by Contract, 2020-2035
  • Figure 114: Europe Market Value Share (%) and BPS Analysis by Contract, 2025-2035
  • Figure 115: Europe Market Y-o-Y Growth (%) Projections by Contract, 2025-2035
  • Figure 116: Europe Market Attractiveness by Service Type, 2025-2035
  • Figure 117: Europe Market Attractiveness by Industry, 2025-2035
  • Figure 118: Europe Market Attractiveness by Client Size, 2025-2035
  • Figure 119: Europe Market Attractiveness by Contract, 2025-2035
  • Figure 120: Europe Market Attractiveness by Country, 2025-2035
  • Figure 121: East Asia Market Value (USD Million) by Service Type, 2025-2035
  • Figure 122: East Asia Market Value (USD Million) by Industry, 2025-2035
  • Figure 123: East Asia Market Value (USD Million) by Client Size, 2025-2035
  • Figure 124: East Asia Market Value (USD Million) by Contract, 2025-2035
  • Figure 125: East Asia Market Value (USD Million) by Country, 2025-2035
  • Figure 126: East Asia Market Value (USD Million) Analysis by Country, 2020-2035
  • Figure 127: East Asia Market Volume (Units) Analysis by Country, 2020-2035
  • Figure 128: East Asia Market Value Share (%) and BPS Analysis by Country, 2025-2035
  • Figure 129: East Asia Market Y-o-Y Growth (%) Projections by Country, 2025-2035
  • Figure 130: East Asia Market Value (USD Million) Analysis by Service Type, 2020-2035
  • Figure 131: East Asia Market Volume (Units) Analysis by Service Type, 2020-2035
  • Figure 132: East Asia Market Value Share (%) and BPS Analysis by Service Type, 2025-2035
  • Figure 133: East Asia Market Y-o-Y Growth (%) Projections by Service Type, 2025-2035
  • Figure 134: East Asia Market Value (USD Million) Analysis by Industry, 2020-2035
  • Figure 135: East Asia Market Volume (Units) Analysis by Industry, 2020-2035
  • Figure 136: East Asia Market Value Share (%) and BPS Analysis by Industry, 2025-2035
  • Figure 137: East Asia Market Y-o-Y Growth (%) Projections by Industry, 2025-2035
  • Figure 138: East Asia Market Value (USD Million) Analysis by Client Size, 2020-2035
  • Figure 139: East Asia Market Volume (Units) Analysis by Client Size, 2020-2035
  • Figure 140: East Asia Market Value Share (%) and BPS Analysis by Client Size, 2025-2035
  • Figure 141: East Asia Market Y-o-Y Growth (%) Projections by Client Size, 2025-2035
  • Figure 142: East Asia Market Value (USD Million) Analysis by Contract, 2020-2035
  • Figure 143: East Asia Market Volume (Units) Analysis by Contract, 2020-2035
  • Figure 144: East Asia Market Value Share (%) and BPS Analysis by Contract, 2025-2035
  • Figure 145: East Asia Market Y-o-Y Growth (%) Projections by Contract, 2025-2035
  • Figure 146: East Asia Market Attractiveness by Service Type, 2025-2035
  • Figure 147: East Asia Market Attractiveness by Industry, 2025-2035
  • Figure 148: East Asia Market Attractiveness by Client Size, 2025-2035
  • Figure 149: East Asia Market Attractiveness by Contract, 2025-2035
  • Figure 150: East Asia Market Attractiveness by Country, 2025-2035
  • Figure 151: South Asia & Pacific Market Value (USD Million) by Service Type, 2025-2035
  • Figure 152: South Asia & Pacific Market Value (USD Million) by Industry, 2025-2035
  • Figure 153: South Asia & Pacific Market Value (USD Million) by Client Size, 2025-2035
  • Figure 154: South Asia & Pacific Market Value (USD Million) by Contract, 2025-2035
  • Figure 155: South Asia & Pacific Market Value (USD Million) by Country, 2025-2035
  • Figure 156: South Asia & Pacific Market Value (USD Million) Analysis by Country, 2020-2035
  • Figure 157: South Asia & Pacific Market Volume (Units) Analysis by Country, 2020-2035
  • Figure 158: South Asia & Pacific Market Value Share (%) and BPS Analysis by Country, 2025-2035
  • Figure 159: South Asia & Pacific Market Y-o-Y Growth (%) Projections by Country, 2025-2035
  • Figure 160: South Asia & Pacific Market Value (USD Million) Analysis by Service Type, 2020-2035
  • Figure 161: South Asia & Pacific Market Volume (Units) Analysis by Service Type, 2020-2035
  • Figure 162: South Asia & Pacific Market Value Share (%) and BPS Analysis by Service Type, 2025-2035
  • Figure 163: South Asia & Pacific Market Y-o-Y Growth (%) Projections by Service Type, 2025-2035
  • Figure 164: South Asia & Pacific Market Value (USD Million) Analysis by Industry, 2020-2035
  • Figure 165: South Asia & Pacific Market Volume (Units) Analysis by Industry, 2020-2035
  • Figure 166: South Asia & Pacific Market Value Share (%) and BPS Analysis by Industry, 2025-2035
  • Figure 167: South Asia & Pacific Market Y-o-Y Growth (%) Projections by Industry, 2025-2035
  • Figure 168: South Asia & Pacific Market Value (USD Million) Analysis by Client Size, 2020-2035
  • Figure 169: South Asia & Pacific Market Volume (Units) Analysis by Client Size, 2020-2035
  • Figure 170: South Asia & Pacific Market Value Share (%) and BPS Analysis by Client Size, 2025-2035
  • Figure 171: South Asia & Pacific Market Y-o-Y Growth (%) Projections by Client Size, 2025-2035
  • Figure 172: South Asia & Pacific Market Value (USD Million) Analysis by Contract, 2020-2035
  • Figure 173: South Asia & Pacific Market Volume (Units) Analysis by Contract, 2020-2035
  • Figure 174: South Asia & Pacific Market Value Share (%) and BPS Analysis by Contract, 2025-2035
  • Figure 175: South Asia & Pacific Market Y-o-Y Growth (%) Projections by Contract, 2025-2035
  • Figure 176: South Asia & Pacific Market Attractiveness by Service Type, 2025-2035
  • Figure 177: South Asia & Pacific Market Attractiveness by Industry, 2025-2035
  • Figure 178: South Asia & Pacific Market Attractiveness by Client Size, 2025-2035
  • Figure 179: South Asia & Pacific Market Attractiveness by Contract, 2025-2035
  • Figure 180: South Asia & Pacific Market Attractiveness by Country, 2025-2035
  • Figure 181: Middle East and Africa Market Value (USD Million) by Service Type, 2025-2035
  • Figure 182: Middle East and Africa Market Value (USD Million) by Industry, 2025-2035
  • Figure 183: Middle East and Africa Market Value (USD Million) by Client Size, 2025-2035
  • Figure 184: Middle East and Africa Market Value (USD Million) by Contract, 2025-2035
  • Figure 185: Middle East and Africa Market Value (USD Million) by Country, 2025-2035
  • Figure 186: Middle East and Africa Market Value (USD Million) Analysis by Country, 2020-2035
  • Figure 187: Middle East and Africa Market Volume (Units) Analysis by Country, 2020-2035
  • Figure 188: Middle East and Africa Market Value Share (%) and BPS Analysis by Country, 2025-2035
  • Figure 189: Middle East and Africa Market Y-o-Y Growth (%) Projections by Country, 2025-2035
  • Figure 190: Middle East and Africa Market Value (USD Million) Analysis by Service Type, 2020-2035
  • Figure 191: Middle East and Africa Market Volume (Units) Analysis by Service Type, 2020-2035
  • Figure 192: Middle East and Africa Market Value Share (%) and BPS Analysis by Service Type, 2025-2035
  • Figure 193: Middle East and Africa Market Y-o-Y Growth (%) Projections by Service Type, 2025-2035
  • Figure 194: Middle East and Africa Market Value (USD Million) Analysis by Industry, 2020-2035
  • Figure 195: Middle East and Africa Market Volume (Units) Analysis by Industry, 2020-2035
  • Figure 196: Middle East and Africa Market Value Share (%) and BPS Analysis by Industry, 2025-2035
  • Figure 197: Middle East and Africa Market Y-o-Y Growth (%) Projections by Industry, 2025-2035
  • Figure 198: Middle East and Africa Market Value (USD Million) Analysis by Client Size, 2020-2035
  • Figure 199: Middle East and Africa Market Volume (Units) Analysis by Client Size, 2020-2035
  • Figure 200: Middle East and Africa Market Value Share (%) and BPS Analysis by Client Size, 2025-2035
  • Figure 201: Middle East and Africa Market Y-o-Y Growth (%) Projections by Client Size, 2025-2035
  • Figure 202: Middle East and Africa Market Value (USD Million) Analysis by Contract, 2020-2035
  • Figure 203: Middle East and Africa Market Volume (Units) Analysis by Contract, 2020-2035
  • Figure 204: Middle East and Africa Market Value Share (%) and BPS Analysis by Contract, 2025-2035
  • Figure 205: Middle East and Africa Market Y-o-Y Growth (%) Projections by Contract, 2025-2035
  • Figure 206: Middle East and Africa Market Attractiveness by Service Type, 2025-2035
  • Figure 207: Middle East and Africa Market Attractiveness by Industry, 2025-2035
  • Figure 208: Middle East and Africa Market Attractiveness by Client Size, 2025-2035
  • Figure 209: Middle East and Africa Market Attractiveness by Contract, 2025-2035
  • Figure 210: Middle East and Africa Market Attractiveness by Country, 2025-2035

Frequently Asked Questions

How big is the Overflow Staffing Services Market in 2025?

The global Overflow Staffing Services Market is estimated to be valued at USD 2,295.11 million in 2025.

What will be the size of Overflow Staffing Services Market in 2035?

The market size for the Overflow Staffing Services Market is projected to reach USD 4,580.46 million by 2035.

How much will be the Overflow Staffing Services Market growth between 2025 and 2035?

The Overflow Staffing Services Market is expected to grow at a 8.4% CAGR between 2025 and 2035.

What are the key service types in the Overflow Staffing Services Market?

The key product types in Overflow Staffing Services Market are Temporary staffing, Seasonal surge support, Remote staffing pools.

Which client size segment will contribute significant share in the Overflow Staffing Services Market in 2025?

In terms of client size, Large enterprises will command 59.2% share in the Overflow Staffing Services Market in 2025.

Explore Similar Insights

Future Market Insights

Overflow Staffing Services Market

Chat With MaRIA

Chat With

MaRIA

Hi There, I am MaRIA, Your Market Research Intelligence Assistant. How may I help you?