The plug-in aluminum electrolytic capacitor market is set to expand from USD 417.2 million in 2025 to USD 747.2 million by 2035, reflecting a CAGR of 6.0%. The rolling CAGR analysis highlights steady growth driven by the increasing demand for reliable energy storage and filtering components in consumer electronics, automotive electronics, industrial machinery, and power supply systems. In the initial phase, 2025 to 2028, demand rises moderately as manufacturers upgrade devices and equipment with higher-performance capacitors, prioritizing durability, thermal stability, and extended life cycles. Growth in emerging economies also supports this early expansion, driven by industrial automation and rising electronic product consumption.
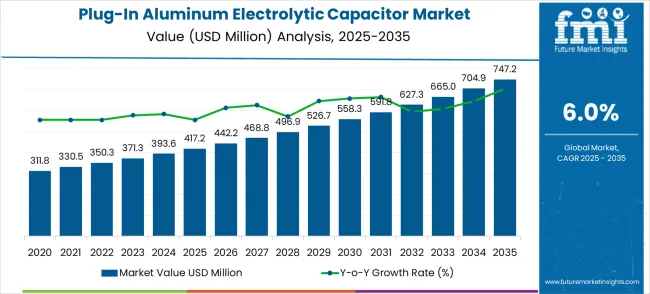
From 2028 to 2032, the market maintains a similar growth rate as adoption broadens across diverse applications. Improvements in capacitor materials, including high-capacitance, low-ESR designs, and compact footprints, drive steady uptake, supporting incremental revenue generation. In the final phase, 2032 to 2035, adoption continues across automotive, renewable energy, and industrial sectors, reflecting sustained demand for energy-efficient solutions and compact electronic components. The rolling CAGR demonstrates a consistent upward trajectory with minimal fluctuations, indicating a stable and predictable market environment. Manufacturers can leverage this insight to plan production, optimize supply chains, and target regions with high adoption potential, ensuring sustained market growth and competitive advantage over the decade.
The plug-in aluminum electrolytic capacitor market is segmented into power supply units (36%), industrial electronics (28%), automotive electronics (18%), renewable energy systems (10%), and specialty electronic devices (8%). Power supply units lead adoption due to high demand for energy storage, voltage smoothing, and long operational life. Industrial electronics utilize these capacitors for motors, inverters, and control circuits, while automotive electronics rely on them for stability in power management systems. Renewable energy systems deploy plug-in aluminum electrolytic capacitors in solar inverters, wind turbines, and energy storage solutions. Specialty electronic devices include audio equipment, instrumentation, and precision electronic modules requiring stable capacitance and reliability under varying conditions.
Recent trends include enhanced ripple current handling, low equivalent series resistance (ESR), and high-temperature performance to extend capacitor lifespan. Manufacturers are innovating with compact, high-capacitance designs and improved mounting techniques for ease of assembly. Expansion into electric vehicles, industrial automation, and renewable energy applications is accelerating market growth. Collaborations between capacitor producers and electronics OEMs enable tailored solutions for performance-critical applications. Focus on operational reliability, energy efficiency, and compliance with international electronics standards continues to drive global adoption.
| Metric | Value |
|---|---|
| Market Value (2025) | USD 417.2 million |
| Market Forecast Value (2035) | USD 747.2 million |
| Market Forecast CAGR | 6.0% |
Market expansion is being supported by the rapid increase in electronic device manufacturing worldwide and the corresponding need for reliable capacitor solutions that provide superior energy storage and power filtering capabilities. Modern electronic systems rely on consistent power management and stable electrical performance to ensure optimal device operation including smartphones, telecommunications equipment, and computing systems. Even minor capacitor performance issues can require comprehensive circuit design adjustments to maintain optimal system reliability and operational performance.
The growing complexity of electronic circuits and increasing demand for high-performance power management solutions are driving demand for advanced aluminum electrolytic capacitors from certified manufacturers with appropriate electrical characteristics and quality standards. Electronics companies are increasingly requiring documented component reliability and electrical performance to maintain product quality and regulatory compliance. Industry specifications and safety standards are establishing standardized capacitor performance criteria that require specialized manufacturing technologies and quality control processes.
The shift toward energy-efficient electronics and sustainable manufacturing practices is further accelerating adoption of high-performance capacitors that minimize power losses while optimizing system efficiency. Growing demand for miniaturization in consumer electronics is creating need for compact capacitors that can deliver high capacitance in smaller form factors. Additionally, increasing focus on 5G infrastructure development and IoT device proliferation is driving investments in capacitor solutions that can support high-frequency applications and demanding environmental conditions.
The market is segmented by capacitor type, application, and region. By capacitor type, the market is divided into polyester capacitors, polypropylene capacitors, polystyrene capacitors, and polycarbonate capacitors. Based on application, the market is categorized into communication equipment, computer, and others. Regionally, the market is divided into North America, Europe, East Asia, South Asia & Pacific, Latin America, and Middle East & Africa.
In 2025, the polyester capacitor segment is projected to capture around 46% of the total market share, making it the leading capacitor technology category. This dominance is largely driven by the widespread adoption of polyester film technology that provides excellent electrical properties, temperature stability, and cost-effectiveness across diverse electronic applications. The polyester capacitor is particularly favored for its ability to deliver reliable performance with good dielectric properties while maintaining affordability and manufacturing scalability. Communication equipment manufacturers, computer system designers, consumer electronics producers, and industrial control system developers increasingly prefer this capacitor type, as it meets diverse electrical requirements without imposing excessive cost burdens or performance limitations.
The availability of well-established manufacturing processes, along with comprehensive quality standards and technical support from leading suppliers, further reinforces the segment's market position. The capacitor type benefits from consistent demand across regions, as it is considered a versatile solution for applications requiring balanced performance and cost considerations. The combination of electrical performance, reliability, and economic advantages makes polyester capacitors a preferred choice, ensuring their continued dominance in the aluminum electrolytic capacitor market.
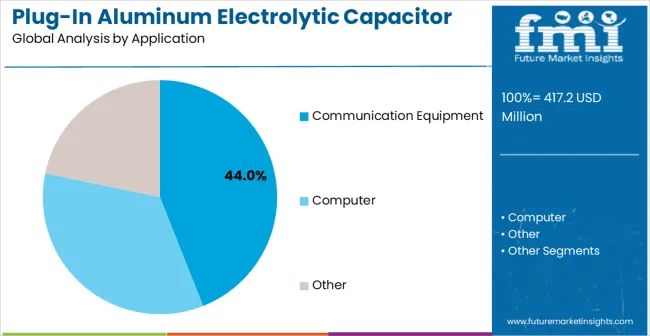
The communication equipment segment is expected to represent 44% of plug-in aluminum electrolytic capacitor demand in 2025, highlighting its position as the most significant application sector. This dominance stems from the unique operational needs of telecommunications systems, where reliable power filtering and energy storage are critical to signal quality and system stability. Communication equipment often features high-frequency operation and demanding power management requirements that necessitate specialized capacitor solutions. Aluminum electrolytic capacitors are particularly well-suited to these applications due to their ability to provide high capacitance values while maintaining stable electrical characteristics across varying operating conditions.
As communication infrastructure expands globally and emphasizes improved network performance, the demand for sophisticated capacitor solutions continues to rise. The segment also benefits from rapid 5G network deployment and telecommunications infrastructure modernization, where equipment manufacturers are increasingly prioritizing high-performance components as essential for network reliability and data transmission quality. With communication companies investing in network efficiency and service quality enhancement, aluminum electrolytic capacitors provide an essential solution to maintain high-performance communication capabilities. The growth of fiber optic networks, coupled with increased focus on wireless communication advancement, ensures that communication equipment will remain the largest and most stable demand driver for plug-in aluminum electrolytic capacitors in the forecast period.
The Plug-In Aluminum Electrolytic Capacitor market is advancing steadily due to increasing electronic device proliferation and growing recognition of aluminum capacitor advantages in power management and energy storage applications. The market faces challenges including competition from alternative capacitor technologies, environmental concerns regarding electrolyte materials, and varying electrical specifications across different application requirements. Technology advancement efforts and sustainability programs continue to influence capacitor design and market adoption patterns.
The growing development of advanced electrolyte formulations and enhanced construction techniques is enabling higher operating temperatures with improved service life and reliability characteristics. Enhanced material technologies and optimized manufacturing processes provide superior electrical performance while maintaining long-term stability requirements. These technologies are particularly valuable for automotive and industrial applications that require reliable capacitor performance supporting extensive operational cycles with minimal degradation and consistent electrical characteristics.
Modern aluminum electrolytic capacitor manufacturers are incorporating advanced design techniques and material innovations that enable higher capacitance density while reducing physical size and weight. Integration of optimized electrode structures and improved electrolyte systems enables superior electrical performance in compact form factors. Advanced miniaturization features support applications across diverse electronic environments while meeting various space constraints and performance specifications, enabling seamless integration with modern circuit board designs and portable device requirements.
The Plug-In Aluminum Electrolytic Capacitor market is entering a new phase of growth, driven by demand for electronic device advancement, 5G infrastructure development, and evolving performance and sustainability standards. By 2035, these pathways together can unlock USD 150-180 million in incremental revenue opportunities beyond baseline growth.
Pathway A -- Polyester Capacitor Leadership (Proven Performance) The polyester capacitor segment already holds the largest share due to its balanced performance and cost-effectiveness. Expanding temperature capabilities, enhanced reliability features, and improved miniaturization can consolidate leadership. Opportunity pool: USD 40-50 million.
Pathway B -- Communication Equipment Expansion (5G Infrastructure) Communication equipment applications account for the majority of demand. Growing 5G network deployment and telecommunications infrastructure modernization will drive higher adoption of high-performance capacitor systems. Opportunity pool: USD 35-45 million.
Pathway C -- Automotive Electronics & Electric Vehicles Automotive electrification and advanced driver assistance systems are expanding rapidly, creating demand for high-temperature, high-reliability capacitors for power management applications. Opportunity pool: USD 25-35 million.
Pathway D -- Emerging Market Expansion Asia-Pacific, Latin America, and developing economies present growing demand due to electronic manufacturing growth and infrastructure development. Targeting cost-effective solutions will accelerate adoption. Opportunity pool: USD 20-30 million.
Pathway E -- Industrial Automation & IoT Devices Growing industrial digitalization and Internet of Things applications require reliable capacitors for sensor systems, control equipment, and communication modules. Opportunity pool: USD 15-25 million.
Pathway F -- Renewable Energy & Power Systems Solar inverters, wind power systems, and energy storage applications offer growth opportunities for specialized high-voltage, high-ripple current capacitors. Opportunity pool: USD 12-18 million.
Pathway G -- Consumer Electronics Miniaturization Smartphone, tablet, and wearable device trends toward smaller, more powerful electronics create demand for compact, high-performance capacitors. Opportunity pool: USD 8-15 million.
Pathway H -- Sustainable & Eco-Friendly Technologies Environmental regulations and sustainability initiatives drive opportunities for capacitors with reduced environmental impact and improved recyclability. Opportunity pool: USD 6-12 million.
| Country | CAGR (2025-2035) |
|---|---|
| China | 8.1% |
| India | 7.5% |
| Germany | 6.9% |
| Brazil | 6.3% |
| United States | 5.7% |
| United Kingdom | 5.1% |
| Japan | 4.5% |
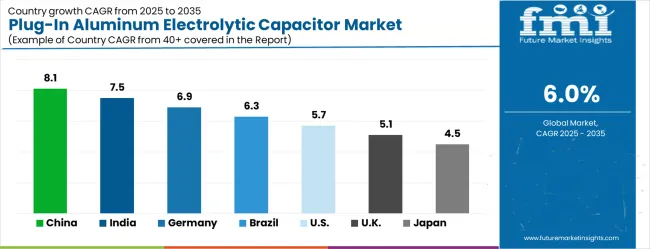
The plug-in aluminum electrolytic capacitor market is growing robustly, with China leading at an 8.1% CAGR through 2035, driven by massive electronics manufacturing expansion and increasing adoption of advanced capacitor technologies in communication and consumer electronics. India follows at 7.5%, supported by rising electronics manufacturing development and growing investment in telecommunications infrastructure. Germany grows steadily at 6.9%, integrating advanced capacitor technology into its established automotive electronics and industrial automation sectors. Brazil records 6.3%, emphasizing electronics manufacturing growth and communication infrastructure development initiatives. The United States shows solid growth at 5.7%, focusing on 5G infrastructure deployment and advanced computing applications. The United Kingdom demonstrates steady progress at 5.1%, maintaining established electronics manufacturing and telecommunications applications. Japan records 4.5% growth, concentrating on precision capacitor technology development and automotive electronics innovation.
The report covers an in-depth analysis of 40+ countries, Top-performing countries are highlighted below.
China is expected to expand at a CAGR of 8.1% from 2025 to 2035, above the global average, driven by robust electronics manufacturing and growing demand for high-performance electrical components. Plug-in aluminum electrolytic capacitors are increasingly adopted in power supplies, industrial equipment, and consumer electronics due to their high capacitance and reliability. Domestic manufacturers are focusing on miniaturization, improved temperature tolerance, and higher voltage ratings to meet industrial and automotive requirements. Companies such as Nichicon China and Rubycon are enhancing production capacity and automation capabilities. Rising adoption in electric vehicles, renewable energy systems, and consumer electronics is supporting market growth, while regulatory requirements for safety and performance are encouraging advanced product designs.
India is expected to grow at a CAGR of 7.5% from 2025 to 2035, driven by expanding electronics manufacturing, renewable energy systems, and automotive sectors. Plug-in aluminum electrolytic capacitors are widely used in inverters, industrial drives, and consumer electronics. Manufacturers focus on improving voltage tolerance, capacitance stability, and thermal reliability to meet diverse application needs. Companies such as Vishay India and KEMET India are increasing production capacity and technology adoption to meet domestic and export demand. The rise in electric vehicles and industrial automation projects is further boosting market adoption, alongside initiatives for Make in India and local electronics component production.
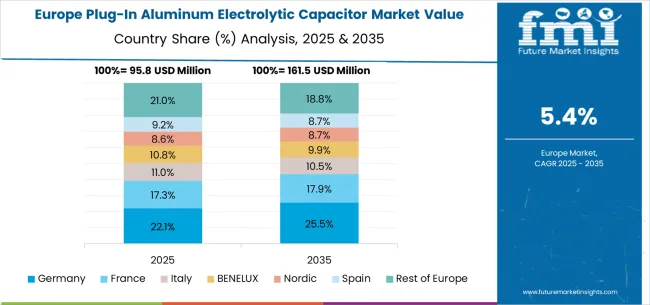
Germany is expected to grow at a CAGR of 6.9% from 2025 to 2035, supported by automotive, industrial automation, and renewable energy sectors. Plug-in aluminum electrolytic capacitors are used in power supplies, industrial drives, and energy storage applications. German manufacturers focus on long-life capacitors with low equivalent series resistance (ESR), high capacitance, and thermal stability. Companies such as EPCOS (TDK Group) and Vishay Intertechnology are introducing modular capacitor solutions for automotive and industrial electronics. Market demand is also driven by the need for energy-efficient systems, compliance with strict European standards, and adoption of electric and hybrid vehicles that require high-performance capacitors.
Brazil is expected to grow at a CAGR of 6.3% from 2025 to 2035, supported by industrial automation, renewable energy projects, and consumer electronics expansion. Plug-in aluminum electrolytic capacitors are increasingly applied in power supplies, inverters, and industrial drives. Manufacturers focus on high-temperature tolerance, voltage stability, and corrosion-resistant materials for tropical operating environments. Companies such as Vishay Brazil and Panasonic Industrial Devices are enhancing local production and technical support capabilities. Market adoption is further driven by government initiatives to modernize energy infrastructure, promote renewable energy, and increase industrial productivity.
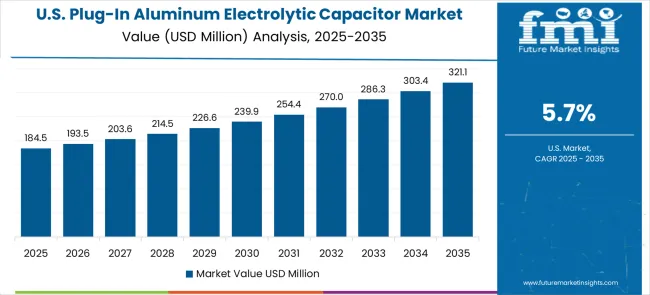
The United States is expected to grow at a CAGR of 5.7% from 2025 to 2035, fueled by electronics manufacturing, renewable energy projects, and industrial automation. Plug-in aluminum electrolytic capacitors are used in inverters, power supplies, industrial drives, and automotive electronics. USA manufacturers focus on high capacitance, long operational life, and low ESR to meet demanding applications. Companies such as KEMET Corporation and Vishay Intertechnology provide modular and high-performance solutions. Growth is supported by electric vehicle adoption, increased renewable energy deployment, and demand for industrial automation solutions that require reliable and high-quality capacitors.
The United Kingdom is expected to grow at a CAGR of 5.1% from 2025 to 2035, influenced by industrial automation, renewable energy, and electronics manufacturing. Plug-in aluminum electrolytic capacitors are used in power supplies, motor drives, and electronic devices requiring high capacitance and thermal stability. Manufacturers are focusing on low ESR, long-life capacitors suitable for automotive and renewable energy applications. Companies such as Panasonic and EPCOS (TDK Group) are providing high-performance, modular capacitor solutions. Market growth is supported by government incentives for renewable energy deployment, industrial modernization, and demand for compact, reliable components in automotive and industrial electronics.
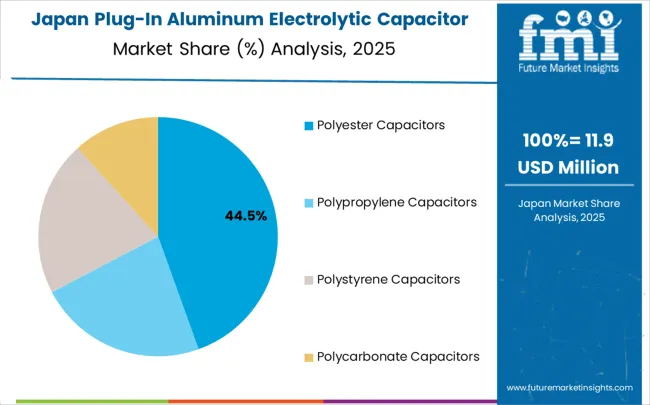
Japan is expected to grow at a CAGR of 4.5% from 2025 to 2035, reflecting moderate adoption in electronics manufacturing, automotive, and industrial applications. Plug-in aluminum electrolytic capacitors are widely used in inverters, power supplies, and automotive electronics requiring high capacitance and long operational life. Japanese manufacturers focus on high-temperature tolerance, low ESR, and compact designs to meet industrial and consumer requirements. Companies such as Rubycon and Nichicon are developing advanced, modular solutions suitable for automotive electronics, renewable energy systems, and industrial drives. Market growth is driven by technological advancement, stringent quality standards, and demand for high-reliability capacitors in electric vehicles and industrial automation systems.
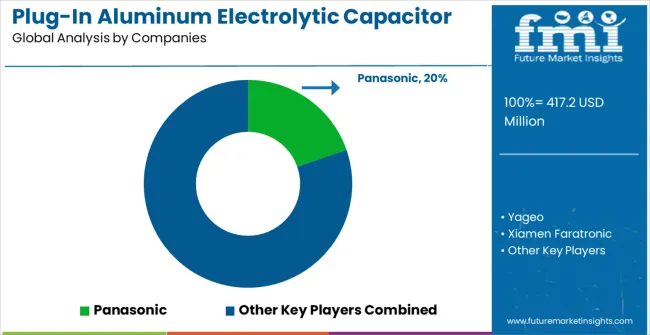
The Plug-In aluminum electrolytic capacitor market is defined by competition among specialized electronic component manufacturers, passive component companies, and integrated electronic solution providers. Companies are investing in advanced electrolyte development, miniaturization technology improvements, reliability enhancement programs, and comprehensive service capabilities to deliver reliable, efficient, and high-performance capacitor solutions. Strategic partnerships, technological innovation, and market expansion are central to strengthening product portfolios and market presence.
Panasonic offers comprehensive aluminum electrolytic capacitor solutions with established manufacturing expertise and market-leading electronic component capabilities. Yageo provides advanced passive component systems with focus on miniaturization and performance optimization. Xiamen Faratronic delivers specialized capacitor technology with emphasis on quality and operational reliability. Nichicon specializes in high-performance electrolytic capacitors with advanced electrolyte formulations.
TDK offers professional-grade electronic components with comprehensive technical support capabilities. Anhui Tongfeng Electronic delivers cost-effective capacitor solutions with focus on manufacturing efficiency. Vishay provides global electronic component solutions with emphasis on reliability and performance. KYOCERA AVX, EKG Shengye Electric, Nantong Jianghai Capacitor, LELON, Guangdong Fengming Electronic Technology, JMX, Guilin Power Capacitor, KNSCHA, and Eagtop offer specialized capacitor solutions with focus on regional markets and application-specific requirements across global and regional market segments.
| Item | Value |
|---|---|
| Quantitative Units | USD 417.2 million |
| Capacitor Type | Polyester Capacitors, Polypropylene Capacitors, Polystyrene Capacitors, Polycarbonate Capacitors |
| Application | Communication Equipment, Computer, Others |
| Regions Covered | North America, Europe, East Asia, South Asia & Pacific, Latin America, Middle East & Africa |
| Country Covered | China, India, Germany, Brazil, United States, United Kingdom, Japan, and 40+ countries |
| Key Companies Profiled | Panasonic, Yageo, Xiamen Faratronic, Nichicon, TDK, Anhui Tongfeng Electronic, Vishay, KYOCERA AVX, EKG Shengye Electric, Nantong Jianghai Capacitor, LELON, Guangdong Fengming Electronic Technology, JMX, Guilin Power Capacitor, KNSCHA, Eagtop |
| Additional Attributes | Dollar sales by capacitor type and application segment, regional demand trends across major markets, competitive landscape with established capacitor manufacturers and emerging technology providers, customer preferences for different capacitor specifications and performance characteristics, integration with electronic systems and power management protocols, innovations in electrolyte technology and miniaturization capabilities, and adoption of high-temperature and long-life features with enhanced reliability workflows for improved electronic system performance and operational efficiency. |
The global plug-in aluminum electrolytic capacitor market is estimated to be valued at USD 417.2 million in 2025.
The market size for the plug-in aluminum electrolytic capacitor market is projected to reach USD 747.2 million by 2035.
The plug-in aluminum electrolytic capacitor market is expected to grow at a 6.0% CAGR between 2025 and 2035.
The key product types in plug-in aluminum electrolytic capacitor market are polyester capacitors, polypropylene capacitors, polystyrene capacitors and polycarbonate capacitors.
In terms of application, communication equipment segment to command 44.0% share in the plug-in aluminum electrolytic capacitor market in 2025.


Our Research Products

The "Full Research Suite" delivers actionable market intel, deep dives on markets or technologies, so clients act faster, cut risk, and unlock growth.

The Leaderboard benchmarks and ranks top vendors, classifying them as Established Leaders, Leading Challengers, or Disruptors & Challengers.

Locates where complements amplify value and substitutes erode it, forecasting net impact by horizon

We deliver granular, decision-grade intel: market sizing, 5-year forecasts, pricing, adoption, usage, revenue, and operational KPIs—plus competitor tracking, regulation, and value chains—across 60 countries broadly.

Spot the shifts before they hit your P&L. We track inflection points, adoption curves, pricing moves, and ecosystem plays to show where demand is heading, why it is changing, and what to do next across high-growth markets and disruptive tech

Real-time reads of user behavior. We track shifting priorities, perceptions of today’s and next-gen services, and provider experience, then pace how fast tech moves from trial to adoption, blending buyer, consumer, and channel inputs with social signals (#WhySwitch, #UX).

Partner with our analyst team to build a custom report designed around your business priorities. From analysing market trends to assessing competitors or crafting bespoke datasets, we tailor insights to your needs.
Supplier Intelligence
Discovery & Profiling
Capacity & Footprint
Performance & Risk
Compliance & Governance
Commercial Readiness
Who Supplies Whom
Scorecards & Shortlists
Playbooks & Docs
Category Intelligence
Definition & Scope
Demand & Use Cases
Cost Drivers
Market Structure
Supply Chain Map
Trade & Policy
Operating Norms
Deliverables
Buyer Intelligence
Account Basics
Spend & Scope
Procurement Model
Vendor Requirements
Terms & Policies
Entry Strategy
Pain Points & Triggers
Outputs
Pricing Analysis
Benchmarks
Trends
Should-Cost
Indexation
Landed Cost
Commercial Terms
Deliverables
Brand Analysis
Positioning & Value Prop
Share & Presence
Customer Evidence
Go-to-Market
Digital & Reputation
Compliance & Trust
KPIs & Gaps
Outputs
Full Research Suite comprises of:
Market outlook & trends analysis
Interviews & case studies
Strategic recommendations
Vendor profiles & capabilities analysis
5-year forecasts
8 regions and 60+ country-level data splits
Market segment data splits
12 months of continuous data updates
DELIVERED AS:
PDF EXCEL ONLINE
Aluminum Alloy Sacrificial Anode Market Size and Share Forecast Outlook 2025 to 2035
Aluminum Foam Market Size and Share Forecast Outlook 2025 to 2035
Aluminum Cap & Closure Market Forecast and Outlook 2025 to 2035
Aluminum Casing of the Blade Battery Market Size and Share Forecast Outlook 2025 to 2035
Aluminum ROPP Closure Market Size and Share Forecast Outlook 2025 to 2035
Aluminum Cans Market Size and Share Forecast Outlook 2025 to 2035
Aluminum Foil Packaging Market Size and Share Forecast Outlook 2025 to 2035
Aluminum Pouches Market Size and Share Forecast Outlook 2025 to 2035
Aluminum Foil Peel-Off Ends Maker Market Size and Share Forecast Outlook 2025 to 2035
Aluminum Foil Tape Market Size and Share Forecast Outlook 2025 to 2035
Aluminum-Free Food Pouch Market Size and Share Forecast Outlook 2025 to 2035
Aluminum-Nickel Catalyst Market Size and Share Forecast Outlook 2025 to 2035
Aluminum Frame Monitors Market Size and Share Forecast Outlook 2025 to 2035
Aluminum Composite Materials Market Size and Share Forecast Outlook 2025 to 2035
Aluminum Coated Thermal Protective Clothing Market Size and Share Forecast Outlook 2025 to 2035
Aluminum Flat Products Market Size and Share Forecast Outlook 2025 to 2035
Aluminum Alloys Market Size and Share Forecast Outlook 2025 to 2035
Aluminum Sheets and Coils Market Size and Share Forecast Outlook 2025 to 2035
Aluminum Foil Containers Market Size and Share Forecast Outlook 2025 to 2035
Aluminum Aerosol Cans Market Size and Share Forecast Outlook 2025 to 2035

Thank you!
You will receive an email from our Business Development Manager. Please be sure to check your SPAM/JUNK folder too.
Chat With
MaRIA