

- Market Size (2026)
- USD 180.7 Mn
- Forecast (2036)
- USD 592.1 Mn
- CAGR (2026 to 2036)
- 12.6%
How big is Potassium Release Biologics Market in 2026?
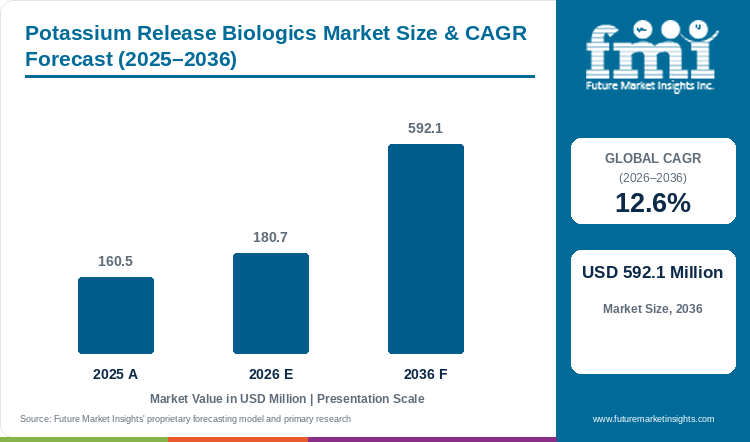
Registering a value of USD 160.5 million in 2025, the global potassium release biologics market expanded to USD 180.7 million in 2026 and is anticipated to achieve USD 592.1 million by 2036, driven by a 12.6% CAGR.
Grower efforts to mobilize mineral-bound soil potassium and improve return on chemical potash budgets are driving global potassium release biologics industry valuation from a 2025 total of USD 160.5 million to a 2026 total of USD 180.7 million and USD 592.1 million in 2036 at a 12.6% CAGR, generating USD 411.4 million in ten-year expansion. Even when farmers apply heavy rates of muriate of potash, clay fixation locks most potassium inside insoluble silicate lattices unless rhizosphere microbes secrete organic acids to weather those minerals. For instance, a November 2025 meta-analysis in Frontiers in Plant Science evaluated 102 independent studies on potassium-solubilizing microorganisms and confirmed that microbial organic-acid secretion significantly increases crop yield and potassium uptake across clay and loam soils [1]. Because agricultural regulators and distributors demand verifiable spore counts before approving these inoculants, the Single-Strain Products subsegment holds a projected 46.9% share of 2026 product type segment demand among farms integrating commercial agricultural microbials, although inconsistent colonization in dry open fields still restrains full potash replacement.
Key Market Trends & Insights
- By product type: Single-Strain Products hold a projected 46.9% share of 2026 product type segment demand, supported by straightforward strain-identity registration and viable spore-count quality control.
- By crop type: Cereals & Grains account for an estimated 44.1% share of 2026 crop type segment volume, driven by broad-acre corn and wheat fertilizer budget optimization.
- By application method: Soil Application captures an expected 40.1% share of 2026 application method segment usage, owing to placement of organic-acid-secreting bacteria against clay and mica surfaces.
- By farm type: Large Commercial Farms garner a forecast 46.8% share of 2026 farm type segment adoption, enabled by GPS strip-trial yield mapping and variable-rate planter attachments.
- By sales channel: Agri-Input Distributors record an anticipated 37.3% share of 2026 sales channel segment orders, attributable to certified crop-adviser consultations linked to soil-test potassium indices.
Regional Highlights
- European & East Asian regulatory momentum: Germany is projected to head evaluated country growth with a 13.4% rate until 2036 while South Korea records 12.9% under stricter nutrient-stewardship and rhizosphere-verification frameworks.
- Broad-acre and horticultural markets: The USA is expected to post a 12.5% CAGR over the UK (11.8%), while Japan is forecast to record an 11.1% annual growth rate.
Market Size & Forecast
Table 1: Market Size and Forecast for the Potassium Release Biologics Market (USD million and CAGR percentage), 2025 to 2036
| Metric | Value |
|---|---|
| 2025 Market Size | USD 160.5 million |
| Estimated Market Size in 2026 | USD 180.7 million |
| Projected Market Size by 2036 | USD 592.1 million |
| CAGR, 2026 to 2036 | 12.6% |
| Added Revenue, 2026 to 2036 | USD 411.4 million |
Commercial farm operators are moving potassium release biologics from small test plots into standard fertility programs because new bacterial isolates measurably increase ammonium-acetate-exchangeable soil potassium within a single growing season. Previously, agronomy retailers hesitated to recommend biological potash solubilizers when early strains failed to dissolve K-feldspar or muscovite fast enough during peak crop demand. However, June 2025 rhizosphere isolation research (PMC12128357) characterized potassium-solubilizing bacterial strains *Paenibacillus* SKL51 and *Klebsiella* SKT41 plus *Bacillus mucilaginosus*, showing that organic-acid secretion weathers K-feldspar and illite to lift exchangeable soil potassium to 194.3 milligrams per kilogram [2]. This verified jump in plant-available soil potassium gives growers confidence to co-apply potassium-mobilizing inoculants with microbial biofertilizer formulations across potassium-fixing clay soils.
Treated Cropland Area and Inoculant Dose Sizing
Table 2: Treated Cropland Area and Inoculant Dose Sizing for the Potassium Release Biologics Market (USD million and operational ranges), 2025 to 2036
| Metric | 2025 | 2026 | 2036 |
|---|---|---|---|
| Market size (USD million) | 160.5 | 180.7 | 592.1 |
| Cropland treated with K-mobilizing biologics (million hectares) | 11.2 to 12.6 | 12.5 to 14.1 | 38.0 to 43.5 |
| Formulated microbial inoculant volume (thousand metric tons) | 26.5 to 30.0 | 29.5 to 33.5 | 88.0 to 101.0 |
| Average grower treatment expenditure per hectare (USD) | 12.8 to 14.3 | 13.0 to 14.5 | 13.6 to 15.6 |
Operational note: Treated hectare and formulated tonnage ranges reconcile in-furrow liquid and wettable powder or granular bioinoculant dosing rates (0.25 to 2.5 kilograms per hectare at 10^8 to 10^9 CFU/g) across commercial crops.
Treated cropland area is projected to more than triple between 2026 and 2036 because a USD 13.0 to 14.5 per-hectare biological treatment costs only a fraction of a full broadcast potash application. When agronomy dealers bundle potassium-solubilizing bacteria with agricultural biostimulant programs in the same planter pass, farmers eliminate extra fuel and application labor costs. This single-pass tank-mix convenience lowers the breakeven yield response needed for a positive farm return and accelerates repeat seasonal ordering across row-crop regions.
Per Hectare & Commercial Farm Enterprise Sizing
Table 3: Per Hectare and Farm Enterprise Valuation Indicators for the Potassium Release Biologics Market (USD), 2025 to 2036
| Metric | 2025 | 2026 | 2036 |
|---|---|---|---|
| Global arable cropland base (billion hectares) | 1.4 | 1.4 | 1.4 |
| Market value per 1,000 hectares of arable land (USD) | 114.6 | 129.1 | 422.9 |
| Annual K-biologics valuation per commercial farm enterprise (USD) | 1,420 to 1,750 | 1,540 to 1,890 | 3,650 to 4,420 |
| Broad-acre row-crop treatment share (%) | 68.0% to 72.0% | 69.0% to 73.0% | 73.0% to 77.0% |
Table 4: Agronomic & Channel Valuation Indicators for the Potassium Release Biologics Market (USD and percentages), 2026
| Metric | Value | Institutional Reference Basis |
|---|---|---|
| Market size, 2026 | USD 180.7 million | 2026 global K-release biologics baseline |
| Single-strain inoculant allocation, 2026 | USD 84.7 million | 46.9% product type segment allocation |
| Cereals & grains crop allocation, 2026 | USD 79.7 million | 44.1% crop type segment allocation |
| Large commercial farm allocation, 2026 | USD 84.6 million | 46.8% farm type segment allocation |
Annual expenditure per commercial farm enterprise is rising as formulators replace perishable liquid jugs with heat-tolerant *Bacillus* endospore powders that survive warehouse storage and high-salt liquid starter tanks. This formulation stability allows large grain operations to co-apply potassium-mobilizing powders across their entire planted acreage via commercial seed health platforms rather than restricting trials to small nursery plots. Ambient warehouse and transport stability also expands distributor stocking margins and widens retail availability across interior grain corridors.
Analyst Perspective
"Commercial adoption of potassium release biologics depends on proving net increases in exchangeable soil potassium and harvested crop yield across replicated field strips rather than relying on laboratory agar halos. Suppliers that pair heat-tolerant endospore formulations with strain-level regulatory dossiers will secure cooperative distribution agreements."
- Nikhil Kaitwade, Principal Consultant, Future Market Insights.
How is the potassium release biologics market segmented?
The potassium release biologics market is segmented by product type, crop type, application method, farm type, sales channel, and region. In 2026, Single-Strain Products are projected at 46.9%, Cereals & Grains at 44.1%, Soil Application at 40.1%, Large Commercial Farms at 46.8%, and Agri-Input Distributors at 37.3%.
By product type: Single-Strain Products and Multi-Strain Consortia in addition to Microbe + Nutrient Combos and Others.
By crop type: Cereals & Grains and Fruits & Vegetables along with Oilseeds & Pulses, Turf & Ornamentals, and Others.
By application method: Soil Application and Seed Application plus Fertigation / Drip, Foliar Application, and Others.
By farm type: Large Commercial Farms and Mid-Size Farms plus Smallholders, Greenhouses & Nurseries, and Others.
By sales channel: Agri-Input Distributors and Cooperatives plus Agri-Retail Chains, Online / Direct-to-Farm, and Others.
Why do Single-Strain Products anchor the product type segment?
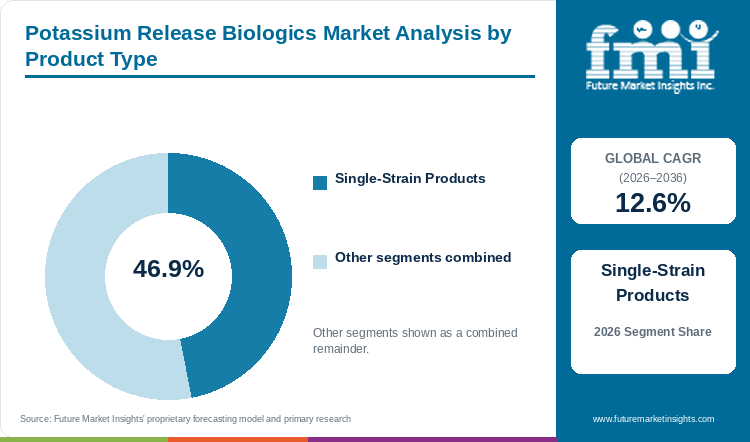
Single-Strain Products hold a projected 46.9% share of 2026 product type segment demand, supported by verifiable strain identity and spore stability.
Table 5: Product Type Share for the Potassium Release Biologics Market (percentage share), 2026
| Product Type | Share (2026) |
|---|---|
| Single-Strain Products | 46.9% |
| Other Segments Combined* | 53.1% |
| Total | 100.0% |
*Calculated as the balance remaining after deducting the leading segment's reported share from 100.0%.
Table 6: Product Type Leadership and Market Growth for the Potassium Release Biologics Market (segment and CAGR percentage), 2026 to 2036
| Metric | Value |
|---|---|
| Global CAGR (2026 to 2036) | 12.6% |
| Leading Segment | Single-Strain Products |
National fertilizer regulators and cooperative quality-assurance labs require exact colony-forming-unit counts and genomic strain identification before clearing a biological product for commercial sale. Single-Strain Products containing a single defined isolate such as *Bacillus mucilaginosus*, *Bacillus subtilis*, or *Frateuria aurantia* pass these registration audits far faster than multi-species blends that suffer from inter-strain competition in the container. Although Multi-Strain Consortia and Microbe + Nutrient Combos are gaining interest among growers running integrated commercial fertilizer programs, lower fermentation batch costs and predictable 24-month spore shelf life keep single-strain products in the lead.
- The Single-Strain Products subsegment holds a projected 46.9% share of 2026 product type segment demand, driven by clear microbial strain traceability during regulatory and distributor audits.
- For instance, September 2025 paddy-soil field trials (PMC12479494) proved that single-strain *Bacillus subtilis* bio-organic inoculants dosed at 4.3 x 10^7 CFU/g raised available soil potassium from 41.67 to 58.67 mg/kg and boosted harvested rice yield by 591 kilograms per acre [3].
What supports Cereals & Grains in the crop type segment?
Cereals & Grains account for an estimated 44.1% share of 2026 crop type segment volume, driven by broad-acre corn and wheat nutrient budgets.
High-yielding corn and wheat plus paddy rice crops remove 150 to 250 kilograms of potassium oxide equivalent per hectare each season, which leaves broad-acre grain farmers highly exposed to potash price swings and mid-season stalk lodging. Because Cereals & Grains span hundreds of millions of commercial hectares globally, even partial mobilization of clay-fixed soil potassium across corn and wheat rotations generates massive inoculant order volumes. While Fruits & Vegetables and Oilseeds & Pulses producers also pair potassium solubilizers with certified organic fertilizer inputs, broad-acre cereal rotations account for the largest commercial revenue base.
- The Cereals & Grains subsegment comprises an estimated 44.1% share of 2026 crop type segment volume, owing to extensive planted acreage and high seasonal potassium uptake in corn and small grains.
- Demonstrating this commercial focus on broad-acre corn, in March 2025, Pivot Bio unveiled PROVEN G3 featuring enhanced root-zone nutrient uptake and nitrogen fixation modes of action targeted at grain producers [4].
Why is Soil Application the principal application method segment?
Soil Application captures an expected 40.1% share of 2026 application method segment usage, owing to direct rhizosphere mineral weathering.
Biological potassium release cannot occur on leaf surfaces because the insoluble feldspar and illite or biotite minerals that hold fixed potassium reside inside the soil clay matrix. Soil Application via in-furrow liquid injection or granular incorporation places high concentrations of organic-acid-secreting bacteria directly into the moist root zone where they dissolve silicate interlayers. Although Seed Application and Fertigation / Drip subsegments provide low-labor delivery paired with controlled and slow-release fertilizers, direct soil placement prevents seed-coat desiccation mortality and delivers the highest rhizosphere colonization.
- The Soil Application subsegment captures an expected 40.1% share of 2026 application method segment usage, linked to higher viable cell survival and immediate contact with clay mineral reserves.
- Confirming this root-zone mechanism, May 2026 rhizosphere sequencing data (PMC13210632) established that soil-applied potassium-solubilizing microorganisms secrete citric and organic acids against root-zone clay lattices to convert non-exchangeable mineral potassium into soluble ions [5].
How do Large Commercial Farms shape the farm type segment?
Large Commercial Farms garner a forecast 46.8% share of 2026 farm type segment adoption, enabled by precision strip-trial validation.
Adopting a biological potassium inoculant requires grid soil sampling, in-season plant petiole testing, and combine yield mapping to verify that microbial treatments actually lift exchangeable potassium ppm levels. Large Commercial Farms already own variable-rate in-furrow liquid tanks and automated planter-box applicators, allowing them to run side-by-side strip trials and scale farm-wide orders without capital equipment hurdles. Mid-Size Farms and Smallholders typically wait for cooperative extension validation before buying biologicals, which keeps early and repeat commercial volume concentrated on large farm enterprises.
- The Large Commercial Farms subsegment garners a forecast 46.8% share of 2026 farm type segment adoption, resulting from automated planter delivery hardware and multi-zone soil-testing capabilities.
- To support this farm-scale validation, in January 2026, Indigo Ag and Pivot Bio announced a joint biologicals research initiative with AgriThority to standardize multi-location commercial farm strip trials [6].
Why do Agri-Input Distributors lead the sales channel segment?
Agri-Input Distributors record an anticipated 37.3% share of 2026 sales channel segment orders, attributable to agronomic soil-test advisory services.
Growers rarely purchase potassium-solubilizing microbes blind from online catalogs because strain performance depends heavily on local soil cation exchange capacity and tank-mix compatibility with starter fertilizers. Full-service Agri-Input Distributors overcome grower skepticism by employing certified crop advisers who interpret soil potassium indices, manage local warehouse inventory, and bundle biologicals with seasonal financing. While Cooperatives represent the second-largest channel through member bulk tenders, independent and national agri-input distributors capture the largest share of commercial prescriptions.
- The Agri-Input Distributors subsegment records an anticipated 37.3% share of 2026 sales channel segment orders, reinforced by technical agronomy support and local dry warehouse fulfillment.
- For instance, in February 2025, Pivot Bio expanded its commercial microbial retail network through an agreement with agricultural cooperative and distributor ALCIVIA across four Midwest grain states in the USA [7].
What are the drivers, restraints, and opportunities in the potassium release biologics market?
In the potassium release biologics market, high farm fertilizer budgets are projected to encourage microbial potash mobilization whereas field-to-field yield variability restrains rapid conversion and certified biostimulant formulations create commercial opportunities.
- Driver: Elevated crop fertilizer operating expenses and large pools of fixed silicate soil potassium motivate growers to trial potassium-solubilizing microorganisms.
- Restraint: Inconsistent field-trial yield responses compared with greenhouse studies and strict European microbial registration rules slow repeat grower purchasing.
- Opportunity: Combining third-party biostimulant certification and shelf-stable dry spore formulations with soil-test potassium diagnostics opens cooperative retail distribution.
Growth Analysis and Future Potential: Qualitative Demand Catalysts
Persistent farm margin compression from synthetic fertilizer bills is the primary catalyst pushing commercial growers to release fixed potassium reserves already sitting in their soils. Even after chemical fertilizer prices eased from historical spikes, nutrient inputs remain the single largest variable cost in row-crop budgets. As a matter of fact, farm cost bulletins published by USDA ERS in March 2025 showed that fertilizer expenses represented 33% to 44% of total corn operating costs in the USA between 2021 and 2024 [8]. Because of this heavy expense burden, growers managing potassium sulfate and specialty potash inputs are adopting rhizosphere potassium-solubilizing bacteria to extract more plant-available potassium per dollar of fertilizer spend.
Risk Assessment of the Potassium Release Biologics Market: Operational and Formulation Friction
Restrictive European Union microbial registration lists and uneven field colonization under drought or cold stress act as major restraints on potassium release biologics adoption. Under EU Fertilising Products Regulation 2019/1009 Component Material Category 7, harmonized CE-marked microbial plant biostimulants remain limited to four microbial groups, which forces *Bacillus* and *Frateuria* potassium solubilizers to navigate fragmented national member-state registrations. Highlighting the cost of this regulatory bottleneck, economic modeling published by the European Biostimulants Industry Council in June 2026 reported that abiotic crop stress costs European Union farmers EUR 17.4 billion annually while slow EU microbial Positive List updates delay farmer access to novel strains [9]. Until regulatory pathways broaden and field survival matches humic acid soil conditioners, growers remain cautious about cutting baseline chemical potash rates.
Commercial Opportunity Analysis: Formulation Differentiation and Value-Add Formats
Biological input manufacturers can win major cooperative distribution contracts by securing independent third-party efficacy certification and formulating dry endospore powders that coat bulk fertilizer granules. Agricultural retailers often reject unverified microbial jugs, but formal industry certification gives crop advisers audited proof of nutrient mobilization and toxicological safety. For instance, in June 2025, Verdesian Life Sciences earned the Certified Biostimulant label from The Fertilizer Institute for its Primacy Alpha nutrient-efficiency formulation after independent efficacy and safety audits [10]. Applying this certified validation model to spore-forming potassium solubilizers allows suppliers to co-formulate biological coatings directly onto mined potash ores and salts at retail blending towers.
Potassium Release Biologics Market by Country (2026 to 2036)
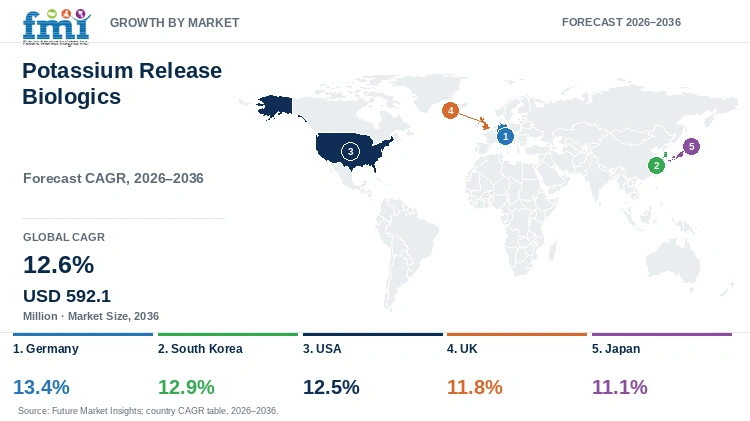
Regional adoption patterns show Germany heading evaluated country growth for potassium release biologics at 13.4% per year over 2026 to 2036 ahead of South Korea (12.9% CAGR) and the USA (12.5% CAGR), while the UK (11.8% CAGR) and Japan (11.1% CAGR) follow close behind. Country-level adoption patterns reflect domestic potash consumption intensity and rhizosphere mineral-weathering research in addition to regulatory evidence standards governing biostimulant label claims.
Table 7: Country CAGR and Primary Growth Levers for the Potassium Release Biologics Market (CAGR percentage and operational drivers), 2026 to 2036
| Country | CAGR (2026 to 2036) | Primary Growth Lever |
|---|---|---|
| Germany | 13.4% | Strategic crop-science R&D focus and national microbial inoculant stewardship |
| South Korea | 12.9% | Verified 27.6% photosynthetic potassium-use efficiency gains from rhizosphere KSB |
| USA | 12.5% | Plant Biostimulant Act federal pathway momentum and high corn fertilizer cost shares |
| UK | 11.8% | Updated AHDB RB209 soil potassium index benchmarks guiding arable bioinoculant trials |
| Japan | 11.1% | Split and biological potassium mobilization boosting grain yield and starch viscosity |
Source: Future Market Insights analysis
Germany Potassium Release Biologics Market Outlook (2026 to 2036)
Strict farm nutrient-balance auditing and domestic biological fermentation investment place Germany at the top of European demand for rhizosphere potassium mobilization. In May 2025, Bayer announced a strategic realignment of its Crop Science research and formulation operations in Germany toward high-value agricultural technologies and biological crop-input innovation [11]. Arable farms testing microbial solubilizers to mobilize clay-fixed potassium reserves push potassium release biologics adoption in Germany forward at a projected 13.4% annual rate through 2036. However, because European Union Regulation 2019/1009 restricts harmonized CMC-7 microbial taxa, commercial inoculant formulators operating across Germany must use national fertilizer ordinance pathways to register spore-forming *Bacillus* strains for winter wheat and oilseed rape rotations.
Key takeaway: In Germany, domestic crop-science fermentation realignment and strict nutrient-stewardship mandates are projected to drive leading adoption of potassium-mobilizing inoculants.
South Korea Potassium Release Biologics Market Outlook (2026 to 2036)
Agricultural cooperatives tightening microbial input quality verification across domestic provinces lift potassium release biologics shipments in South Korea by an estimated 12.9% annually across the 2026 to 2036 window. Intensive greenhouse horticulture and paddy rice cultivation in South Korea require efficient root-zone potassium mobilization to reduce reliance on imported chemical potash fertilizers. Agronomic proof from January 2026 physiological plant-nutrition experiments (PMC12891073) revealed that rhizosphere potassium-solubilizing bacteria weather insoluble feldspar and mica lattices to raise photosynthetic potassium-use efficiency by 27.6% across intensive East Asian cropping systems [12]. Even so, regional cooperatives throughout South Korea refuse to list commercial bioinoculants without replicated local pot and field data.
Key takeaway: In South Korea, verified 27.6% potassium-use efficiency gains from rhizosphere bacteria and cooperative quality audits are estimated to accelerate potassium biologics adoption.
USA Potassium Release Biologics Market Outlook (2026 to 2036)
Massive Midwest corn and soybean acreage planted on illite-rich clay soils makes the USA the largest commercial market for in-furrow and seed-applied potassium-release inoculants. Legislative progress toward a unified federal regulatory pathway is accelerating supplier investment; in July 2025, The Fertilizer Institute testified before the U.S. House Agriculture Subcommittee in support of the Plant Biostimulant Act of 2025 to establish a uniform federal definition for biostimulants across the USA [13]. Commercial farm operators seeking higher return on fertilizer spend across Corn Belt soils lift potassium release biologics utilization in the USA at an expected 12.5% annual rate until 2036. Still, state-by-state label registration delays in the USA complicate multi-state launches.
Key takeaway: In the USA, federal Plant Biostimulant Act momentum and high Corn Belt fertilizer cost burdens are expected to sustain broad-acre strip-trial adoption of potassium-release inoculants.
UK Potassium Release Biologics Market Outlook (2026 to 2036)
Arable farmers in the UK manage potash applications against standardized national soil potassium indices, which gives biological suppliers a clear quantitative benchmark for proving rhizosphere potassium release. In March 2026, the Agriculture and Horticulture Development Board updated Section 1 and Section 4 of its Nutrient Management Guide (RB209) in the UK, linking cereal and oilseed potash recommendations directly to soil K indices and crop residue removal [14]. Adoption of potassium release biologics in the UK is forecast to advance at an 11.8% annual rate over the 2026 to 2036 window across eastern England cereal estates. However, cool spring soil temperatures in the UK can slow bacterial organic-acid secretion and require cold-tolerant strain selection.
Key takeaway: In the UK, updated AHDB RB209 soil potassium index guidelines are forecast to provide the primary agronomic benchmark for qualifying cereal and oilseed potassium bioinoculants.
Japan Potassium Release Biologics Market Outlook (2026 to 2036)
Near-total reliance on imported mineral potash is pushing agricultural cooperatives and specialty vegetable growers in Japan to adopt rhizosphere microbes that mobilize fixed volcanic-ash soil potassium. Demonstrating the crop-quality payoff of improved potassium nutrition, January 2026 split-potassium agronomic field trials (PMC12899501) found that targeted potassium mobilization on low-potassium soils (50 to 57 mg/kg available K) lifts harvested grain yield by 3.48% and raises starch pasting viscosity by 15.63% to 22.19% [15]. Prefectural agricultural cooperatives and greenhouse vegetable growers piloting mineral-weathering microbes put potassium release biologics orders in Japan on an anticipated 11.1% annual growth rate until 2036. Even so, strict JA cooperative trial audits in Japan lengthen supplier onboarding cycles.
Key takeaway: In Japan, documented grain-yield and starch-viscosity gains on low-potassium soils are anticipated to guide disciplined cooperative adoption of verified potassium-solubilizing microbes.
Full report country CAGRs cover: North America; Latin America; Western Europe; Eastern Europe; East Asia; South Asia and Pacific; Middle East and Africa.
Who are the notable companies in the potassium release biologics market?
Lallemand Plant Care, Novonesis, Indigo Ag, Verdesian Life Sciences, Kula Bio, Pivot Bio, BASF, and Bayer Crop Science are the notable companies in the potassium release biologics market.
Competitive participation in potassium release biologics spans specialized rhizosphere inoculant formulators and biological seed-treatment platforms as well as microbial nutrient developers expanding into multi-nutrient mobilization. Lallemand Plant Care and Novonesis along with Verdesian Life Sciences market commercial microbial inoculants and certified biostimulants with documented rhizosphere nutrient-solubilization and potassium-uptake data. Indigo Ag and BASF as well as Bayer Crop Science operate industrial fermentation facilities and planter-box seed application hardware, while Kula Bio and Pivot Bio lead in root-zone microbial nutrient delivery and cooperative agronomy retail networks.
- Rhizosphere Inoculant & Nutrient-Efficiency Formulators: Lallemand Plant Care and Novonesis along with Verdesian Life Sciences supply live *Bacillus* and *Penicillium* rhizosphere inoculants and certified biostimulant formulations across agricultural retail channels.
- Seed-Applied Biological & Fermentation Platforms: Indigo Ag and BASF as well as Bayer Crop Science combine industrial bio-fermentation scale and microbial strain engineering with dry-powder planter-box seed treatment delivery.
- Root-Zone Biological Nutrient Specialists: Kula Bio and Pivot Bio commercialize shelf-stable soluble powders and gene-edited rhizosphere microbes across broad-acre corn and grain cooperative networks.
Competitive Benchmarking: Potassium Release Biologics Market
Table 8: Competitive Benchmarking for the Potassium Release Biologics Market (qualitative capability ratings), 2026
| Company | Rhizosphere K-Mobilization Evidence | Microbial Formulation & Stability | Farm Retail & Co-op Channel Access | Geographic Reach |
|---|---|---|---|---|
| Lallemand Plant Care | High | High | Medium | High |
| Novonesis | High | High | High | High |
| Indigo Ag | Medium | High | High | High |
| Verdesian Life Sciences | Medium | Medium | High | Medium |
| Kula Bio | Medium | High | Medium | Medium |
| Pivot Bio | Medium | High | High | Medium |
| BASF | Medium | High | High | High |
| Bayer Crop Science | Medium | High | High | High |
Scoring basis: Capability tiers assess documented rhizosphere mineral-solubilization or potassium-uptake trial disclosures, shelf-stable dry endospore or wettable-powder delivery technology, and commercial distribution through agricultural cooperatives and input retailers. Geographic reach reflects active biological inoculant registrations across farming regions in Europe and North America in addition to crop markets in Latin America and Asia.
Key Developments in the Potassium Release Biologics Market
- BASF Agricultural Solutions commissioned its new dedicated biological crop-protection and microbial fermentation plant in Ludwigshafen, Germany in May 2026 to scale commercial bio-inoculant manufacturing [16].
- Verdesian Life Sciences earned a Certified Biostimulant certification from The Fertilizer Institute in July 2026 for its CROP+ foliar and nutrient-efficiency biological formulation [17].
- Verdesian Life Sciences launched commercial distribution of its Phree-uP rhizosphere nutrient-mobilization biological formulation across the Canadian agricultural market in July 2026 [18].
Key Players in the Potassium Release Biologics Market
Rhizosphere Inoculant & Nutrient-Efficiency Formulators
- Lallemand Plant Care
- Novonesis
- Verdesian Life Sciences
Seed-Applied Biological & Fermentation Platforms
- Indigo Ag
- BASF
- Bayer Crop Science
Root-Zone Biological Nutrient Specialists
- Kula Bio
- Pivot Bio
Potassium Release Biologics Market - Report Scope
Table 9: Report Scope for the Potassium Release Biologics Market (coverage fields and definitions), 2026 to 2036
| Coverage field | Report scope |
|---|---|
| Market breakdown | Product Type; Crop Type; Application Method; Farm Type; Sales Channel; Region |
| Quantitative Units | USD Million |
| Market Definition | Includes commercial supplier revenue from live microbial inoculants and microbe-plus-nutrient biological formulations sold with a potassium-solubilization, silicate mineral-weathering, or rhizosphere potassium-mobilization function across agricultural crops. Category Scope Note: Excludes synthetic muriate or sulfate of potash fertilizers, non-microbial humic/seaweed extracts sold alone, and nitrogen-only inoculants without potassium-mobilizing claims. |
| Regions Covered | North America; Latin America; Western Europe; Eastern Europe; East Asia; South Asia and Pacific; Middle East and Africa |
| Countries Covered | Germany, South Korea, USA, UK, Japan, and additional countries in the full report |
| Key Companies Covered | Lallemand Plant Care, Novonesis, Indigo Ag, Verdesian Life Sciences, Kula Bio, Pivot Bio, BASF, Bayer Crop Science |
| Forecast Period | 2026 to 2036 |
| Approach | Primary and secondary research with top-down and bottom-up market triangulation. |
Potassium Release Biologics Market - Research Methodology
Table 10: Research Methodology for the Potassium Release Biologics Market (research methods and approach), 2026 edition
| Method | Approach |
|---|---|
| Primary Research | Structured interviews with soil microbiologists, industrial bio-fermentation directors, cooperative crop advisers, and large commercial grain and horticulture growers across North America, Europe, and East Asia to validate per-hectare dosing rates and potassium mobilization benchmarks. |
| Secondary Research | Analysis of peer-reviewed KSM meta-analyses in Frontiers in Plant Science, PubMed Central rhizosphere mineral-weathering trials, USDA ERS farm fertilizer cost bulletins, AHDB RB209 nutrient management guides, EBIC biostimulant economic reports, and TFI Certified Biostimulant disclosures. |
| Market Sizing and Forecasting | Top-down commercial potassium-solubilizing bioinoculant revenues reconciled against bottom-up treated cropland hectares and formulated dry/liquid inoculant tonnage from 2025 to 2036. |
| Country Forecasting Model | Econometric country projections weight agricultural potash consumption intensity, national biostimulant registration frameworks, cooperative strip-trial networks, and farm fertilizer cost shares across five evaluated countries. |
| Operational Benchmark Traceability | Treated cropland area, formulated inoculant tonnage, and farm enterprise valuation indicators in Tables 2, 3, and 4 trace to USDA ERS, AHDB RB209, EBIC, and multi-environment KSM field-trial benchmarks. |
| Data Triangulation and Validation | Segment and country estimates are cross-checked against commercial fermentation capacity and agri-input distributor sales without double counting bulk chemical potash or standalone nitrogen-only biologicals. |
Potassium Release Biologics Market by Segments
Potassium Release Biologics Market segmented by Product Type:
- Single-Strain Products
- Multi-Strain Consortia
- Microbe + Nutrient Combos
- Others
Potassium Release Biologics Market segmented by Crop Type:
- Cereals & Grains
- Fruits & Vegetables
- Oilseeds & Pulses
- Turf & Ornamentals
- Others
Potassium Release Biologics Market segmented by Application Method:
- Soil Application
- Seed Application
- Fertigation / Drip
- Foliar Application
- Others
Potassium Release Biologics Market segmented by Farm Type:
- Large Commercial Farms
- Mid-Size Farms
- Smallholders
- Greenhouses & Nurseries
- Others
Potassium Release Biologics Market segmented by Sales Channel:
- Agri-Input Distributors
- Cooperatives
- Agri-Retail Chains
- Online / Direct-to-Farm
- Others
Potassium Release Biologics Market by Region
- North America
- United States
- Canada
- Latin America
- Brazil
- Mexico
- Argentina
- Chile
- Western Europe
- Germany
- France
- United Kingdom
- Italy
- Spain
- Benelux
- Nordics
- Eastern Europe
- Poland
- Czech Republic
- Romania
- Hungary
- East Asia
- China
- Japan
- South Korea
- South Asia and Pacific
- India
- ASEAN
- Australia and New Zealand
- Middle East and Africa
- GCC Countries
- South Africa
- Türkiye
- Israel
Research Sources and Bibliography
- [1] Frontiers in Plant Science. (2025, November 3). Frontiers | Multi-environment meta-analysis reveals the mechanism of action of potassium-solubilizing microorganisms on crop yields. Frontiers in Plant Science, 16, 1659478.
- [2] National Library of Medicine (PubMed Central). (2025, June 2). Isolation of highly efficient potassium solubilizing bacteria and their. PubMed Central (PMC12128357).
- [3] National Library of Medicine (PubMed Central). (2025, September 16). Bio-organic fertilizers modulate the rhizosphere bacterial community. PubMed Central (PMC12479494).
- [4] Pivot Bio. (2025, March 17). Pivot Bio Unveils PROVEN G3, with Powerful New Modes of Action and Patent-Protected Gene-Editing Technology | Pivot Bio. Pivot Bio Press Releases.
- [5] National Library of Medicine (PubMed Central). (2026, May 19). Gradient Potassium Application Differentially Regulates ... - PMC - NIH. PubMed Central (PMC13210632).
- [6] Indigo Ag. (2026, January 29). Pivot bio, Indigo Ag, AgriThority Lead the Charge on Biologicals. Indigo Ag Newsroom.
- [7] Pivot Bio. (2025, February 12). Pivot Bio's Retail Partnership Grows with Addition of ALCIVIA. Pivot Bio Press Releases.
- [8] USDA Economic Research Service (ERS). (2025, March 27). Fertilizer prices stable at onset of 2025 planting season, below highs of 2021 and 2022 | Economic Research Service. U.S. Department of Agriculture Charts of Note.
- [9] European Biostimulants Industry Council (EBIC). (2026, June 15). Climate is the greatest threat to EU crops, and biostimulants can. European Biostimulants Industry Council News.
- [10] Verdesian Life Sciences. (2025, June 27). Primacy Alpha Earns Certified Biostimulant Label from The Fertilizer Institute - Verdesian Life Sciences. Verdesian Life Sciences Newsroom.
- [11] Bayer AG. (2025, May 12). Bayer to focus production, research and development of its Crop. Bayer Global Media Releases.
- [12] National Library of Medicine (PubMed Central). (2026, January 23). Potassium-Solubilizing Bacteria Mediate Light-Potassium Synergy. PubMed Central (PMC12891073).
- [13] The Fertilizer Institute (TFI). (2025, July 22). Crop Innovation Hearing Targets Plant Biostimulant Act of 2025. The Fertilizer Institute Media Center.
- [14] Agriculture and Horticulture Development Board (AHDB). (2026, March 15). Nutrient Management Guide (RB209) | AHDB. Agriculture and Horticulture Development Board.
- [15] National Library of Medicine (PubMed Central). (2026, January 30). Delayed Potassium Application Alters Protein Accumulation While. PubMed Central (PMC12899501).
- [16] BASF SE. (2026, May 11). BASF Agricultural Solutions successfully commissions new fermentation plant for crop protection products in Ludwigshafen. BASF Global Media Releases.
- [17] Verdesian Life Sciences. (2026, July 13). Verdesian Life Sciences' CROP+® Earns Biostimulant Certification. Verdesian Life Sciences Newsroom.
- [18] Verdesian Life Sciences. (2026, July 21). Verdesian Life Sciences' Phree-uP® Now Available for Distribution. Verdesian Life Sciences Newsroom.
- [19] Novonesis. (2026, September 2). Novonesis to build next generation enzyme production facility in India. Novonesis Corporate News.
- [20] Bayer AG. (2026, September 15). Q&A-Bayer advances combined seed and crop protection pipeline. Bayer Global Media Releases.
- [21] Indigo Ag. (2026, January 20). Indian Farmers Unlock a New Harvest as Grow Indigo's First High. Indigo Ag Newsroom.
This bibliography is provided for reader reference and is not exhaustive. The full report contains the complete reference list and detailed citations.
This Report Answers
- How large is the potassium release biologics market in 2026 and 2036?
- Which soil potassium fixation and farm-budget pressures encourage biological nutrient trials?
- Why do Single-Strain Products lead the product type segment?
- What gives Cereals & Grains the leading crop type segment position?
- How do the evaluated country growth rates differ through 2036?
- Which notable companies have microbial formulation or agricultural retail channel capabilities?
- What limits potassium-mobilizing inoculant uptake and supplier switching?
- Which soil potassium tests, strain claims, and spore-viability checks should buyers evaluate before purchasing?
Frequently Asked Questions
How big is the potassium release biologics market in 2026, and what is forecast for 2036?
Global potassium release biologics industry valuation is forecast to climb from a 2025 total of USD 160.5 million toward a 2026 total of USD 180.7 million before touching USD 592.1 million in 2036 as commercial growers supplement mineral potash programs.
What is the CAGR for potassium release biologics from 2026 to 2036?
Global potassium release biologics industry valuation is forecast to advance at a 12.6% compound annual growth rate over 2026 to 2036, yielding USD 411.4 million in net ten-year added revenue across soil and seed-applied bioinoculants.
Which product type segment leads the potassium release biologics market?
Single-Strain Products hold a projected 46.9% share of 2026 product type segment demand, supported by simpler colony-forming-unit quality control and strain-specific regulatory registration.
Which crop type segment has the largest share in 2026?
Cereals & Grains account for an estimated 44.1% share of 2026 crop type segment volume, driven by extensive planted corn and wheat acreage where fertilizer represents 33% to 44% of operating costs.
Which evaluated countries have the highest potassium release biologics growth rates?
Germany leads at a 13.4% CAGR followed by South Korea at 12.9% and the USA at 12.5% from 2026 to 2036, reflecting European nutrient-stewardship rules and verified rhizosphere potassium-efficiency gains.
Which companies are notable in potassium release biologics?
Lallemand Plant Care, Novonesis, Indigo Ag, Verdesian Life Sciences, Kula Bio, Pivot Bio, BASF, and Bayer Crop Science anchor microbial fermentation, rhizosphere nutrient mobilization, and farm cooperative distribution.
Preview the report firsthand - request a free sample
Get SampleGet the brochure for pricing and purchase details.
Get PDFTable of Content
- Key Takeaways
- Market Size and CAGR
- Top Growth Driver
- Fastest Growing Segment
- Leading Region
- Key Companies
- Emerging Opportunities
- Executive Summary
- Global Market Outlook
- Demand-side Trends
- Supply-side Trends
- Technology Roadmap Analysis
- Analysis and Recommendations
- Analyst Perspective (What is happening? Why now? What should investors know?)
- Key Questions Answered
- How large is the market?
- What is the CAGR?
- What are key trends?
- Which region dominates?
- Who are the leaders?
- Market Overview
- Market Coverage / Taxonomy
- Market Definition / Scope / Limitations
- Research Methodology
- Chapter Orientation
- Analytical Lens and Working Hypotheses
- Market Structure, Signals, and Trend Drivers
- Benchmarking and Cross-market Comparability
- Market Sizing, Forecasting, and Opportunity Mapping
- Research Design and Evidence Framework
- Desk Research Programme (Secondary Evidence)
- Expert Input and Fieldwork (Primary Evidence)
- Tooling, Models, and Reference Databases
- Data Engineering and Model Build
- Quality Assurance and Audit Trail
- Market Background
- Market Dynamics (Drivers, Restraints, Opportunity, Trends)
- Scenario Forecast (Optimistic, Likely, Conservative)
- Impact Analysis
- AI Impact
- Sustainability Impact
- Regulatory Impact
- Technology Impact
- Consumer / Buyer Analysis
- Purchase Drivers
- Adoption Barriers
- Buyer Journey
- Opportunity Map Analysis
- Product Life Cycle Analysis
- Supply Chain Analysis
- Investment Feasibility Matrix
- Value Chain Analysis
- PESTLE and Porter's Analysis
- Regulatory Landscape
- Regional Parent Market Outlook
- Production and Consumption Statistics
- Import and Export Statistics
- Global Market Analysis and Forecast, 2021 to 2036
- Historical Market Size Value (USD Million) Analysis, 2021 to 2025
- Current and Future Market Size Value (USD Million) Projections, 2026 to 2036
- Y-o-Y Growth Trend Analysis
- Absolute $ Opportunity Analysis
- Global Market Pricing Analysis, 2021 to 2036
- Global Market Analysis and Forecast, By Product Type, 2021 to 2036
- Introduction / Key Findings
- Historical Market Size Value (USD Million) Analysis By Product Type, 2021 to 2025
- Current and Future Market Size Value (USD Million) Analysis and Forecast By Product Type, 2026 to 2036
- Single-Strain Products
- Multi-Strain Consortia
- Microbe + Nutrient Combos
- Others
- Y-o-Y Growth Trend Analysis By Product Type, 2021 to 2025
- Absolute $ Opportunity Analysis By Product Type, 2026 to 2036
- Global Market Analysis and Forecast, By Crop Type, 2021 to 2036
- Introduction / Key Findings
- Historical Market Size Value (USD Million) Analysis By Crop Type, 2021 to 2025
- Current and Future Market Size Value (USD Million) Analysis and Forecast By Crop Type, 2026 to 2036
- Cereals & Grains
- Fruits & Vegetables
- Oilseeds & Pulses
- Turf & Ornamentals
- Others
- Y-o-Y Growth Trend Analysis By Crop Type, 2021 to 2025
- Absolute $ Opportunity Analysis By Crop Type, 2026 to 2036
- Global Market Analysis and Forecast, By Application Method, 2021 to 2036
- Introduction / Key Findings
- Historical Market Size Value (USD Million) Analysis By Application Method, 2021 to 2025
- Current and Future Market Size Value (USD Million) Analysis and Forecast By Application Method, 2026 to 2036
- Soil Application
- Seed Application
- Fertigation / Drip
- Foliar Application
- Others
- Y-o-Y Growth Trend Analysis By Application Method, 2021 to 2025
- Absolute $ Opportunity Analysis By Application Method, 2026 to 2036
- Global Market Analysis and Forecast, By Farm Type, 2021 to 2036
- Introduction / Key Findings
- Historical Market Size Value (USD Million) Analysis By Farm Type, 2021 to 2025
- Current and Future Market Size Value (USD Million) Analysis and Forecast By Farm Type, 2026 to 2036
- Large Commercial Farms
- Mid-Size Farms
- Smallholders
- Greenhouses & Nurseries
- Others
- Y-o-Y Growth Trend Analysis By Farm Type, 2021 to 2025
- Absolute $ Opportunity Analysis By Farm Type, 2026 to 2036
- Global Market Analysis and Forecast, By Sales Channel, 2021 to 2036
- Introduction / Key Findings
- Historical Market Size Value (USD Million) Analysis By Sales Channel, 2021 to 2025
- Current and Future Market Size Value (USD Million) Analysis and Forecast By Sales Channel, 2026 to 2036
- Agri-Input Distributors
- Cooperatives
- Agri-Retail Chains
- Online / Direct-to-Farm
- Others
- Y-o-Y Growth Trend Analysis By Sales Channel, 2021 to 2025
- Absolute $ Opportunity Analysis By Sales Channel, 2026 to 2036
- Global Market Analysis and Forecast, By Region, 2021 to 2036
- Introduction
- Historical Market Size Value (USD Million) Analysis By Region, 2021 to 2025
- Current Market Size Value (USD Million) Analysis and Forecast By Region, 2026 to 2036
- North America
- Latin America
- Western Europe
- Eastern Europe
- East Asia
- South Asia and Pacific
- Middle East and Africa
- Market Attractiveness Analysis By Region
- North America Market Analysis and Forecast, By Country, 2021 to 2036
- Historical Market Size Value (USD Million) Trend Analysis By Market Taxonomy, 2021 to 2025
- Market Size Value (USD Million) Forecast By Market Taxonomy, 2026 to 2036
- By Country
- United States
- Canada
- By Product Type
- By Crop Type
- By Application Method
- By Farm Type
- By Sales Channel
- By Country
- Market Attractiveness Analysis
- By Country
- By Product Type
- By Crop Type
- By Application Method
- By Farm Type
- By Sales Channel
- Key Takeaways
- Latin America Market Analysis and Forecast, By Country
- Historical Market Size Value (USD Million) Trend Analysis By Market Taxonomy, 2021 to 2025
- Market Size Value (USD Million) Forecast By Market Taxonomy, 2026 to 2036
- By Country
- Brazil
- Mexico
- Argentina
- Chile
- By Product Type
- By Crop Type
- By Application Method
- By Farm Type
- By Sales Channel
- By Country
- Market Attractiveness Analysis
- By Country
- By Product Type
- By Crop Type
- By Application Method
- By Farm Type
- By Sales Channel
- Key Takeaways
- Western Europe Market Analysis and Forecast, By Country
- Historical Market Size Value (USD Million) Trend Analysis By Market Taxonomy, 2021 to 2025
- Market Size Value (USD Million) Forecast By Market Taxonomy, 2026 to 2036
- By Country
- Germany
- France
- United Kingdom
- Italy
- Spain
- Benelux
- Nordics
- By Product Type
- By Crop Type
- By Application Method
- By Farm Type
- By Sales Channel
- By Country
- Market Attractiveness Analysis
- By Country
- By Product Type
- By Crop Type
- By Application Method
- By Farm Type
- By Sales Channel
- Key Takeaways
- Eastern Europe Market Analysis and Forecast, By Country
- Historical Market Size Value (USD Million) Trend Analysis By Market Taxonomy, 2021 to 2025
- Market Size Value (USD Million) Forecast By Market Taxonomy, 2026 to 2036
- By Country
- Poland
- Czech Republic
- Romania
- Hungary
- By Product Type
- By Crop Type
- By Application Method
- By Farm Type
- By Sales Channel
- By Country
- Market Attractiveness Analysis
- By Country
- By Product Type
- By Crop Type
- By Application Method
- By Farm Type
- By Sales Channel
- Key Takeaways
- East Asia Market Analysis and Forecast, By Country
- Historical Market Size Value (USD Million) Trend Analysis By Market Taxonomy, 2021 to 2025
- Market Size Value (USD Million) Forecast By Market Taxonomy, 2026 to 2036
- By Country
- China
- Japan
- South Korea
- By Product Type
- By Crop Type
- By Application Method
- By Farm Type
- By Sales Channel
- By Country
- Market Attractiveness Analysis
- By Country
- By Product Type
- By Crop Type
- By Application Method
- By Farm Type
- By Sales Channel
- Key Takeaways
- South Asia and Pacific Market Analysis and Forecast, By Country
- Historical Market Size Value (USD Million) Trend Analysis By Market Taxonomy, 2021 to 2025
- Market Size Value (USD Million) Forecast By Market Taxonomy, 2026 to 2036
- By Country
- India
- ASEAN
- Australia and New Zealand
- By Product Type
- By Crop Type
- By Application Method
- By Farm Type
- By Sales Channel
- By Country
- Market Attractiveness Analysis
- By Country
- By Product Type
- By Crop Type
- By Application Method
- By Farm Type
- By Sales Channel
- Key Takeaways
- Middle East and Africa Market Analysis and Forecast, By Country
- Historical Market Size Value (USD Million) Trend Analysis By Market Taxonomy, 2021 to 2025
- Market Size Value (USD Million) Forecast By Market Taxonomy, 2026 to 2036
- By Country
- GCC Countries
- South Africa
- Türkiye
- Israel
- By Product Type
- By Crop Type
- By Application Method
- By Farm Type
- By Sales Channel
- By Country
- Market Attractiveness Analysis
- By Country
- By Product Type
- By Crop Type
- By Application Method
- By Farm Type
- By Sales Channel
- Key Takeaways
- Key Countries Market Analysis
- United States
- Pricing Analysis
- Market Share Analysis, 2025
- By Product Type
- By Crop Type
- By Application Method
- By Farm Type
- By Sales Channel
- Canada
- Pricing Analysis
- Market Share Analysis, 2025
- By Product Type
- By Crop Type
- By Application Method
- By Farm Type
- By Sales Channel
- Mexico
- Pricing Analysis
- Market Share Analysis, 2025
- By Product Type
- By Crop Type
- By Application Method
- By Farm Type
- By Sales Channel
- Brazil
- Pricing Analysis
- Market Share Analysis, 2025
- By Product Type
- By Crop Type
- By Application Method
- By Farm Type
- By Sales Channel
- Chile
- Pricing Analysis
- Market Share Analysis, 2025
- By Product Type
- By Crop Type
- By Application Method
- By Farm Type
- By Sales Channel
- Germany
- Pricing Analysis
- Market Share Analysis, 2025
- By Product Type
- By Crop Type
- By Application Method
- By Farm Type
- By Sales Channel
- United Kingdom
- Pricing Analysis
- Market Share Analysis, 2025
- By Product Type
- By Crop Type
- By Application Method
- By Farm Type
- By Sales Channel
- Italy
- Pricing Analysis
- Market Share Analysis, 2025
- By Product Type
- By Crop Type
- By Application Method
- By Farm Type
- By Sales Channel
- Spain
- Pricing Analysis
- Market Share Analysis, 2025
- By Product Type
- By Crop Type
- By Application Method
- By Farm Type
- By Sales Channel
- France
- Pricing Analysis
- Market Share Analysis, 2025
- By Product Type
- By Crop Type
- By Application Method
- By Farm Type
- By Sales Channel
- India
- Pricing Analysis
- Market Share Analysis, 2025
- By Product Type
- By Crop Type
- By Application Method
- By Farm Type
- By Sales Channel
- ASEAN
- Pricing Analysis
- Market Share Analysis, 2025
- By Product Type
- By Crop Type
- By Application Method
- By Farm Type
- By Sales Channel
- Australia and New Zealand
- Pricing Analysis
- Market Share Analysis, 2025
- By Product Type
- By Crop Type
- By Application Method
- By Farm Type
- By Sales Channel
- China
- Pricing Analysis
- Market Share Analysis, 2025
- By Product Type
- By Crop Type
- By Application Method
- By Farm Type
- By Sales Channel
- Japan
- Pricing Analysis
- Market Share Analysis, 2025
- By Product Type
- By Crop Type
- By Application Method
- By Farm Type
- By Sales Channel
- South Korea
- Pricing Analysis
- Market Share Analysis, 2025
- By Product Type
- By Crop Type
- By Application Method
- By Farm Type
- By Sales Channel
- Poland
- Pricing Analysis
- Market Share Analysis, 2025
- By Product Type
- By Crop Type
- By Application Method
- By Farm Type
- By Sales Channel
- Hungary
- Pricing Analysis
- Market Share Analysis, 2025
- By Product Type
- By Crop Type
- By Application Method
- By Farm Type
- By Sales Channel
- Türkiye
- Pricing Analysis
- Market Share Analysis, 2025
- By Product Type
- By Crop Type
- By Application Method
- By Farm Type
- By Sales Channel
- South Africa
- Pricing Analysis
- Market Share Analysis, 2025
- By Product Type
- By Crop Type
- By Application Method
- By Farm Type
- By Sales Channel
- United States
- Market Structure Analysis
- Competition Dashboard
- Competition Benchmarking
- Market Share Analysis of Top Players
- By Regional
- By Product Type
- By Crop Type
- By Application Method
- By Farm Type
- By Sales Channel
- Emerging Startups
- Innovation Benchmarking
- Competition Analysis
- Competition Deep Dive
- Lallemand Plant Care
- Overview
- Product Portfolio
- Profitability by Market Segments
- Sales Footprint
- Strategy Overview
- Marketing Strategy
- Product Strategy
- Channel Strategy
- Novonesis
- Indigo Ag
- Verdesian Life Sciences
- Kula Bio
- Pivot Bio
- BASF
- Bayer Crop Science
- Lallemand Plant Care
- Case Studies
- Success Stories
- Recent Developments
- Competition Deep Dive
- Assumptions & Acronyms Used


