AC DC Power Adapter Market Size and Share Forecast Outlook 2025 to 2035

The AC DC Power Adapter Market is estimated to be valued at USD 1.5 billion in 2025 and is projected to reach USD 3.7 billion by 2035, registering a compound annual growth rate (CAGR) of 9.2% over the forecast period.

The AC DC power adapter market is witnessing steady expansion, driven by the increasing proliferation of consumer electronics, home automation devices, and compact energy conversion systems. Press releases from electronics manufacturers and annual reports from power supply companies have emphasized rising demand for efficient, lightweight adapters capable of delivering stable power to a diverse range of devices.

Technological advancements have enabled better energy efficiency and thermal performance, meeting global regulatory standards for power consumption and safety. The shift toward smart homes and connected devices has significantly boosted residential usage, while industrial automation and the rise of telecommunication infrastructure have added to the demand in non-residential settings.

Supply chain resilience and regional manufacturing expansion have also contributed to market accessibility and cost optimization. Looking ahead, the market is expected to grow with increased adoption of IoT-enabled devices, energy-saving appliances, and e-mobility accessories that rely on compact and efficient power conversion. Segmental leadership is projected to come from the 200V–240V AC input type, which aligns with international power grids, and from residential applications where compact electronics are most heavily integrated.
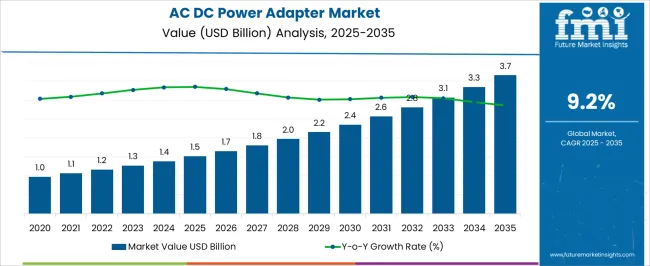
Quick Stats for AC DC Power Adapter Market

  • AC DC Power Adapter Market Industry Value (2025): USD 1.5 billion
  • AC DC Power Adapter Market Forecast Value (2035): USD 3.7 billion
  • AC DC Power Adapter Market Forecast CAGR: 9.2%
  • Leading Segment in AC DC Power Adapter Market in 2025: 200V-240V AC (42.7%)
  • Key Growth Region in AC DC Power Adapter Market: North America, Asia-Pacific, Europe
  • Top Key Players in AC DC Power Adapter Market: Xiaomi, Belkin International, MOMAX, ROMOSS, BULL, Schneider Electric, PISEN, Huntkey, ASUS, WorldConnect AG (Skross), Kikkerland Design Inc., ORICO, YOOBAO, Travel Inspira, BESTEK International, UGREEN, Kensington International (ACCO Brands), GME Technology, Shenzhen Flypower Technology

Ac Dc Power Adapter Market Market Value Analysis

Metric Value
AC DC Power Adapter Market Estimated Value in (2025 E) USD 1.5 billion
AC DC Power Adapter Market Forecast Value in (2035 F) USD 3.7 billion
Forecast CAGR (2025 to 2035) 9.2%

Segmental Analysis

The market is segmented by Type and Application and region. By Type, the market is divided into 200V-240V AC, 100V-120V AC, and 110V-240V AC. In terms of Application, the market is classified into Residential, Travel, Commercial, and Industrial. Regionally, the market is classified into North America, Latin America, Western Europe, Eastern Europe, Balkan & Baltic Countries, Russia & Belarus, Central Asia, East Asia, South Asia & Pacific, and the Middle East & Africa.
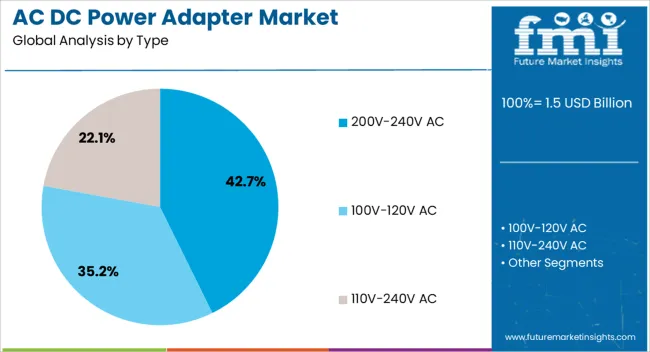
Insights into the Type Segment: 200V–240V AC

Ac Dc Power Adapter Market Analysis By Type

The 200V–240V AC segment is projected to contribute 42.7% of the AC DC power adapter market revenue in 2025, establishing itself as the dominant input type. This growth has been shaped by its compatibility with standard voltage ranges in Asia-Pacific, Europe, and parts of South America, where a large portion of global electronics production and consumption takes place.

Manufacturers have optimized adapter designs for these voltage ranges to meet efficiency standards while maintaining product safety and reliability. Additionally, consumer electronics such as TVs, routers, LED lighting systems, and home appliances commonly operate within this voltage range, reinforcing its widespread application.

Product announcements and compliance certifications have emphasized 200V–240V AC as the preferred input for international distribution, simplifying global logistics and design integration. As manufacturers continue to design universal adapters that cater to global markets, the 200V–240V AC segment is expected to maintain its leadership, driven by infrastructure alignment and standardized device voltage requirements.
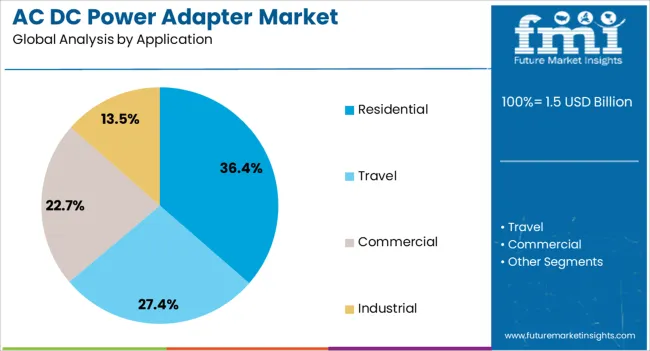
Insights into the Application Segment: Residential

Ac Dc Power Adapter Market Analysis By Application

The Residential segment is projected to account for 36.4% of the AC DC power adapter market revenue in 2025, sustaining its role as the primary application area. This segment’s growth has been influenced by the rising penetration of consumer electronics, smart home systems, and rechargeable devices in households.

Residential users increasingly rely on AC DC adapters for everyday use across a wide range of products, including laptops, routers, kitchen appliances, LED lighting, and personal grooming devices. Energy efficiency standards and safety certifications have encouraged the adoption of certified power adapters that support device longevity and minimize energy waste.

Additionally, the growth in remote work, online learning, and home entertainment ecosystems has led to higher demand for stable, noise-free power conversion in domestic environments. The availability of compact, multi-port, and universal adapters has further strengthened usage convenience within residential settings. With growing digitalization of home lifestyles and the rising number of connected devices per household, the Residential segment is expected to remain the largest consumer of AC DC power adapters globally.

Key Industry Highlights

Electronic Gadgets is a Necessity Trend Profits the Sales of Power Adapters

Modernization and digitalization have taken over the world. Electronic devices like smartphones, laptops, and tablets are of bare importance to every other individual.

Surge in use of these electronics has led to mass demand for power adapters. People working remotely and attending virtual classes need reliable and efficient power supplies. Thus requirement for power supplies has become more crucial than ever before.

Even the education systems have virtual and digital setups. Thus huge demand for power adapters to ensure proper teaching has curated new trends. This has proportionally increased the clamor of the AC DC power adapter market. Games in today's time are just virtual things. Children these days just play over screens. This has augmented the power adapter industry.

Growing Craze of Smart Homes attracts New Innovation

Growing trend of automated homes and the Internet of Things has contributed to the success of the AC DC power adapter market. Security cameras, smart speakers, and thermostats require power adapters to function. This fuels the surge of the power supply industry.

Adoption of Renewable Energy Sources is New Trend

Solar and wind power are major drivers in the industrial development of adapters. As households and businesses are switching to renewable energy.

Big companies and industry plants require power adapters to convert DC produced by solar panels or wind turbines to AC. All these requirements have led to the development of more reliable and efficient power adapters that work with renewable energy sources.

Rise in E-commerce Platforms has uplifted the Feasibility of Products

E-commerce platforms have made it easier for consumers to buy adapters online. With a variety of choices and multiple price options, platforms reflect the product portfolio and increase the visibility of the brand. Amazon and Alibaba have made it possible for buyers to read reviews and compare prices prior to making a purchase.

Creating more competitive growth, forcing manufacturers to innovate and offer better products at lower prices. Through online platforms, manufacturers are also able to reach a wider audience. Thus the demand and visibility of power adapters are growing rapidly with e-commerce platforms.

2020 to 2025 Global AC DC Power Adapter Sales Outlook Compared to Demand Forecasts from 2025 to 2035

The global valuation recorded a CAGR of 6.6% from 2020 to 2025. Growth of the power supply sector has been ever-evolving for decades. With USD 1,358 for 2025, the development has raised the overall valuation in recent times. Evolution of electronic sectors, automotive, and industrialization has a boon to the growth of power adapters.

Rising demand for AC DC power adapters for usage in low-voltage, high-current processor applications was among the key drivers augmenting growth in earlier times. Due to substantial low voltage, shortcomings in ordinary electronic loads have steadily paved the way for the advancement of superior AC DC power adapters.

The change in the number of households and building automation frameworks from past times to today has changed the scenario of the power supply industry. From just the commercial segment to the residential segment, the application has widened to travel, industrial, and smart homes.

Talking about past frameworks, the power adapters were restricted to industries and manufacturing units, but the development started with a nascent position. Many attritions had a strong foothold, still the process of generating power supply till tips of our hands took measure success.

Electrical vehicles and renewable energy have made a large change changed in the AC DC power adapter era. The modifications and technological advances in cultivating solar energy and making lesser energy consumption is a new trend shaping the future of the power supply industry in recent times.

Category-wise Insights

200V to 240V AC Power Adapters to Gain Impetus

200V- 240V AC is one of the most versatile and widely compatible power adapter types. The versatility of this type makes it the preferred choice of many electronic devices and appliances.

Thus, this type is compatible with most power grids around the globe, with some exception countries. 200V-240V AC power adapter type is highly efficient, with a projected share of 29.7% for 2025.

Segment 200V to 240V AC (Type)
Value Share (2025) 29.7%

200V-240V AC power adapter type is popular among conscious consumers and manufacturers, as it operates at a higher voltage than many other power adapter types. Thus, it is able to deliver more power to electronic devices or appliances with low energy consumption.

All these elements aid in soaring the success of the AC DC power adapter market. With the ever-growing nature of these appliances and the electronic world, the demand remains trending in the foreseeable future.

Rising Trend of Smart Home Profits Residential Application in AC DC Power Adapter Market

Surge in the clamor for different electronic devices and appliances is significantly augmenting the growth of this sector. Residential segment is the top application in this industry due to the widening use of electronic devices.

Laptops, smartphones, and home appliances in residential buildings are among livelihood things with have necessitated the production of these power adapters. Residential applications in AC DC power adapters are widely accepted and most popular, with a share of 32.6% for 2025.

Segment Residential (Application)
Value Share (2025) 32.6%

Home automation systems have mirrored big expansion in the residential sector. COVID-19 also has led to a shift towards remote working. Plus, increasing trends in renewable energy, such as solar power in residential buildings, have propelled the industry growth.

Country-wise Insights

The table below contains the CAGR of countries making prominence in the global AC DC power adapter market. Australia is among the prominent leaders in the power adapter market, with a CAGR of 8.3% through 2035.

Growing electrification, adoption of renewable energy sources, and evolution and mass demand for electronic goods have modified the country-wise importance of power adapters. With Australia, other countries like India, Germany, China, and the United States have evolved globally and internally.

Countries CAGR from 2025 to 2035
Australia 8.3%
India 7.8%
Germany 6.3%
China 5.8%
United States 5.4%

Introduction of Miniaturized Medical Equipment in Australia Gains Traction in Power Supply Sector

Technological advancements in medical equipment are soaring the profits of the AC DC power adapter landscape in Australia. Miniaturized medical equipment is highlighted in the developments of this sector as these products require very low AC source or DC sources.

Australia is progressing in industrial equipment, medical devices, and many other electronic manufacturing markets. Australia is at a commanding position, estimated to register a CAGR of 8.3% through 2035.

Growing electrification of rural regions is also spurring the region’s development in the power adapter sector. The Australian government is expanding its investments and efforts in electronic products. With modern lifestyles, smartphones, tablets, and automated home appliances have acquired the space of growth with the rising number of consumers.

Creating lucrative opportunities for manufacturers and new entrants in Australia for AC DC power adapters locally and globally. As investments in electronic manufacturing and production grows, Australia is set to enhance its global presence.

Electrical Vehicles have made a new Revolution in the Indian AC DC Power Adapter Market

Increasing penetration of mobile devices and the ongoing adoption of electric vehicles are two main factors boosting the AC DC power adapter market. Both of these elements have big foreign direct investments, propelling the sales and overall growth of this industry. India, with a CAGR of 7.8% from 2025 to 2035, is standing among prominent players globally in the power adapter industry.

India is also one of the fastest proceeding countries in consumer electronics sales and investments. Automation, medical instrumentation, and technological advancement have curated new grounds for India with large investments and adoption in various electronic sectors.

The Indian Brand Equity Foundation has reported India is aiming for around USD 300 billion in electronic manufacturing and across USD 120 billion in exports in coming years. Also, renewable energy is a big project under notion in India, contributing to the mass expansion of the AC DC power adapter sector.

Digitalization of Education Systems Profits AC DC Power Adapter Industry in the United States

Smartphone penetration and digitalization in various sectors in the United States bode well for this industry's success. Rising trend of smart education, virtual gaming, and digitalized medical centers is reiterating the adoption of power adapters.

Not just bucks of bangs but necessity has generated the high sales of these power adapters. Increasing acceptance of digital technology and known to be a highly advanced country, the United States is set to report a CAGR of 5.4% through 2035.

Belkin International, Inc. is a California-based company that excels in the production and selling of electrical connectivity accessories for various landscapes.

MX players, laptops, networking gear, gaming gear, and upgrade cards are some of their key products. The company has launched a 3-Outlet Power Cube on Amazon.com. Thus, by expanding its reach and advancing with AI and ML, the United States is acquiring larger grounds.
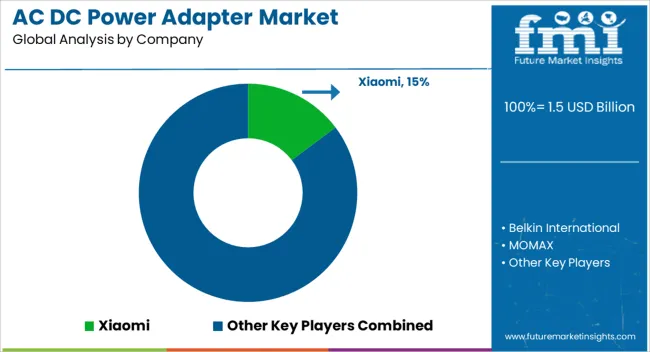
Competition Outlook

Ac Dc Power Adapter Market Analysis By Company

Manufacturers are aiming at growth strategies to increase reach to the audience. Collaborations and new launches with many startups entering the space have generated opportunities for many.

Automation has changed these aspects in many ways, and demand has increased hilariously. This trend of automation of electronic gadgets will round big sales, and with many innovations coming, retailers and consumers will gain profits.

Industry Updates

  • February 26th, 2025, Silanna Semiconductor expanded its CO2 Smart Power Family with the launch of an active clamp flyback (ACF) controller. This integrated adaptive digital PWM control with a 700 V primary GaN FET.
  • Texas Instruments (TI) expanded its low-power gallium nitride (GaN) portfolio on November 30, 2025. This helped shrink AC/DC power adapters by 50%, improving power density and system efficiency in consumer electronics and industrial systems.

Leading AC DC Power Adapter Brands

  • Belkin International
  • MOMAX
  • Xiaomi
  • ROMOSS
  • BULL
  • Schneider Electric
  • PISEN
  • Huntkey
  • ASUS
  • WorldConnect AG (Skross)
  • Kikkerland Design Inc.
  • ORICO
  • YOOBAO
  • Travel Inspira
  • BESTEK International
  • UGREEN
  • Kensington International (ACCO Brands)
  • GME Technology
  • Shenzhen Flypower Technology

Key Segments of AC DC Power Adapter Market Report

By Type:

The sector is majorly divided into 100V-120V AC, 200V-240V, and 110V-240V AC, based on type.

By Application:

AC DC power adapter is applied for travel, residential, commercial, and industrial applications.

By Region:

A regional analysis has been carried out in key countries of North America, Latin America, Asia Pacific, Middle East and Africa (MEA), and Europe.

Frequently Asked Questions

How big is the ac dc power adapter market in 2025?

The global ac dc power adapter market is estimated to be valued at USD 1.5 billion in 2025.

What will be the size of ac dc power adapter market in 2035?

The market size for the ac dc power adapter market is projected to reach USD 3.7 billion by 2035.

How much will be the ac dc power adapter market growth between 2025 and 2035?

The ac dc power adapter market is expected to grow at a 9.2% CAGR between 2025 and 2035.

What are the key product types in the ac dc power adapter market?

The key product types in ac dc power adapter market are 200v-240v ac, 100v-120v ac and 110v-240v ac.

Which application segment to contribute significant share in the ac dc power adapter market in 2025?

In terms of application, residential segment to command 36.4% share in the ac dc power adapter market in 2025.

Table of Content

  1. Executive Summary
    • Global Market Outlook
    • Demand-side Trends
    • Supply-side Trends
    • Technology Roadmap Analysis
    • Analysis and Recommendations
  2. Market Overview
    • Market Coverage / Taxonomy
    • Market Definition / Scope / Limitations
  3. Market Background
    • Market Dynamics
      • Drivers
      • Restraints
      • Opportunity
      • Trends
    • Scenario Forecast
      • Demand in Optimistic Scenario
      • Demand in Likely Scenario
      • Demand in Conservative Scenario
    • Opportunity Map Analysis
    • Product Life Cycle Analysis
    • Supply Chain Analysis
    • Investment Feasibility Matrix
    • Value Chain Analysis
    • PESTLE and Porter’s Analysis
    • Regulatory Landscape
    • Regional Parent Market Outlook
    • Production and Consumption Statistics
    • Import and Export Statistics
  4. Global Market Analysis 2020 to 2024 and Forecast, 2025 to 2035
    • Historical Market Size Value (USD Million) Analysis, 2020 to 2024
    • Current and Future Market Size Value (USD Million) Projections, 2025 to 2035
      • Y-o-Y Growth Trend Analysis
      • Absolute $ Opportunity Analysis
  5. Global Market Pricing Analysis 2020 to 2024 and Forecast 2025 to 2035
  6. Global Market Analysis 2020 to 2024 and Forecast 2025 to 2035, By Type
    • Introduction / Key Findings
    • Historical Market Size Value (USD Million) Analysis By Type , 2020 to 2024
    • Current and Future Market Size Value (USD Million) Analysis and Forecast By Type , 2025 to 2035
      • 200V-240V AC
      • 100V-120V AC
      • 110V-240V AC
    • Y-o-Y Growth Trend Analysis By Type , 2020 to 2024
    • Absolute $ Opportunity Analysis By Type , 2025 to 2035
  7. Global Market Analysis 2020 to 2024 and Forecast 2025 to 2035, By Application
    • Introduction / Key Findings
    • Historical Market Size Value (USD Million) Analysis By Application, 2020 to 2024
    • Current and Future Market Size Value (USD Million) Analysis and Forecast By Application, 2025 to 2035
      • Residential
      • Travel
      • Commercial
      • Industrial
    • Y-o-Y Growth Trend Analysis By Application, 2020 to 2024
    • Absolute $ Opportunity Analysis By Application, 2025 to 2035
  8. Global Market Analysis 2020 to 2024 and Forecast 2025 to 2035, By Region
    • Introduction
    • Historical Market Size Value (USD Million) Analysis By Region, 2020 to 2024
    • Current Market Size Value (USD Million) Analysis and Forecast By Region, 2025 to 2035
      • North America
      • Latin America
      • Western Europe
      • Eastern Europe
      • East Asia
      • South Asia and Pacific
      • Middle East & Africa
    • Market Attractiveness Analysis By Region
  9. North America Market Analysis 2020 to 2024 and Forecast 2025 to 2035, By Country
    • Historical Market Size Value (USD Million) Trend Analysis By Market Taxonomy, 2020 to 2024
    • Market Size Value (USD Million) Forecast By Market Taxonomy, 2025 to 2035
      • By Country
        • USA
        • Canada
        • Mexico
      • By Type
      • By Application
    • Market Attractiveness Analysis
      • By Country
      • By Type
      • By Application
    • Key Takeaways
  10. Latin America Market Analysis 2020 to 2024 and Forecast 2025 to 2035, By Country
    • Historical Market Size Value (USD Million) Trend Analysis By Market Taxonomy, 2020 to 2024
    • Market Size Value (USD Million) Forecast By Market Taxonomy, 2025 to 2035
      • By Country
        • Brazil
        • Chile
        • Rest of Latin America
      • By Type
      • By Application
    • Market Attractiveness Analysis
      • By Country
      • By Type
      • By Application
    • Key Takeaways
  11. Western Europe Market Analysis 2020 to 2024 and Forecast 2025 to 2035, By Country
    • Historical Market Size Value (USD Million) Trend Analysis By Market Taxonomy, 2020 to 2024
    • Market Size Value (USD Million) Forecast By Market Taxonomy, 2025 to 2035
      • By Country
        • Germany
        • UK
        • Italy
        • Spain
        • France
        • Nordic
        • BENELUX
        • Rest of Western Europe
      • By Type
      • By Application
    • Market Attractiveness Analysis
      • By Country
      • By Type
      • By Application
    • Key Takeaways
  12. Eastern Europe Market Analysis 2020 to 2024 and Forecast 2025 to 2035, By Country
    • Historical Market Size Value (USD Million) Trend Analysis By Market Taxonomy, 2020 to 2024
    • Market Size Value (USD Million) Forecast By Market Taxonomy, 2025 to 2035
      • By Country
        • Russia
        • Poland
        • Hungary
        • Balkan & Baltic
        • Rest of Eastern Europe
      • By Type
      • By Application
    • Market Attractiveness Analysis
      • By Country
      • By Type
      • By Application
    • Key Takeaways
  13. East Asia Market Analysis 2020 to 2024 and Forecast 2025 to 2035, By Country
    • Historical Market Size Value (USD Million) Trend Analysis By Market Taxonomy, 2020 to 2024
    • Market Size Value (USD Million) Forecast By Market Taxonomy, 2025 to 2035
      • By Country
        • China
        • Japan
        • South Korea
      • By Type
      • By Application
    • Market Attractiveness Analysis
      • By Country
      • By Type
      • By Application
    • Key Takeaways
  14. South Asia and Pacific Market Analysis 2020 to 2024 and Forecast 2025 to 2035, By Country
    • Historical Market Size Value (USD Million) Trend Analysis By Market Taxonomy, 2020 to 2024
    • Market Size Value (USD Million) Forecast By Market Taxonomy, 2025 to 2035
      • By Country
        • India
        • ASEAN
        • Australia & New Zealand
        • Rest of South Asia and Pacific
      • By Type
      • By Application
    • Market Attractiveness Analysis
      • By Country
      • By Type
      • By Application
    • Key Takeaways
  15. Middle East & Africa Market Analysis 2020 to 2024 and Forecast 2025 to 2035, By Country
    • Historical Market Size Value (USD Million) Trend Analysis By Market Taxonomy, 2020 to 2024
    • Market Size Value (USD Million) Forecast By Market Taxonomy, 2025 to 2035
      • By Country
        • Kingdom of Saudi Arabia
        • Other GCC Countries
        • Turkiye
        • South Africa
        • Other African Union
        • Rest of Middle East & Africa
      • By Type
      • By Application
    • Market Attractiveness Analysis
      • By Country
      • By Type
      • By Application
    • Key Takeaways
  16. Key Countries Market Analysis
    • USA
      • Pricing Analysis
      • Market Share Analysis, 2024
        • By Type
        • By Application
    • Canada
      • Pricing Analysis
      • Market Share Analysis, 2024
        • By Type
        • By Application
    • Mexico
      • Pricing Analysis
      • Market Share Analysis, 2024
        • By Type
        • By Application
    • Brazil
      • Pricing Analysis
      • Market Share Analysis, 2024
        • By Type
        • By Application
    • Chile
      • Pricing Analysis
      • Market Share Analysis, 2024
        • By Type
        • By Application
    • Germany
      • Pricing Analysis
      • Market Share Analysis, 2024
        • By Type
        • By Application
    • UK
      • Pricing Analysis
      • Market Share Analysis, 2024
        • By Type
        • By Application
    • Italy
      • Pricing Analysis
      • Market Share Analysis, 2024
        • By Type
        • By Application
    • Spain
      • Pricing Analysis
      • Market Share Analysis, 2024
        • By Type
        • By Application
    • France
      • Pricing Analysis
      • Market Share Analysis, 2024
        • By Type
        • By Application
    • India
      • Pricing Analysis
      • Market Share Analysis, 2024
        • By Type
        • By Application
    • ASEAN
      • Pricing Analysis
      • Market Share Analysis, 2024
        • By Type
        • By Application
    • Australia & New Zealand
      • Pricing Analysis
      • Market Share Analysis, 2024
        • By Type
        • By Application
    • China
      • Pricing Analysis
      • Market Share Analysis, 2024
        • By Type
        • By Application
    • Japan
      • Pricing Analysis
      • Market Share Analysis, 2024
        • By Type
        • By Application
    • South Korea
      • Pricing Analysis
      • Market Share Analysis, 2024
        • By Type
        • By Application
    • Russia
      • Pricing Analysis
      • Market Share Analysis, 2024
        • By Type
        • By Application
    • Poland
      • Pricing Analysis
      • Market Share Analysis, 2024
        • By Type
        • By Application
    • Hungary
      • Pricing Analysis
      • Market Share Analysis, 2024
        • By Type
        • By Application
    • Kingdom of Saudi Arabia
      • Pricing Analysis
      • Market Share Analysis, 2024
        • By Type
        • By Application
    • Turkiye
      • Pricing Analysis
      • Market Share Analysis, 2024
        • By Type
        • By Application
    • South Africa
      • Pricing Analysis
      • Market Share Analysis, 2024
        • By Type
        • By Application
  17. Market Structure Analysis
    • Competition Dashboard
    • Competition Benchmarking
    • Market Share Analysis of Top Players
      • By Regional
      • By Type
      • By Application
  18. Competition Analysis
    • Competition Deep Dive
      • Xiaomi
        • Overview
        • Product Portfolio
        • Profitability by Market Segments (Product/Age /Sales Channel/Region)
        • Sales Footprint
        • Strategy Overview
          • Marketing Strategy
          • Product Strategy
          • Channel Strategy
      • Belkin International
      • MOMAX
      • ROMOSS
      • BULL
      • Schneider Electric
      • PISEN
      • Huntkey
      • ASUS
      • WorldConnect AG (Skross)
      • Kikkerland Design Inc.
      • ORICO
      • YOOBAO
      • Travel Inspira
      • BESTEK International
      • UGREEN
      • Kensington International (ACCO Brands)
      • GME Technology
      • Shenzhen Flypower Technology
  19. Assumptions & Acronyms Used
  20. Research Methodology

List of Tables

  • Table 1: Global Market Value (USD Million) Forecast by Region, 2020-2035
  • Table 2: Global Market Value (USD Million) Forecast by Type , 2020-2035
  • Table 3: Global Market Value (USD Million) Forecast by Application, 2020-2035
  • Table 4: North America Market Value (USD Million) Forecast by Country, 2020-2035
  • Table 5: North America Market Value (USD Million) Forecast by Type , 2020-2035
  • Table 6: North America Market Value (USD Million) Forecast by Application, 2020-2035
  • Table 7: Latin America Market Value (USD Million) Forecast by Country, 2020-2035
  • Table 8: Latin America Market Value (USD Million) Forecast by Type , 2020-2035
  • Table 9: Latin America Market Value (USD Million) Forecast by Application, 2020-2035
  • Table 10: Western Europe Market Value (USD Million) Forecast by Country, 2020-2035
  • Table 11: Western Europe Market Value (USD Million) Forecast by Type , 2020-2035
  • Table 12: Western Europe Market Value (USD Million) Forecast by Application, 2020-2035
  • Table 13: Eastern Europe Market Value (USD Million) Forecast by Country, 2020-2035
  • Table 14: Eastern Europe Market Value (USD Million) Forecast by Type , 2020-2035
  • Table 15: Eastern Europe Market Value (USD Million) Forecast by Application, 2020-2035
  • Table 16: East Asia Market Value (USD Million) Forecast by Country, 2020-2035
  • Table 17: East Asia Market Value (USD Million) Forecast by Type , 2020-2035
  • Table 18: East Asia Market Value (USD Million) Forecast by Application, 2020-2035
  • Table 19: South Asia and Pacific Market Value (USD Million) Forecast by Country, 2020-2035
  • Table 20: South Asia and Pacific Market Value (USD Million) Forecast by Type , 2020-2035
  • Table 21: South Asia and Pacific Market Value (USD Million) Forecast by Application, 2020-2035
  • Table 22: Middle East & Africa Market Value (USD Million) Forecast by Country, 2020-2035
  • Table 23: Middle East & Africa Market Value (USD Million) Forecast by Type , 2020-2035
  • Table 24: Middle East & Africa Market Value (USD Million) Forecast by Application, 2020-2035

List of Figures

  • Figure 1: Global Market Pricing Analysis
  • Figure 2: Global Market Value (USD Million) Forecast 2020-2035
  • Figure 3: Global Market Value Share and BPS Analysis by Type , 2025 and 2035
  • Figure 4: Global Market Y-o-Y Growth Comparison by Type , 2025-2035
  • Figure 5: Global Market Attractiveness Analysis by Type
  • Figure 6: Global Market Value Share and BPS Analysis by Application, 2025 and 2035
  • Figure 7: Global Market Y-o-Y Growth Comparison by Application, 2025-2035
  • Figure 8: Global Market Attractiveness Analysis by Application
  • Figure 9: Global Market Value (USD Million) Share and BPS Analysis by Region, 2025 and 2035
  • Figure 10: Global Market Y-o-Y Growth Comparison by Region, 2025-2035
  • Figure 11: Global Market Attractiveness Analysis by Region
  • Figure 12: North America Market Incremental Dollar Opportunity, 2025-2035
  • Figure 13: Latin America Market Incremental Dollar Opportunity, 2025-2035
  • Figure 14: Western Europe Market Incremental Dollar Opportunity, 2025-2035
  • Figure 15: Eastern Europe Market Incremental Dollar Opportunity, 2025-2035
  • Figure 16: East Asia Market Incremental Dollar Opportunity, 2025-2035
  • Figure 17: South Asia and Pacific Market Incremental Dollar Opportunity, 2025-2035
  • Figure 18: Middle East & Africa Market Incremental Dollar Opportunity, 2025-2035
  • Figure 19: North America Market Value Share and BPS Analysis by Country, 2025 and 2035
  • Figure 20: North America Market Value Share and BPS Analysis by Type , 2025 and 2035
  • Figure 21: North America Market Y-o-Y Growth Comparison by Type , 2025-2035
  • Figure 22: North America Market Attractiveness Analysis by Type
  • Figure 23: North America Market Value Share and BPS Analysis by Application, 2025 and 2035
  • Figure 24: North America Market Y-o-Y Growth Comparison by Application, 2025-2035
  • Figure 25: North America Market Attractiveness Analysis by Application
  • Figure 26: Latin America Market Value Share and BPS Analysis by Country, 2025 and 2035
  • Figure 27: Latin America Market Value Share and BPS Analysis by Type , 2025 and 2035
  • Figure 28: Latin America Market Y-o-Y Growth Comparison by Type , 2025-2035
  • Figure 29: Latin America Market Attractiveness Analysis by Type
  • Figure 30: Latin America Market Value Share and BPS Analysis by Application, 2025 and 2035
  • Figure 31: Latin America Market Y-o-Y Growth Comparison by Application, 2025-2035
  • Figure 32: Latin America Market Attractiveness Analysis by Application
  • Figure 33: Western Europe Market Value Share and BPS Analysis by Country, 2025 and 2035
  • Figure 34: Western Europe Market Value Share and BPS Analysis by Type , 2025 and 2035
  • Figure 35: Western Europe Market Y-o-Y Growth Comparison by Type , 2025-2035
  • Figure 36: Western Europe Market Attractiveness Analysis by Type
  • Figure 37: Western Europe Market Value Share and BPS Analysis by Application, 2025 and 2035
  • Figure 38: Western Europe Market Y-o-Y Growth Comparison by Application, 2025-2035
  • Figure 39: Western Europe Market Attractiveness Analysis by Application
  • Figure 40: Eastern Europe Market Value Share and BPS Analysis by Country, 2025 and 2035
  • Figure 41: Eastern Europe Market Value Share and BPS Analysis by Type , 2025 and 2035
  • Figure 42: Eastern Europe Market Y-o-Y Growth Comparison by Type , 2025-2035
  • Figure 43: Eastern Europe Market Attractiveness Analysis by Type
  • Figure 44: Eastern Europe Market Value Share and BPS Analysis by Application, 2025 and 2035
  • Figure 45: Eastern Europe Market Y-o-Y Growth Comparison by Application, 2025-2035
  • Figure 46: Eastern Europe Market Attractiveness Analysis by Application
  • Figure 47: East Asia Market Value Share and BPS Analysis by Country, 2025 and 2035
  • Figure 48: East Asia Market Value Share and BPS Analysis by Type , 2025 and 2035
  • Figure 49: East Asia Market Y-o-Y Growth Comparison by Type , 2025-2035
  • Figure 50: East Asia Market Attractiveness Analysis by Type
  • Figure 51: East Asia Market Value Share and BPS Analysis by Application, 2025 and 2035
  • Figure 52: East Asia Market Y-o-Y Growth Comparison by Application, 2025-2035
  • Figure 53: East Asia Market Attractiveness Analysis by Application
  • Figure 54: South Asia and Pacific Market Value Share and BPS Analysis by Country, 2025 and 2035
  • Figure 55: South Asia and Pacific Market Value Share and BPS Analysis by Type , 2025 and 2035
  • Figure 56: South Asia and Pacific Market Y-o-Y Growth Comparison by Type , 2025-2035
  • Figure 57: South Asia and Pacific Market Attractiveness Analysis by Type
  • Figure 58: South Asia and Pacific Market Value Share and BPS Analysis by Application, 2025 and 2035
  • Figure 59: South Asia and Pacific Market Y-o-Y Growth Comparison by Application, 2025-2035
  • Figure 60: South Asia and Pacific Market Attractiveness Analysis by Application
  • Figure 61: Middle East & Africa Market Value Share and BPS Analysis by Country, 2025 and 2035
  • Figure 62: Middle East & Africa Market Value Share and BPS Analysis by Type , 2025 and 2035
  • Figure 63: Middle East & Africa Market Y-o-Y Growth Comparison by Type , 2025-2035
  • Figure 64: Middle East & Africa Market Attractiveness Analysis by Type
  • Figure 65: Middle East & Africa Market Value Share and BPS Analysis by Application, 2025 and 2035
  • Figure 66: Middle East & Africa Market Y-o-Y Growth Comparison by Application, 2025-2035
  • Figure 67: Middle East & Africa Market Attractiveness Analysis by Application
  • Figure 68: Global Market - Tier Structure Analysis
  • Figure 69: Global Market - Company Share Analysis
Dashboard
Dashboard
Dashboard
Dashboard
Dashboard
Dashboard

Full Research Suite comprises of:

Market outlook & trends analysis

Market outlook & trends analysis

Interviews & case studies

Interviews & case studies

Strategic recommendations

Strategic recommendations

Vendor profiles & capabilities analysis

Vendor profiles & capabilities analysis

5-year forecasts

5-year forecasts

8 regions and 60+ country-level data splits

8 regions and 60+ country-level data splits

Market segment data splits

Market segment data splits

12 months of continuous data updates

12 months of continuous data updates

DELIVERED AS:

PDF EXCEL ONLINE

Full Research Suite


$2000

$3500

$5000

Buy Report Now
Similar Industry Reports

Similar Industry Reports

Accounting Software Market

Accounting Software Market Size and Share Forecast Outlook 2025 to 2035

Active Wear Market
Active Wear Market

Active Wear Market Size and Share Forecast Outlook 2025 to 2035

Acid Resistant Pipe Market

Acid Resistant Pipe Market Forecast and Outlook 2025 to 2035

Activated Carbon for Sugar Decolorization Market

Activated Carbon for Sugar Decolorization Market Forecast and Outlook 2025 to 2035

Acrylic Paint Market

Acrylic Paint Market Forecast and Outlook 2025 to 2035

Acetate Silicone Sealant Market

Acetate Silicone Sealant Market Size and Share Forecast Outlook 2025 to 2035

Active, Smart, and Intelligent Packaging Market

Active, Smart, and Intelligent Packaging Market Size and Share Forecast Outlook 2025 to 2035

Acetone Market
Acetone Market

Acetone Market Size and Share Forecast Outlook 2025 to 2035

Activated Alumina Market

Activated Alumina Market Size and Share Forecast Outlook 2025 to 2035

Acrylic Fibre Market

Acrylic Fibre Market Size and Share Forecast Outlook 2025 to 2035

Acetoacetanilide Market

Acetoacetanilide Market Size and Share Forecast Outlook 2025 to 2035

Acetylacetone Market

Acetylacetone Market Size and Share Forecast Outlook 2025 to 2035

Acrylic Emulsions Market

Acrylic Emulsions Market Size and Share Forecast Outlook 2025 to 2035

AC Electric Motor Market

AC Electric Motor Market Size and Share Forecast Outlook 2025 to 2035

Acrylic Polymer Market

Acrylic Polymer Market Size and Share Forecast Outlook 2025 to 2035

Activated Carbon Fiber Market

Activated Carbon Fiber Market Size and Share Forecast Outlook 2025 to 2035

Acrylic Resin Market

Acrylic Resin Market Size and Share Forecast Outlook 2025 to 2035

AC Electromagnetic Brakes Market

AC Electromagnetic Brakes Market Size and Share Forecast Outlook 2025 to 2035

Acid Coil Cleaner Market

Acid Coil Cleaner Market Size and Share Forecast Outlook 2025 to 2035

Actinic Keratosis Treatment Market

Actinic Keratosis Treatment Market Size and Share Forecast Outlook 2025 to 2035

Future Market Insights

AC DC Power Adapter Market

Chat With MaRIA

Chat With

MaRIA

Hi There, I am MaRIA, Your Market Research Intelligence Assistant. How may I help you?