

- Market Size (2026)
- USD 136.4 Mn
- Forecast (2036)
- USD 581.3 Mn
- CAGR (2026 to 2036)
- 15.6%
Psychoacoustic Cabin Soundscaping Solutions Market Size, Market Forecast and Outlook By FMI
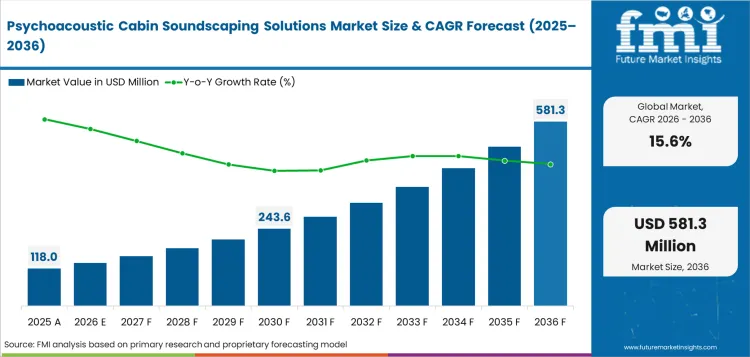
The psychoacoustic cabin soundscaping solutions market was valued at USD 118.0 million in 2025 and is projected to reach USD 136.4 million in 2026. It is forecast to reach USD 581.3 million by 2036 at 15.6% CAGR. Full-service airlines are projected to hold 56.0% share of end-user demand in 2026
Summary of the Psychoacoustic Cabin Soundscaping Solutions Market
- Demand and Growth Drivers
- Airline adoption is expanding as premium cabins use sound cues to create a calmer passenger feel.
- Adaptive soundscapes are gaining use because software can tune cabin ambience without major hardware changes.
- Business suite adoption is increasing as enclosed seats make personal sound zones more practical.
- Line-fit bundles are gaining attention because aircraft makers can integrate cabin audio earlier in the design cycle.
- Product and Segment View
- Widebody aircraft are expected to account for 47.0% share in 2026 as long routes make rest quality more visible.
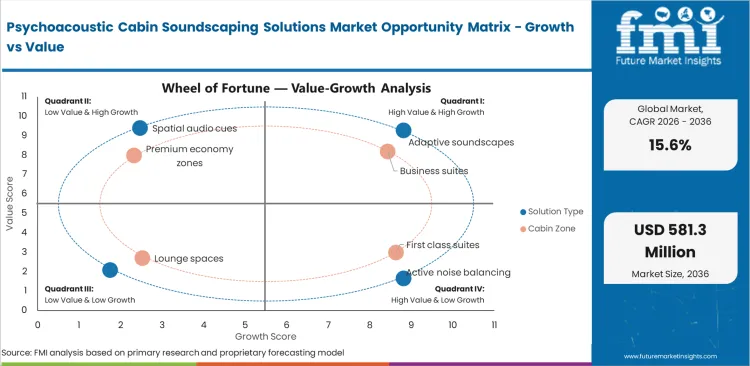
- Active noise balancing is projected to hold 27.0% share in 2026 as airlines test lighter ways to reduce harsh cabin tones.
- Cabin experience teams are linking aircraft seating with aircraft interior lighting to build branded premium zones.
- Retrofit kits are forecast to hold 39.0% share as older premium cabins need refresh work before full replacement.
- Geography and Competitive Outlook
- India is forecast at 17.4% CAGR through 2036 as airline fleet expansion raises the need for differentiated cabins.
- South Korea is projected to rise at 17.1% CAGR through 2036 as digital cabin suppliers work near aircraft electronics users.
- Panasonic Avionics and Thales shape connected entertainment routes for cabin sound services.
- Safran Passenger Innovations and Lufthansa Technik connect sound quality with premium seat control and retrofit work.
- Analyst Opinion
- Nikhil Kaitwade, FMI Principal Consultant at FMI says, "The opportunity for psychoacoustic cabin soundscaping centers on perception control. Airlines are not buying sound for decoration. They are buying a calmer cabin feel that supports rest and premium yield. Suppliers that prove low weight and easy certification are likely to secure the next wave of airline programs."
- Psychoacoustic Cabin Soundscaping Solutions Market Value Analysis
- Market value is rising as soundscaping shifts from background audio into a managed cabin experience layer.
- Seat-zone speakers add value by linking perceived quietness with passenger control and premium cabin branding.
- Acoustic software raises margins because airlines can refresh sound profiles without replacing full cabin hardware.
- Retrofit kits support value growth as older premium cabins need comfort upgrades before full seating replacement.
Key Takeaways, Market Size, and Forecast
- The psychoacoustic cabin soundscaping solutions market was valued at USD 118.0 million in 2025.
- By 2036, the psychoacoustic cabin soundscaping solutions market is expected to be worth USD 581.3 million.
- From 2026 to 2036, the market is projected to expand at 15.6% CAGR.
- The market is projected to create an incremental opportunity of USD 444.9 million between 2026 and 2036.
- Full-service airlines are projected to account for 56.0% share of end-user demand in 2026.
- Widebody aircraft are expected to account for 47.0% share of aircraft type demand in 2026.
- India at 17.4% CAGR and South Korea at 17.1% CAGR are the faster expanding country markets.
Aircraft cabin sound is becoming a design issue because passengers judge comfort through speech clarity and personal audio quality. DLR stated in February 2026 that its INTONATE project made cabin noise digitally tangible from source to passenger perception, which helps designers test acoustic comfort before cabin hardware is finalized. Airbus states that its Acoustic Flight Lab studies how noise enters the cabin and develops technologies to reduce cabin noise.
Panasonic Avionics stated in December 2024 that Icelandair’s A321neo Astrova system offers Spatial Audio on wired headsets or wireless headphones and 67 W USB-C power at each seat. Rosen Aviation announced in April 2024 an in-seat audio system for business aircraft using patented sound wave propagation to recreate tone and spatiality. Demand is therefore anticipated to be generated from airlines and private aircraft operators that want quieter cabins and controlled personal sound without adding passenger friction.
Psychoacoustic Cabin Soundscaping Solutions Market Definition
The psychoacoustic cabin soundscaping solutions market covers hardware and software used to manage perceived sound inside aircraft cabins. Scope includes adaptive cabin soundtracks and active noise balancing. Spatial audio cues and acoustic comfort analytics are included. Revenue includes seat-zone speakers and acoustic software. Controllers and integration services are counted when sold for commercial or business aircraft. The scope falls within aerospace interior work but excludes general cabin insulation and consumer headphones.
Psychoacoustic Cabin Soundscaping Solutions Market Inclusions
Market scope covers sound systems that are specified for passenger comfort inside aircraft cabins. It includes speaker arrays built into aircraft seats and cabin monuments. It includes seat actuation systems only when seat controls connect with personal sound modes. It includes in-flight internet only when the system uses connected content or passenger profiles to change the sound experience.
Psychoacoustic Cabin Soundscaping Solutions Market Exclusions
Scope does not include airport noise abatement systems or headset retail sales. Standard public address equipment is excluded when sold only for announcements. Exterior noise systems and exterior lighting are outside scope unless included in a cabin experience package. General acoustic insulation is excluded unless sold with software-based sound balancing.
Psychoacoustic Cabin Soundscaping Solutions Market Research Methodology
- Primary Research: FMI analysts reviewed cabin supplier portfolios, airline retrofit plans and premium-seat specification patterns in major aviation countries.
- Desk Research: The study used public data from aviation bodies and civil aviation agencies. Company releases and industry technical sources were used for supplier checks.
- Market sizing and forecasting: Market size was estimated through a hybrid bottom-up and top-down method. The model used aircraft delivery signals and premium cabin adoption assumptions.
- Data validation: Forecast checks compared supplier activity and aircraft production. Passenger traffic and adjacent cabin digital systems were used as cross-checks.
Why is the Psychoacoustic Cabin Soundscaping Solutions Market Growing?
- Airlines are adding calmer cabin zones as long-haul passengers pay for rest and privacy.
- Premium seats are being built with speakers and control panels that can host personal audio settings.
- Digital cabin systems make sound easier to tune through software after the aircraft has entered service.
Airline interest is rising as cabin comfort becomes measurable through passenger feedback and loyalty scores. The International Air Transport Association reported 6.1% higher revenue passenger kilometers in February 2026. The signal has weight for long-haul routes because flying hours create more exposure to fatigue and cabin noise. Soundscaping lowers the harsh feel of the cabin without changing the airframe. Suppliers that can tune sound around seat zones can sell into premium cabin refresh cycles.
The adoption limit is certification and weight control. Any cabin sound package must connect with power limits and safety rules before an airline accepts it. Cabin teams already combine on-board connectivity with entertainment and lighting controls. Soundscaping becomes easier to justify when it uses the same digital cabin backbone. The practical result is a market that expands first through premium suites and then moves into selected business-class cabins.
Market Segmentation Analysis
- Adaptive soundscapes are projected to reach 38.0% share in 2026 as airlines want controllable ambience.
- Business suites are expected to represent 42.0% share in 2026 as enclosed seats need personal acoustic tuning.
- Widebody aircraft are forecast to account for 47.0% share in 2026 as long sectors make quietness more valuable.
- Line-fit bundles are projected to capture 44.0% share in 2026 as cabin systems are easier to approve before delivery.
- Full-service airlines are estimated to account for 56.0% share in 2026 as fare classes depend on cabin separation.
The market is divided into five primary segment groups based on solution type and cabin zone. Aircraft type and delivery model explain how systems enter aircraft programs. End user shows who pays for the feature. Solution type explains how sound is produced and controlled. Delivery model explains whether the system enters through new builds or retrofit work.
Insights into the Adaptive Soundscapes Solution Type Segment
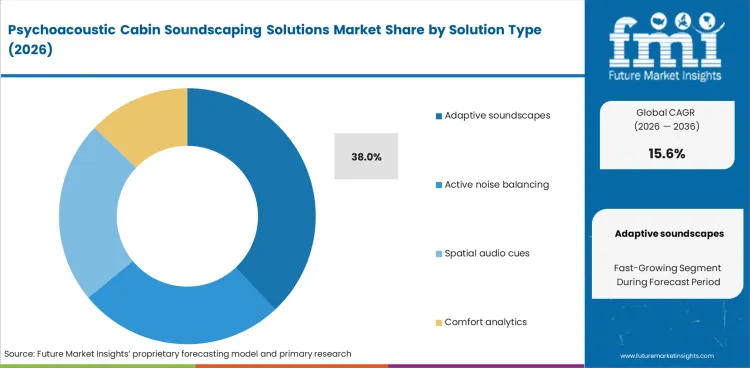
- Adaptive soundscapes are projected to account for 38.0% share of solution type demand in 2026. Airlines prefer this format as software can tune ambience by flight phase and cabin zone.
- The approach can work with lighting scenes and entertainment profiles. That gives suppliers a clearer route into aircraft lighting packages.
Insights into the Business Suites Cabin Zone Segment
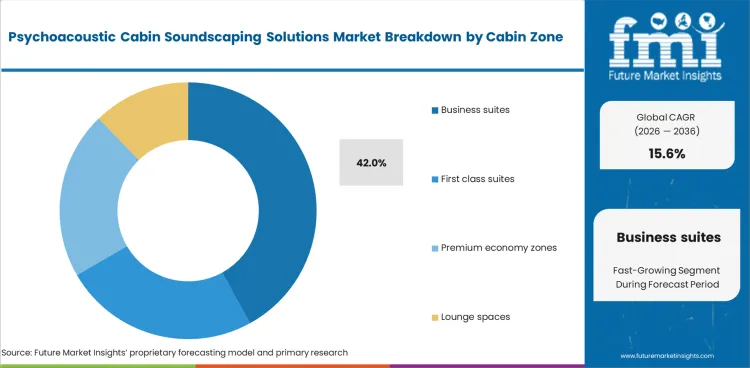
- Business suites are expected to hold 42.0% share of cabin-zone demand in 2026. The segment gains share as privacy doors and enclosed shells make personal sound control more useful.
- Airlines can place calm sound near the passenger without affecting nearby rows. This makes soundscaping a seat-level value feature. It can be sold with lighting and trim as part of a complete premium cabin theme.
Insights into the Widebody Aircraft Type Segment
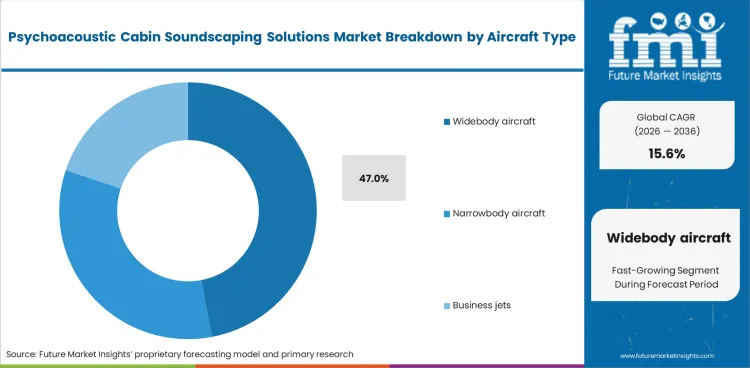
- Widebody aircraft are forecast to account for 47.0% share of aircraft type demand in 2026. Boeing delivered 600 commercial airplanes in 2025. Widebody deliveries within that total support premium cabin work since long routes carry more lie-flat seats.
- Flight length explains the segment position. Longer flights give passengers more time to notice low-frequency noise and speech privacy.
Insights into the Line-Fit Bundles Delivery Model Segment
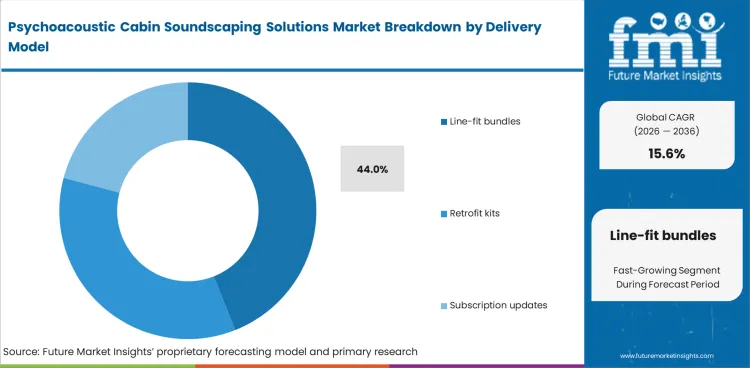
- Line-fit bundles are projected to account for 44.0% share of delivery model demand in 2026. Aircraft makers prefer complete packages that combine controllers and wiring before cabin certification. Software is added early so approval work is cleaner.
- This route reduces late-stage retrofit risk and gives airlines a clearer service entry. Soundscaping suppliers benefit when they can provide integration files and test data. Aircraft LED systems show the same preference for approved cabin electronics.
Insights into the Full-Service Airlines End User Segment
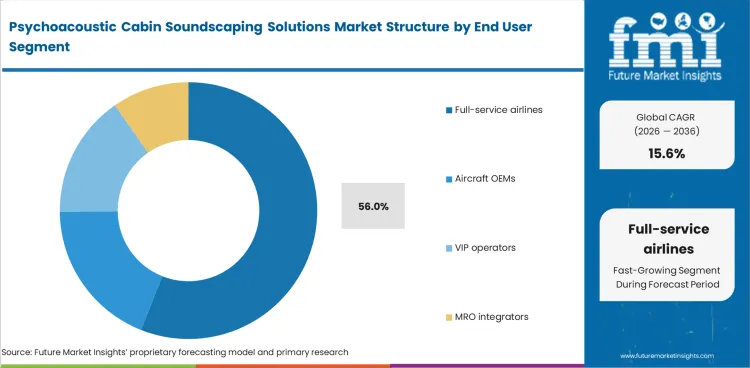
- Full-service airlines are estimated to account for 56.0% share of end-user demand in 2026. These carriers operate paid premium cabins and long international routes.
- Soundscaping supports fare separation by improving rest quality and reducing perceived noise fatigue. Low-cost airlines will use the technology more slowly as cabin cost per seat stays under pressure.
Psychoacoustic Cabin Soundscaping Solutions Market Drivers, Restraints, and Opportunities
- Premium rest quality is raising interest in seat-zone sound control.
- Certification and added weight are slowing broad cabin rollout.
- Retrofit refresh work creates opportunity for software-based acoustic upgrades.
One of the significant demand drivers is likely to be the need to make premium cabins feel calmer without major airframe changes. Cabin teams are using lighting and seat controls to build branded journeys. Connected entertainment gives soundscaping a low-visibility route with a clear passenger effect. Retrofit planners can add it during cabin reconfiguration and retrofit MRO services if wiring and speaker placement are already being touched. The main buyer question is whether the effect is noticeable enough to defend the added cost.
Certification Load Is Slowing Use
A growth barrier comes from aircraft approval work and maintainability. Speakers and cabin controls must be tested so that announcements remain clear. Added parts must be light and easy to service. This barrier is higher for economy cabins than premium suites. Airlines will delay broad use until suppliers show stable performance and simple maintenance across multiple aircraft types.
Personal Cabin Audio Creates Upside
The opportunity in the industry is in personal cabin audio that works without blocking passenger awareness. New premium suites can combine low-level sound fields with wireless entertainment and seat controls. This creates a calmer feel during boarding, cruise and sleep periods. Suppliers that prove clean handoff between safety audio and comfort audio will gain stronger airline trust. The winner will be the supplier that makes the feature feel simple.
Analysis of Psychoacoustic Cabin Soundscaping Solutions Market by Key Countries
.webp "Top Country Growth Comparison Psychoacoustic Cabin Soundscaping Solutions Market Cagr (2026 2036)")
| Country | CAGR |
|---|---|
| United States | 13.8% |
| China | 16.2% |
| India | 17.4% |
| Germany | 14.6% |
| Japan | 16.8% |
| South Korea | 17.1% |
| United Kingdom | 15.3% |
Source: Future Market Insights, 2026.
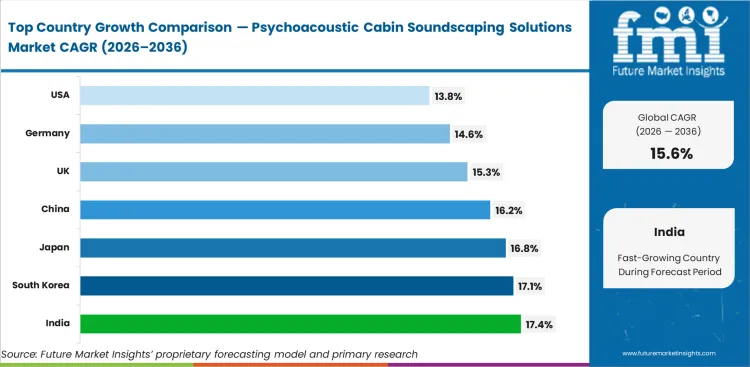
Psychoacoustic Cabin Soundscaping Solutions Market CAGR Analysis by Country
- The United States is projected to record a 13.8% CAGR through 2036 as premium fleet retrofit activity remains large.
- China is expected to expand at 16.2% CAGR through 2036 as fleet additions and domestic cabin upgrades widen the buyer pool.
- India is forecast to grow at 17.4% CAGR through 2036 as new long-haul aircraft create more premium seat zones.
- Germany is expected to advance at 14.6% CAGR through 2036 as cabin engineering firms support retrofit qualification.
- Japan is projected to rise at 16.8% CAGR through 2036 as airline cabin quality standards favor calmer long-haul cabins.
- South Korea is projected at 17.1% CAGR through 2036 as airline hubs and electronics suppliers support cabin audio trials.
- The United Kingdom is expected to post 15.3% CAGR through 2036 as airline design centers support premium cabin trials.
Demand for psychoacoustic cabin soundscaping solutions is forecast to rise at 15.6% CAGR from 2026 to 2036. Country-level analysis covers markets with airline fleet activity and aircraft electronics depth. Premium cabin upgrades and route profiles support acoustic comfort investment.
Demand Outlook for Psychoacoustic Cabin Soundscaping Solutions Market in the United States
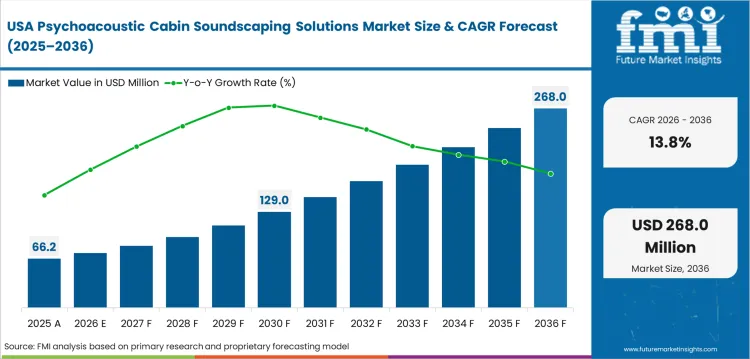
The United States is projected to record a 13.8% CAGR through 2036 as widebody retrofits and business aviation interiors create steady demand. The Bureau of Transportation Statistics reported 68.2 million systemwide enplanements in February 2026. Airlines in the country can use soundscaping to refine premium cabins without changing seat density. The market is expected to favor suppliers that connect audio control with certified cabin management systems.
- California design centers can test sound profiles for flagship cabins and entertainment systems.
- Washington and South Carolina aircraft programs create line-fit openings for certified cabin electronics.
- Florida business aviation work gives retrofit shops a route for speaker and cabin-control integration.
Sales Analysis of Psychoacoustic Cabin Soundscaping Solutions Market in China
China is expected to expand at 16.2% CAGR through 2036 as airline scale and local aircraft programs raise cabin-system demand. The State Council of China reported 770 million civil aviation passenger trips in 2025. This volume strengthens the case for cabin features that can separate premium products.
- Shanghai aircraft and airline clusters can test line-fit links for cabin sound controllers.
- Guangzhou and Shenzhen routes create premium travel volume for calmer long-haul cabins.
- Chengdu manufacturing capacity gives suppliers a route to support domestic cabin integration work.
Demand Outlook for Psychoacoustic Cabin Soundscaping Solutions Market in India
India is forecast to grow at 17.4% CAGR through 2036 as airline fleet expansion increases cabin differentiation needs. India’s Ministry of Civil Aviation reported 5,38,429 domestic passengers on November 23 2025. The single-day traffic record shows how quickly aircraft use is scaling. The practical implication is clear. Premium sound features is predicted to move into flagship international aircraft and selected domestic business cabins.
- Delhi and Mumbai long-haul networks create the first route for premium cabin sound trials.
- Bengaluru technology suppliers can support acoustic software and cabin electronics validation.
- Hyderabad maintenance clusters can support retrofit work when aircraft enter scheduled cabin checks.
Opportunity Analysis of Psychoacoustic Cabin Soundscaping Solutions Market in Germany
Germany is expected to advance at 14.6% CAGR through 2036 as cabin engineering and certification work shape supplier selection. DFS Deutsche Flugsicherung reported 3.071 million aircraft movements in German airspace during 2025. This aviation activity keeps the country close to aircraft operators and equipment makers. Cabin sound suppliers can use German engineering partners to prove safety audio priority and acoustic performance.
- Hamburg cabin suppliers give system firms access to aircraft interior qualification networks.
- Frankfurt airline operations create demand for premium cabin refresh work on long-haul aircraft.
- Munich engineering teams can test sound profiles with seat controls and digital cabin interfaces.
Future Outlook for Psychoacoustic Cabin Soundscaping Solutions Market in Japan
Japan is projected to rise at 16.8% CAGR through 2036 as premium service quality and cabin calm stay visible airline priorities. The Ministry of Land, Infrastructure, Transport and Tourism of Japan stated that initial SWIM services were scheduled to begin in 2025. Digital aviation infrastructure supports the wider shift toward data-aware aircraft operations.
- Tokyo airline design teams can test premium cabin sound profiles for long international routes.
- Nagoya aerospace suppliers can support integration work tied to seat and cabin control systems.
- Osaka service networks give suppliers a route to support retrofit pilots across widebody fleets.
Sales Analysis of Psychoacoustic Cabin Soundscaping Solutions Market in South Korea
South Korea is projected to rise at 17.1% CAGR through 2036 as electronics suppliers and airlines operate close together. The Ministry of Land, Infrastructure and Transport of Korea reported 1,013,830 flights in 2025. The traffic level crossed one million annual flights for the first time. The country is expected to adopt cabin sound features quickly when suppliers connect audio hardware with display and cabin electronics work.
- Seoul airline offices can align acoustic features with premium cabin brand planning.
- Gyeonggi electronics suppliers can support lightweight speakers and software control modules.
- Incheon hub operations create long-haul passenger exposure that makes cabin calm commercially useful.
Future Outlook for Psychoacoustic Cabin Soundscaping Solutions Market in the United Kingdom
The United Kingdom is expected to post 15.3% CAGR through 2036 as airline hubs and design firms support cabin trials. The United Kingdom Civil Aviation Authority reported 302 million passenger journeys through UK airports in 2025. That record traffic volume increases the value of premium experience features. London and regional cabin specialists can link soundscaping with premium service and airline amenity packaging plans.
- London airline headquarters can test sound features against customer experience measures.
- Cambridge audio and software skills can support psychoacoustic profile development.
- Manchester and Belfast aerospace suppliers can support retrofit packaging for selected aircraft programs.
Competitive Landscape and Strategic Positioning
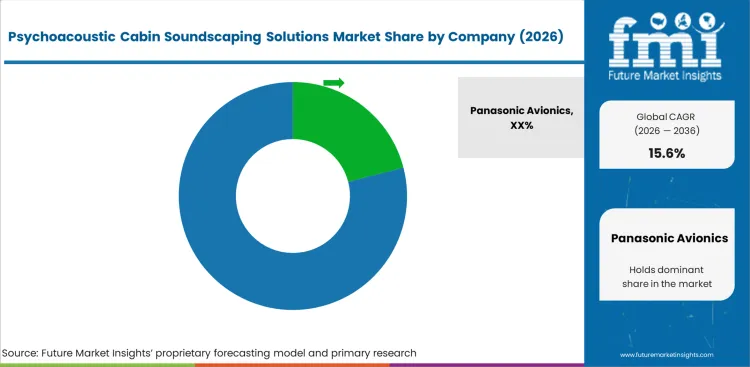
- Competition is centered on certified cabin integration rather than stand-alone audio quality.
- in-flight entertainment suppliers gain ground when audio profiles connect with displays and passenger controls.
- Seat and cabin integrators win when speakers disappear into premium suite structures.
- Smaller specialists must prove weight, power draw and safety audio priority before airline trials.
Competition in psychoacoustic cabin soundscaping market is shaped by trust in aircraft-ready integration. Panasonic Avionics and Thales hold strong positions as their entertainment systems already are close to passenger audio. Safran Passenger Innovations and Lufthansa Technik link sound to premium seat and cabin control work. Inflight retail and advertising is not the core revenue pool here as it shows how cabins are becoming digital selling spaces. Soundscaping will follow the same route when it can improve passenger mood with limited visible hardware.
The stronger supplier position belongs to firms that can combine acoustic tuning with approval files and airline service support. Collins Aerospace and Diehl Aviation add value through broader cabin systems. Ultra Precision Control Systems brings active noise and vibration experience from aerospace use. Pure audio specialists can influence the market through partnerships. They will struggle alone if they cannot meet aircraft documentation and maintainability needs.
Key Companies in the Psychoacoustic Cabin Soundscaping Solutions Market
Competition is best read by role because entertainment platforms, premium seating and active noise systems solve different buyer problems.
Connected Cabin Platform Leaders: Panasonic Avionics and Thales hold strong positions through in-flight entertainment systems, Bluetooth audio and connected cabin software. These companies can attach soundscaping features to existing passenger screens and content systems.
Seat and Cabin Integration Specialists: Safran Passenger Innovations and Collins Aerospace can fit acoustic features into seats and monuments. Lufthansa Technik and Diehl Aviation add cabin control strength. Their strengths sit in qualification data and aircraft integration.
Active Noise and Acoustic Control Specialists: Ultra Precision Control Systems supports the market through active noise and vibration capability. Its role is strongest in noise control knowledge that can feed future passenger cabin features.
Competitive Benchmarking: Psychoacoustic Cabin Soundscaping Solutions Market
| Company | Cabin Audio Integration | Certification Support | Psychoacoustic Tuning Depth | Geographic Footprint |
|---|---|---|---|---|
| Panasonic Avionics | High | Strong | Strong | Global with airline IFE depth |
| Thales Group | High | Strong | Strong | Global with AVANT and FlytEDGE programs |
| Safran Passenger Innovations | High | Strong | Medium | Global with Safran seating and interiors access |
| Collins Aerospace | Medium | Strong | Medium | Global with cabin and business aviation systems |
| Lufthansa Technik | Medium | Strong | Strong | Europe centered with VIP and retrofit depth |
| Diehl Aviation | Medium | Strong | Medium | Europe centered with cabin systems and accessibility work |
| Ultra Precision Control Systems | Low | Medium | Strong | United Kingdom centered with aerospace noise control depth |
Source: Future Market Insights competitive analysis 2026. Ratings reflect relative positioning based on cabin audio integration and certification support. Psychoacoustic tuning depth was used as the third capability check.
Key Developments in Psychoacoustic Cabin Soundscaping Solutions Market
- In April 2026, Thales and Air India signed a 10-year FlytCARE agreement covering aircraft with AVANT UP systems.
- In April 2026, Collins Aerospace secured three airline launch customers for Helix seating across nearly 200 aircraft.
- In April 2026, RAVE Aerospace and Safran Seats unveiled Origin with seating and in-flight entertainment demonstrators for premium air travel.
- In February 2026, Lufthansa Technik said Embraer Praetor 500E and 600E cabins would use Omni-Fi membrane speakers.
- In April 2026, Diehl Aviation won a Crystal Cabin Award for AURS with adaptive lighting and optional audio cues.
Key Players in the Psychoacoustic Cabin Soundscaping Solutions Market
Major Global Players:
- Panasonic Avionics Corporation
- Thales Group
- Safran Passenger Innovations
- Collins Aerospace
- Lufthansa Technik
- Diehl Aviation
Specialist and Adjacent Players:
- Ultra Precision Control Systems
- Devialet
- Moodsonic
- Bose Professional
Report Scope and Coverage
| Parameter | Details |
|---|---|
| Quantitative Units | USD 136.4 million to USD 581.3 million, at 15.6% CAGR |
| Market Definition | Cabin sound systems and software used to manage perceived passenger sound comfort |
| Solution Type | Adaptive soundscapes, Active noise balancing, Spatial audio cues, Comfort analytics |
| Cabin Zone | Business suites, First class suites, Premium economy zones, Lounge spaces |
| Aircraft Type | Widebody aircraft, Narrowbody aircraft, Business jets |
| Delivery Model | Line-fit bundles, Retrofit kits, Subscription updates |
| End User | Full-service airlines, aircraft original equipment manufacturers, VIP operators, maintenance, repair and overhaul integrators |
| Regions Covered | North America, Latin America, Western Europe, Eastern Europe, East Asia, South Asia and Pacific, Middle East and Africa |
| Countries Covered | United States, China, India, Germany, Japan, South Korea, United Kingdom, and 30+ countries |
| Key Companies Profiled | Panasonic Avionics, Thales, Safran Passenger Innovations, Collins Aerospace, Lufthansa Technik, Diehl Aviation, Ultra Precision Control Systems |
| Forecast Period | 2026 to 2036 |
| Approach | Hybrid bottom-up and top-down methodology using cabin electronics and premium seating. Aircraft curtains and aircraft delivery checks were used for validation. |
Source: Future Market Insights, 2026.
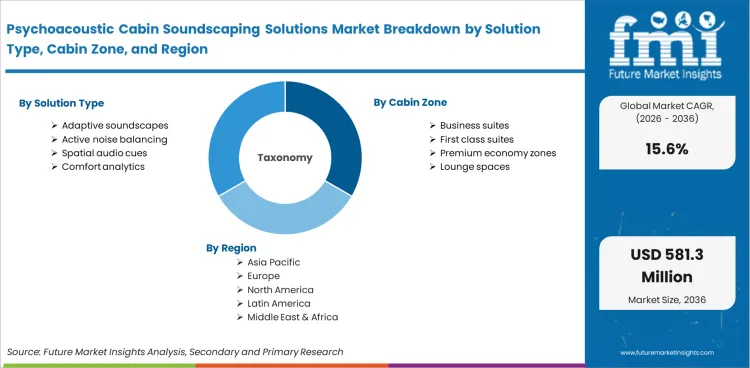
The Psychoacoustic Cabin Soundscaping Solutions Market is segmented by Solution Type, Cabin Zone, Aircraft Type, Delivery Model, End User, and Region
By Solution Type:
- Adaptive soundscapes
- Active noise balancing
- Spatial audio cues
- Comfort analytics
By Cabin Zone:
- Business suites
- First class suites
- Premium economy zones
- Lounge spaces
By Aircraft Type:
- Widebody aircraft
- Narrowbody aircraft
- Business jets
By Delivery Model:
- Line-fit bundles
- Retrofit kits
- Subscription updates
By End User:
- Full-service airlines
- Aircraft OEMs
- VIP operators
- MRO integrators
By Region:
- North America
- Latin America
- Western Europe
- Eastern Europe
- East Asia
- South Asia and Pacific
- Middle East and Africa
Research Sources and Bibliography
- 1. Airbus. (2026, January 12). Airbus reports 793 commercial aircraft deliveries in 2025.
- 2. Boeing. (2026, January 13). Boeing announces fourth quarter deliveries.
- 3. Bureau of Transportation Statistics. (2026, April 24). February 2026 U.S. airline traffic data up 1.5% from the same month last year.
- 4. China State Council. (2026, January 6). China's civil aviation sector achieves steady growth in 2025.
- 5. DFS Deutsche Flugsicherung. (2026, January 5). Air traffic in Germany 2025: More flights, good punctuality level.
- 6. Diehl Aviation. (2026, April 14). Diehl Aviation wins Crystal Cabin Award for accessibility innovation AURS.
- 7. International Air Transport Association. (2026, January 29). Strong 2025 passenger demand masks ongoing capacity constraints.
- 8. International Air Transport Association. (2026, March 31). February air passenger demand grows 6.1%.
- 9. Lufthansa Technik. (2026, February 25). Expanded partnership with Embraer on Praetor 500E and Praetor 600E.
- 10. Ministry of Civil Aviation, Government of India. (2026, January 21). Year end review of Ministry of Civil Aviation.
- 11. Ministry of Land, Infrastructure, Transport and Tourism. (2026, April). Collaborative actions for renovation of air traffic systems.
- 12. Ministry of Land, Infrastructure and Transport of Korea. (2026, February). Air traffic surpasses 1 million flights annually for the first time.
- 13. Panasonic Avionics. (2026, April 15). Panasonic Avionics' Astrova takes off on Air Canada.
- 14. RAVE Aerospace and Safran Seats. (2026, April 14). RAVE Aerospace and Safran unveil joint vision for the future of premium air travel: Origin.
- 15. RTX. (2026, April 15). RTX's Collins Aerospace secures three airline launch customers for its Helix main cabin seat.
- 16. Thales. (2026, April 20). Thales and Air India sign 10-year FlytCARE agreement for IFE maintenance.
- 17. Thales. (2026, April 14). Thales launches FlytEDGE Aura: The power of FlytEDGE with a future-ready IFE seat-end.
- 18. United Kingdom Civil Aviation Authority. (2026, February 24). UK aviation officially breaks records with over 300 million passenger journeys in 2025.
The bibliography is provided for reader reference and uses aviation bodies, government agencies, company sources and official technical releases relevant to cabin soundscaping.
This Report Answers
- What is the current and future size of the psychoacoustic cabin soundscaping solutions market?
- How fast is the psychoacoustic cabin soundscaping solutions market expected to expand between 2026 and 2036?
- Which solution type is expected to lead psychoacoustic cabin soundscaping solutions demand by 2026?
- Which cabin zone is projected to account for the strongest psychoacoustic cabin soundscaping solutions share in 2026?
- Why are business suites and widebody aircraft important for this market?
- How do certification work and added cabin weight affect adoption?
- Which countries are projected to record faster expansion during the forecast period?
- Who are the main companies active in psychoacoustic cabin soundscaping solutions?
- How does FMI define the psychoacoustic cabin soundscaping solutions scope?
- How does FMI estimate and validate the psychoacoustic cabin soundscaping solutions forecast?
Frequently Asked Questions
What is the global market demand for Psychoacoustic Cabin Soundscaping Solutions in 2026?
The market is projected at USD 136.4 million in 2026 as airlines test calmer cabin zones in premium interiors.
How big will the Psychoacoustic Cabin Soundscaping Solutions Market be in 2036?
The market is forecast to reach USD 581.3 million by 2036 as sound becomes part of digital cabin design.
How much is demand for Psychoacoustic Cabin Soundscaping Solutions expected to expand between 2026 and 2036?
Demand is projected to expand at 15.6% CAGR from 2026 to 2036 across line-fit and retrofit cabin programs.
Which solution type is expected to lead the Psychoacoustic Cabin Soundscaping Solutions Market by 2026?
Adaptive soundscapes are projected to lead with 38.0% share in 2026 as software tuning fits airline brand needs.
Which cabin zone is expected to lead Psychoacoustic Cabin Soundscaping Solutions demand in 2026?
Business suites are expected to lead with 42.0% share in 2026 because privacy shells make personal sound control useful.
Which country is forecast to grow fastest in the Psychoacoustic Cabin Soundscaping Solutions Market?
India is forecast at 17.4% CAGR through 2036 as fleet expansion increases premium cabin upgrade needs.
What does the Psychoacoustic Cabin Soundscaping Solutions Market include?
The market includes adaptive soundscapes, active noise balancing, spatial audio cues and acoustic comfort analytics used inside aircraft cabins.
Preview the report firsthand - request a free sample
Get SampleGet the brochure for pricing and purchase details.
Get PDFTable of Content
- Key Takeaways
- Market Size and CAGR
- Top Growth Driver
- Fastest Growing Segment
- Leading Region
- Key Companies
- Emerging Opportunities
- Executive Summary
- Global Market Outlook
- Demand-side Trends
- Supply-side Trends
- Technology Roadmap Analysis
- Analysis and Recommendations
- Analyst Perspective (What is happening? Why now? What should investors know?)
- Key Questions Answered
- How large is the market?
- What is the CAGR?
- What are key trends?
- Which region dominates?
- Who are the leaders?
- Market Overview
- Market Coverage / Taxonomy
- Market Definition / Scope / Limitations
- Research Methodology
- Chapter Orientation
- Analytical Lens and Working Hypotheses
- Market Structure, Signals, and Trend Drivers
- Benchmarking and Cross-market Comparability
- Market Sizing, Forecasting, and Opportunity Mapping
- Research Design and Evidence Framework
- Desk Research Programme (Secondary Evidence)
- Expert Input and Fieldwork (Primary Evidence)
- Tooling, Models, and Reference Databases
- Data Engineering and Model Build
- Quality Assurance and Audit Trail
- Market Background
- Market Dynamics (Drivers, Restraints, Opportunity, Trends)
- Scenario Forecast (Optimistic, Likely, Conservative)
- Impact Analysis
- AI Impact
- Sustainability Impact
- Regulatory Impact
- Technology Impact
- Consumer / Buyer Analysis
- Purchase Drivers
- Adoption Barriers
- Buyer Journey
- Opportunity Map Analysis
- Product Life Cycle Analysis
- Supply Chain Analysis
- Investment Feasibility Matrix
- Value Chain Analysis
- PESTLE and Porter's Analysis
- Regulatory Landscape
- Regional Parent Market Outlook
- Production and Consumption Statistics
- Import and Export Statistics
- Global Market Analysis and Forecast, 2021 to 2036
- Historical Market Size Value (USD Million) & Volume (Unit) Analysis, 2021 to 2025
- Current and Future Market Size Value (USD Million) & Volume (Unit) Projections, 2026 to 2036
- Y-o-Y Growth Trend Analysis
- Absolute $ Opportunity Analysis
- Global Market Pricing Analysis, 2021 to 2036
- Global Market Analysis and Forecast, By Solution Type, 2021 to 2036
- Introduction / Key Findings
- Historical Market Size Value (USD Million) & Volume (Unit) Analysis By Solution Type, 2021 to 2025
- Current and Future Market Size Value (USD Million) & Volume (Unit) Analysis and Forecast By Solution Type, 2026 to 2036
- Adaptive soundscapes
- Active noise balancing
- Spatial audio cues
- Comfort analytics
- Adaptive soundscapes
- Y-o-Y Growth Trend Analysis By Solution Type, 2021 to 2025
- Absolute $ Opportunity Analysis By Solution Type, 2026 to 2036
- Global Market Analysis and Forecast, By Cabin Zone, 2021 to 2036
- Introduction / Key Findings
- Historical Market Size Value (USD Million) & Volume (Unit) Analysis By Cabin Zone, 2021 to 2025
- Current and Future Market Size Value (USD Million) & Volume (Unit) Analysis and Forecast By Cabin Zone, 2026 to 2036
- Business suites
- First class suites
- Premium economy zones
- Lounge spaces
- Business suites
- Y-o-Y Growth Trend Analysis By Cabin Zone, 2021 to 2025
- Absolute $ Opportunity Analysis By Cabin Zone, 2026 to 2036
- Global Market Analysis and Forecast, By Aircraft Type, 2021 to 2036
- Introduction / Key Findings
- Historical Market Size Value (USD Million) & Volume (Unit) Analysis By Aircraft Type, 2021 to 2025
- Current and Future Market Size Value (USD Million) & Volume (Unit) Analysis and Forecast By Aircraft Type, 2026 to 2036
- Widebody aircraft
- Narrowbody aircraft
- Business jets
- Widebody aircraft
- Y-o-Y Growth Trend Analysis By Aircraft Type, 2021 to 2025
- Absolute $ Opportunity Analysis By Aircraft Type, 2026 to 2036
- Global Market Analysis and Forecast, By Delivery Model, 2021 to 2036
- Introduction / Key Findings
- Historical Market Size Value (USD Million) & Volume (Unit) Analysis By Delivery Model, 2021 to 2025
- Current and Future Market Size Value (USD Million) & Volume (Unit) Analysis and Forecast By Delivery Model, 2026 to 2036
- Line-fit bundles
- Retrofit kits
- Subscription updates
- Line-fit bundles
- Y-o-Y Growth Trend Analysis By Delivery Model, 2021 to 2025
- Absolute $ Opportunity Analysis By Delivery Model, 2026 to 2036
- Global Market Analysis and Forecast, By End User, 2021 to 2036
- Introduction / Key Findings
- Historical Market Size Value (USD Million) & Volume (Unit) Analysis By End User, 2021 to 2025
- Current and Future Market Size Value (USD Million) & Volume (Unit) Analysis and Forecast By End User, 2026 to 2036
- Full-service airlines
- Aircraft OEMs
- VIP operators
- MRO integrators
- Full-service airlines
- Y-o-Y Growth Trend Analysis By End User, 2021 to 2025
- Absolute $ Opportunity Analysis By End User, 2026 to 2036
- Global Market Analysis and Forecast, By Region, 2021 to 2036
- Introduction
- Historical Market Size Value (USD Million) & Volume (Unit) Analysis By Region, 2021 to 2025
- Current Market Size Value (USD Million) & Volume (Unit) Analysis and Forecast By Region, 2026 to 2036
- North America
- Latin America
- Western Europe
- Eastern Europe
- East Asia
- South Asia and Pacific
- Middle East & Africa
- Market Attractiveness Analysis By Region
- North America Market Analysis and Forecast, By Country, 2021 to 2036
- Historical Market Size Value (USD Million) & Volume (Unit) Trend Analysis By Market Taxonomy, 2021 to 2025
- Market Size Value (USD Million) & Volume (Unit) Forecast By Market Taxonomy, 2026 to 2036
- By Country
- USA
- Canada
- Mexico
- By Solution Type
- By Cabin Zone
- By Aircraft Type
- By Delivery Model
- By End User
- By Country
- Market Attractiveness Analysis
- By Country
- By Solution Type
- By Cabin Zone
- By Aircraft Type
- By Delivery Model
- By End User
- Key Takeaways
- Latin America Market Analysis and Forecast, By Country
- Historical Market Size Value (USD Million) & Volume (Unit) Trend Analysis By Market Taxonomy, 2021 to 2025
- Market Size Value (USD Million) & Volume (Unit) Forecast By Market Taxonomy, 2026 to 2036
- By Country
- Brazil
- Chile
- Rest of Latin America
- By Solution Type
- By Cabin Zone
- By Aircraft Type
- By Delivery Model
- By End User
- By Country
- Market Attractiveness Analysis
- By Country
- By Solution Type
- By Cabin Zone
- By Aircraft Type
- By Delivery Model
- By End User
- Key Takeaways
- Western Europe Market Analysis and Forecast, By Country
- Historical Market Size Value (USD Million) & Volume (Unit) Trend Analysis By Market Taxonomy, 2021 to 2025
- Market Size Value (USD Million) & Volume (Unit) Forecast By Market Taxonomy, 2026 to 2036
- By Country
- Germany
- UK
- Italy
- Spain
- France
- Nordic
- BENELUX
- Rest of Western Europe
- By Solution Type
- By Cabin Zone
- By Aircraft Type
- By Delivery Model
- By End User
- By Country
- Market Attractiveness Analysis
- By Country
- By Solution Type
- By Cabin Zone
- By Aircraft Type
- By Delivery Model
- By End User
- Key Takeaways
- Eastern Europe Market Analysis and Forecast, By Country
- Historical Market Size Value (USD Million) & Volume (Unit) Trend Analysis By Market Taxonomy, 2021 to 2025
- Market Size Value (USD Million) & Volume (Unit) Forecast By Market Taxonomy, 2026 to 2036
- By Country
- Russia
- Poland
- Hungary
- Balkan & Baltic
- Rest of Eastern Europe
- By Solution Type
- By Cabin Zone
- By Aircraft Type
- By Delivery Model
- By End User
- By Country
- Market Attractiveness Analysis
- By Country
- By Solution Type
- By Cabin Zone
- By Aircraft Type
- By Delivery Model
- By End User
- Key Takeaways
- East Asia Market Analysis and Forecast, By Country
- Historical Market Size Value (USD Million) & Volume (Unit) Trend Analysis By Market Taxonomy, 2021 to 2025
- Market Size Value (USD Million) & Volume (Unit) Forecast By Market Taxonomy, 2026 to 2036
- By Country
- China
- Japan
- South Korea
- By Solution Type
- By Cabin Zone
- By Aircraft Type
- By Delivery Model
- By End User
- By Country
- Market Attractiveness Analysis
- By Country
- By Solution Type
- By Cabin Zone
- By Aircraft Type
- By Delivery Model
- By End User
- Key Takeaways
- South Asia and Pacific Market Analysis and Forecast, By Country
- Historical Market Size Value (USD Million) & Volume (Unit) Trend Analysis By Market Taxonomy, 2021 to 2025
- Market Size Value (USD Million) & Volume (Unit) Forecast By Market Taxonomy, 2026 to 2036
- By Country
- India
- ASEAN
- Australia & New Zealand
- Rest of South Asia and Pacific
- By Solution Type
- By Cabin Zone
- By Aircraft Type
- By Delivery Model
- By End User
- By Country
- Market Attractiveness Analysis
- By Country
- By Solution Type
- By Cabin Zone
- By Aircraft Type
- By Delivery Model
- By End User
- Key Takeaways
- Middle East & Africa Market Analysis and Forecast, By Country
- Historical Market Size Value (USD Million) & Volume (Unit) Trend Analysis By Market Taxonomy, 2021 to 2025
- Market Size Value (USD Million) & Volume (Unit) Forecast By Market Taxonomy, 2026 to 2036
- By Country
- Kingdom of Saudi Arabia
- Other GCC Countries
- Türkiye
- South Africa
- Other African Union
- Rest of Middle East & Africa
- By Solution Type
- By Cabin Zone
- By Aircraft Type
- By Delivery Model
- By End User
- By Country
- Market Attractiveness Analysis
- By Country
- By Solution Type
- By Cabin Zone
- By Aircraft Type
- By Delivery Model
- By End User
- Key Takeaways
- Key Countries Market Analysis
- USA
- Pricing Analysis
- Market Share Analysis, 2025
- By Solution Type
- By Cabin Zone
- By Aircraft Type
- By Delivery Model
- By End User
- Canada
- Pricing Analysis
- Market Share Analysis, 2025
- By Solution Type
- By Cabin Zone
- By Aircraft Type
- By Delivery Model
- By End User
- Mexico
- Pricing Analysis
- Market Share Analysis, 2025
- By Solution Type
- By Cabin Zone
- By Aircraft Type
- By Delivery Model
- By End User
- Brazil
- Pricing Analysis
- Market Share Analysis, 2025
- By Solution Type
- By Cabin Zone
- By Aircraft Type
- By Delivery Model
- By End User
- Chile
- Pricing Analysis
- Market Share Analysis, 2025
- By Solution Type
- By Cabin Zone
- By Aircraft Type
- By Delivery Model
- By End User
- Germany
- Pricing Analysis
- Market Share Analysis, 2025
- By Solution Type
- By Cabin Zone
- By Aircraft Type
- By Delivery Model
- By End User
- UK
- Pricing Analysis
- Market Share Analysis, 2025
- By Solution Type
- By Cabin Zone
- By Aircraft Type
- By Delivery Model
- By End User
- Italy
- Pricing Analysis
- Market Share Analysis, 2025
- By Solution Type
- By Cabin Zone
- By Aircraft Type
- By Delivery Model
- By End User
- Spain
- Pricing Analysis
- Market Share Analysis, 2025
- By Solution Type
- By Cabin Zone
- By Aircraft Type
- By Delivery Model
- By End User
- France
- Pricing Analysis
- Market Share Analysis, 2025
- By Solution Type
- By Cabin Zone
- By Aircraft Type
- By Delivery Model
- By End User
- India
- Pricing Analysis
- Market Share Analysis, 2025
- By Solution Type
- By Cabin Zone
- By Aircraft Type
- By Delivery Model
- By End User
- ASEAN
- Pricing Analysis
- Market Share Analysis, 2025
- By Solution Type
- By Cabin Zone
- By Aircraft Type
- By Delivery Model
- By End User
- Australia & New Zealand
- Pricing Analysis
- Market Share Analysis, 2025
- By Solution Type
- By Cabin Zone
- By Aircraft Type
- By Delivery Model
- By End User
- China
- Pricing Analysis
- Market Share Analysis, 2025
- By Solution Type
- By Cabin Zone
- By Aircraft Type
- By Delivery Model
- By End User
- Japan
- Pricing Analysis
- Market Share Analysis, 2025
- By Solution Type
- By Cabin Zone
- By Aircraft Type
- By Delivery Model
- By End User
- South Korea
- Pricing Analysis
- Market Share Analysis, 2025
- By Solution Type
- By Cabin Zone
- By Aircraft Type
- By Delivery Model
- By End User
- Russia
- Pricing Analysis
- Market Share Analysis, 2025
- By Solution Type
- By Cabin Zone
- By Aircraft Type
- By Delivery Model
- By End User
- Poland
- Pricing Analysis
- Market Share Analysis, 2025
- By Solution Type
- By Cabin Zone
- By Aircraft Type
- By Delivery Model
- By End User
- Hungary
- Pricing Analysis
- Market Share Analysis, 2025
- By Solution Type
- By Cabin Zone
- By Aircraft Type
- By Delivery Model
- By End User
- Kingdom of Saudi Arabia
- Pricing Analysis
- Market Share Analysis, 2025
- By Solution Type
- By Cabin Zone
- By Aircraft Type
- By Delivery Model
- By End User
- Türkiye
- Pricing Analysis
- Market Share Analysis, 2025
- By Solution Type
- By Cabin Zone
- By Aircraft Type
- By Delivery Model
- By End User
- South Africa
- Pricing Analysis
- Market Share Analysis, 2025
- By Solution Type
- By Cabin Zone
- By Aircraft Type
- By Delivery Model
- By End User
- USA
- Market Structure Analysis
- Competition Dashboard
- Competition Benchmarking
- Market Share Analysis of Top Players
- By Regional
- By Solution Type
- By Cabin Zone
- By Aircraft Type
- By Delivery Model
- By End User
- Emerging Startups
- Innovation Benchmarking
- Competition Analysis
- Competition Deep Dive
- Panasonic Avionics Corporation
- Overview
- Product Portfolio
- Profitability by Market Segments (Product/Region/Sales Channel)
- Sales Footprint
- Strategy Overview
- Marketing Strategy
- Product Strategy
- Channel Strategy
- Thales Group
- Safran Passenger Innovations
- Collins Aerospace
- Lufthansa Technik
- Diehl Aviation
- Ultra Precision Control Systems
- Devialet
- Moodsonic
- Bose Professional
- Panasonic Avionics Corporation
- Case Studies
- Success Stories
- Recent Developments
- Competition Deep Dive
- Assumptions & Acronyms Used


