Scar and Stretch Mark Treatment Market Size and Share Forecast Outlook 2025 to 2035

A valuation of USD 4,702.1 Million is anticipated for the scar and stretch mark treatment market in 2025, which is projected to reach USD 10,802.1 Million by 2035. This trajectory indicates an addition of over USD 6,100 Million in value during the assessment period, reflecting a robust CAGR of 8.7%.
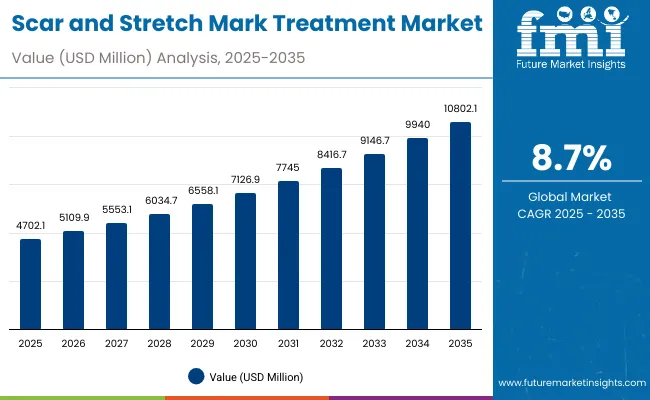
Quick Stats for Scar and Stretch Mark Treatment Market

  • Scar and Stretch Mark Treatment Market Value (2025): USD 4,702.1 Million
  • Scar and Stretch Mark Treatment Market Forecast Value (2035): USD 10,802.1 Million
  • Scar and Stretch Mark Treatment Market Forecast CAGR: 8.7%
  • Leading Segment in Scar and Stretch Mark Treatment Market in 2025: Stretch-mark fading (54.0%)
  • Key Growth Regions in Scar and Stretch Mark Treatment Market: North America, Asia-Pacific, Europe
  • Top Key Players in Scar and Stretch Mark Treatment Market: Bio-Oil, Palmer’s, Mederma, Stratpharma, Mustela, Dermatix, Rejuvaskin, Clarins, Cicatricure, Eucerin

Scar And Stretch Mark Treatment Market

Scar and Stretch Mark Treatment Market Key Takeaways

Metric Value
Scar And Stretch Mark Treatment Market Estimated Value in (2025E) USD 4,702.1 million
Scar And Stretch Mark Treatment Market Forecast Value in (2035F) USD 10,802.1 million
Forecast CAGR (2025 to 2035) 8.70%

Growth is expected to more than double over the decade, driven by increasing adoption of dermatology-supported regimens, wider accessibility of topical solutions, and digital engagement across consumer channels.

Between 2025 and 2030, market expansion from USD 4,702.1 Million to USD 7,126.9 Million is projected, representing an incremental gain of USD 2,424.8 Million, which equates to nearly 40% of the total growth expected over the decade. This early phase is anticipated to benefit from heightened consumer awareness, particularly among women in post-pregnancy care, and expanding product penetration across pharmacies and digital platforms. E-commerce channels are likely to accelerate adoption, capturing a 57.0% share in 2025 and setting the stage for strong online-led momentum.

The second half of the forecast period, from 2030 to 2035, is estimated to contribute USD 3,675.2 Million, accounting for the majority of cumulative growth. During this period, market size is expected to climb from USD 7,126.9 Million to USD 10,802.1 Million, reflecting stronger participation from emerging economies such as India and China, where CAGR levels exceed the global average. Stretch-mark fading applications are anticipated to remain dominant with a 54.0% share in 2025, underpinned by rising adolescent and postpartum demand patterns, while scar reduction and repair-focused regimens will continue to build relevance through dermatologist endorsements and clinically validated claims.

From 2020 to 2024, steady growth in the scar and stretch mark treatment space was recorded, supported by growing awareness of dermatology-guided regimens. By 2025, demand is projected to reach USD 4,702.1 Million, with value expected to more than double by 2035. Market performance is anticipated to be anchored by stretch-mark fading applications and digital-led distribution, as e-commerce captures 57.0% of share in 2025. Competitive activity is projected to intensify, with incumbents defending their positions through dermatologist-tested claims and clinical validation, while emerging players are expected to leverage digital engagement, bundled regimens, and localized postpartum care solutions. Recurring revenue opportunities through subscriptions, replenishment cycles, and personalized digital consultations are forecast to redefine growth dynamics. Advantage is expected to shift toward those capable of blending scientific credibility with consumer-centric digital ecosystems, enabling a sustained leadership position in an increasingly competitive landscape.

Why the Scar and Stretch Mark Treatment Market is growing?

Growth in the scar and stretch mark treatment market is being fueled by rising consumer awareness of aesthetic well-being and increasing acceptance of dermatology-guided regimens. Demand is being reinforced by postpartum care routines, adolescent stretch-mark concerns, and the need for visible skin repair solutions. Expansion of e-commerce platforms is enabling easier access, while dermatologist-tested and clinically validated claims are strengthening consumer trust. Emerging economies such as India and China are contributing significantly as higher birth rates, growing disposable incomes, and digital engagement platforms are accelerating adoption. Technological advances in formulations, including natural and pregnancy-safe variants, are also widening appeal. Pharmaceutical and mass retail channels are expected to remain relevant, though digital-first distribution is forecast to dominate due to convenience and subscription-based replenishment models. Overall, long-term growth is being shaped by lifestyle-driven demand, clinical credibility, and expanding regional penetration, ensuring a sustained trajectory for the decade ahead.

Segmental Analysis

The scar and stretch mark treatment market is structured across multiple dimensions that capture consumer demand patterns and clinical positioning. Segmentation by treatment type includes topical creams and serums, oils and butters, silicone gels, and clinical procedure support, reflecting the diversity of product formats available to address varying skin concerns. Functional segmentation covers stretch mark fading, scar reduction, hydration, and elasticity improvement, emphasizing both targeted interventions and broader skin health benefits. Distribution channels are divided among pharmacies and drugstores, e-commerce platforms, dermatology clinics, and mass retail, highlighting the transition toward digital-first ecosystems while preserving traditional points of trust. Claims segmentation features dermatologist-tested, fragrance-free, natural/organic, and pregnancy-safe categories, which reinforce safety and credibility as decisive purchase drivers. End-user segmentation spans women post-pregnancy, adolescents experiencing growth-related stretch marks, and men seeking skin-care solutions, ensuring that adoption is analyzed across diverse demographics. Regionally, coverage extends across North America, Europe, Asia-Pacific, Latin America, and the Middle East & Africa, with emerging economies such as China and India positioned to drive accelerated growth. This layered segmentation provides clarity on both current market dynamics and future opportunities for expansion.
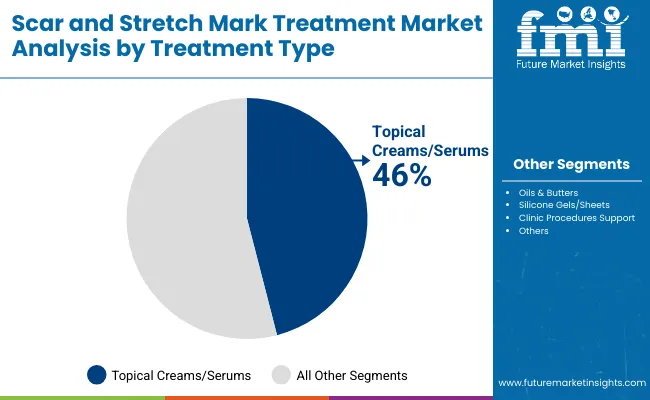
Insights into the Treatment Type Segment with Others Leading in Market Share

Scar And Stretch Mark Treatment Market By Treatemnet Type
Treatment Type Market Value Share, 2025
Topical creams/serums 46%
Others 54.0%

The treatment type segment is projected to be led by the category defined as others, with a share of 54.0% in 2025, equivalent to USD 2539.13 Million. This dominance is expected to be supported by broader consumer acceptance of multi-formulation regimens that go beyond traditional topical creams. Greater demand for diversified treatment solutions, including oils, butters, and alternative formats, is anticipated to support continued expansion. Topical creams and serums, accounting for 46% share in 2025, will remain relevant due to their ease of use and widespread distribution, but long-term growth is expected to be more fragmented across innovative categories. The treatment landscape is forecast to evolve as clinical claims and lifestyle preferences increasingly dictate adoption patterns.
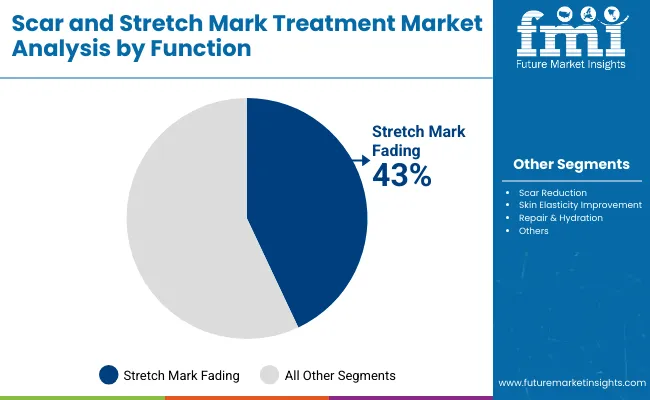
Insights into the Function Segment with Others Holding Majority Share

Scar And Stretch Mark Treatment Market By Function
Function Market Value Share, 2025
Stretch mark fading 43%
Others 57.0%

In the function-based segmentation, the others category is expected to account for 57.0% of total market value in 2025, reaching USD 2680.20 Million. Broader positioning across skin repair, hydration, and elasticity improvements is anticipated to fuel this outcome, aligning with demand for comprehensive skincare benefits. Stretch mark fading is projected to contribute 43% share, valued at USD 2021.90 Million, reflecting consistent demand from postpartum women and adolescents. However, increasing preference for multi-purpose formulations addressing overall skin health is projected to strengthen the dominance of the broader function category. Continued clinical validation and evolving claims are expected to enhance consumer trust and expand adoption within this segment.
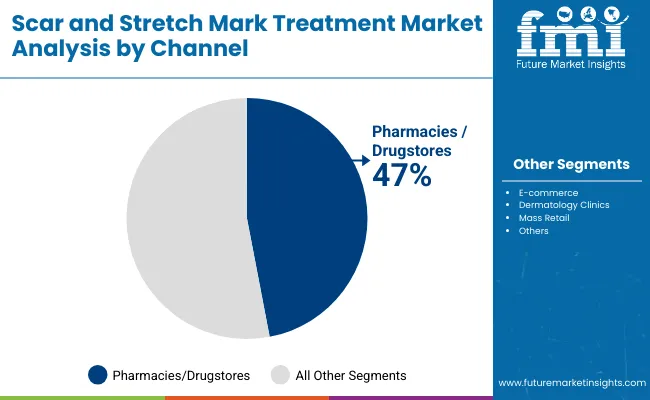
Insights into the Channel Segment with Others Maintaining Leadership

Scar And Stretch Mark Treatment Market By Channel
Channel Market Value Share, 2025
Pharmacies/drugstores 47%
Others 53.0%

The channel segment is forecast to be dominated by others, representing 53.0% of market share in 2025 with a sales value of USD 2492.11 Million. This dominance reflects the rapid rise of e-commerce platforms, dermatology clinics, and mass retail formats that are expanding consumer access. Pharmacies and drugstores, holding 47% share valued at USD 2209.99 Million, will continue to play an important role by providing professional guidance and trusted access points for first-time buyers. However, convenience-driven digital adoption, coupled with subscription and replenishment models, is projected to sustain the leadership of alternative channels. The distribution structure is expected to shift further toward digitally enabled ecosystems, amplifying the relevance of oMillionichannel strategies in driving long-term growth.

What are the Drivers, Restraints, and Key Trends of the Scar and Stretch Mark Treatment Market?

The market is being shaped by evolving consumer expectations and clinical influences, even as competitive pressures and distributional realignments add complexity to long-term growth pathways across regions and demographic groups.

Clinical Validation and Dermatologist Endorsements

Market expansion is being accelerated through stronger reliance on evidence-based positioning. Products supported by dermatologist-tested claims and clinical trial validation are expected to secure higher adoption, as consumers increasingly seek proof of efficacy before committing to long-term regimens. This shift reflects a broader trend where trust is being derived not solely from brand heritage but from measurable outcomes and transparent clinical data. The competitive edge is projected to tilt toward companies that can combine safety assurances with credible timelines for visible results. With pregnancy-safe and adolescent-friendly formulations gaining traction, endorsement by healthcare practitioners is anticipated to serve as a critical bridge between consumer curiosity and purchase commitment, reinforcing market legitimacy and scaling adoption across geographies.

Saturation of Traditional Distribution Channels

Growth is being limited by reliance on conventional pharmacy and retail networks that are becoming increasingly crowded with overlapping offerings. While these outlets provide accessibility, differentiation is being diluted, and consumer loyalty is fragmenting across a multitude of similar claims. Pricing pressures are also intensifying, with established players competing against digital-first entrants offering bundled regimens at competitive rates. This structural saturation is forecast to slow incremental growth in physical retail, forcing stakeholders to reallocate investments toward digital ecosystems where consumer decision-making is influenced by reviews, influencer credibility, and subscription-driven retention models. Unless distributional innovation is prioritized, incumbents risk eroding margins while failing to capture emerging demand channels.
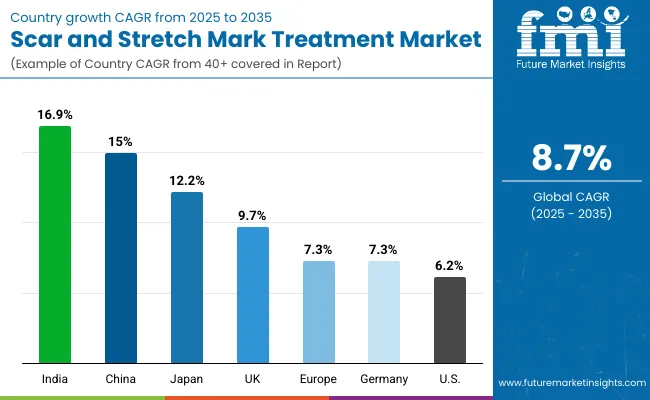
Analysis of Scar and Stretch Mark Treatment Market By Key Countries

Scar And Stretch Mark Treatment Market By Country

Country CAGR
China 15.0%
USA 6.2%
India 16.9%
UK 9.7%
Germany 7.3%
Japan 12.2%

The global scar and stretch mark treatment market reveals distinct growth patterns across major economies, shaped by demographic drivers, cultural influences, and access to dermatology-led solutions. India is expected to post the strongest trajectory with a CAGR of 16.9% between 2025 and 2035, underpinned by high birth rates, rapid urbanization, and expanding digital penetration that brings postpartum and adolescent skincare routines into mainstream adoption. China follows with a projected CAGR of 15.0%, driven by rising disposable incomes, increased awareness of dermatology-endorsed regimens, and the rapid shift to e-commerce channels that amplify product reach.

Japan, with an estimated CAGR of 12.2%, is expected to maintain steady expansion through premium positioning, as demand for clinically validated and anti-aging-oriented solutions gains traction among health-conscious consumers. The UK and Germany show moderate growth at 9.7% and 7.3% respectively, where mature retail networks and regulatory scrutiny shape brand differentiation, particularly for dermatologist-tested and natural formulations. The USA market, at a projected CAGR of 6.2%, reflects slower expansion due to market maturity, though innovation in claims, oMillionichannel integration, and bundled regimen solutions is expected to sustain relevance. Collectively, Asia-Pacific is positioned as the fastest-growing region, reinforcing its role as the principal engine of long-term market expansion.
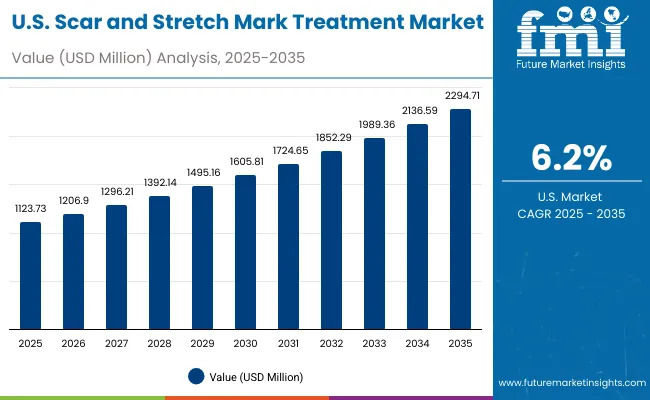
Sales Outlook for Scar and Stretch Mark Treatment in the United States

United States Scar And Stretch Mark Treatment Market

Year USA Scar And Stretch Mark Treatment Market (USD Million)
2025 1123.73
2026 1206.90
2027 1296.21
2028 1392.14
2029 1495.16
2030 1605.81
2031 1724.65
2032 1852.29
2033 1989.36
2034 2136.59
2035 2294.71

The scar and stretch mark treatment market in the United States is projected to grow at a CAGR of 7.0% between 2025 and 2035, reaching USD 2294.71 Million by the end of the period from USD 1123.73 Million in 2025. This progression reflects consistent year-on-year gains, supported by increasing prioritization of aesthetic dermatology and expanding accessibility through retail and digital platforms. Adoption is anticipated to be driven by postpartum care solutions, adolescent skincare demand, and growing reliance on clinically validated, dermatologist-tested claims. The role of oMillionichannel distribution is projected to intensify, with pharmacies maintaining credibility for first-time purchases and e-commerce building momentum through subscriptions and personalized product bundles.

  • Post-pregnancy and adolescent segments are projected to sustain long-term demand, supported by clinical awareness campaigns.
  • Digital-first distribution and subscription-driven replenishment models are expected to reinforce market expansion across the decade.
  • Clinically validated formulations and dermatologist endorsements are forecast to serve as key differentiators, strengthening consumer trust and purchase intent.

Growth and Expansion Outlook for Scar and Stretch Mark Treatment Market in the United Kingdom

The scar and stretch mark treatment market in the United Kingdom is projected to grow at a CAGR of 9.7% between 2025 and 2035, reflecting solid momentum supported by clinical credibility and consumer-driven adoption. The market is expected to benefit from heightened awareness of postpartum care and increasing preference for dermatologist-tested solutions. Regulatory scrutiny over product claims is anticipated to shape market positioning, making transparency in efficacy and safety pivotal to consumer trust. Pharmacies are projected to remain strong distribution channels, while e-commerce expansion is expected to capture digitally engaged younger demographics.

  • Dermatologist-tested and clinically validated products are anticipated to gain stronger traction
  • Pharmacies are expected to retain relevance for first-time buyers, while digital platforms expand reach.
  • Transparency in claims and compliance with EU-level regulations are forecast to shape competitive positioning.
  • Premium skincare trends are expected to reinforce growth in scar reduction and elasticity improvement solutions.

Growth and Expansion Outlook for Scar and Stretch Mark Treatment Market in India

The scar and stretch mark treatment market in India is projected to expand at a CAGR of 16.9% between 2025 and 2035, making it the fastest-growing among key global markets. This trajectory is expected to be powered by high birth rates, increasing urbanization, and expanding digital access across metropolitan and semi-urban regions. Adoption is likely to be enhanced by growing awareness of postpartum regimens, alongside rising interest in natural and pregnancy-safe formulations. Market expansion is projected to be supported by e-commerce penetration, which is rapidly bridging gaps in product availability and consumer education.

  • Postpartum care and adolescent segments are expected to drive significant demand
  • Natural and pregnancy-safe product lines are forecast to capture a larger consumer base.
  • E-commerce and digital platforms are anticipated to dominate distribution channels.
  • Rising disposable incomes and urban lifestyle shifts are expected to sustain long-term growth momentum.

Sales Outlook for Scar and Stretch Mark Treatment in China

The scar and stretch mark treatment market in China is projected to advance at a CAGR of 15.0% between 2025 and 2035, driven by demographic scale, rising incomes, and rapid digital integration. E-commerce ecosystems are expected to dominate adoption, with subscription and bundled regimen models gaining traction among digitally engaged consumers. Postpartum and adolescent skincare routines are likely to be normalized within mainstream beauty and wellness practices, further enhancing market penetration. International brands and local challengers are anticipated to compete aggressively through claim-based differentiation, while premium positioning with dermatologist validation is expected to resonate with aspirational buyers.
  • E-commerce ecosystems are projected to consolidate leadership in distribution.
  • Postpartum and adolescent skincare routines are expected to anchor sustained demand
  • Dermatologist endorsements and clinical claims are forecast to differentiate premium offerings.
  • Subscription-based and bundled digital regimens are anticipated to secure stronger consumer loyalty.

In-depth Analysis of Scar and Stretch Mark Treatment in Germany

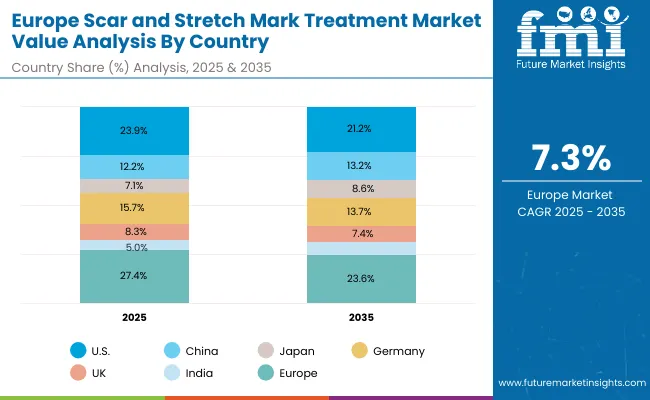
Germany Scar And Stretch Mark Treatment Market

Country 2025
USA 23.9%
China 12.2%
Japan 7.1%
Germany 15.7%
UK 8.3%
India 5.0%
Country 2035
USA 21.2%
China 13.2%
Japan 8.6%
Germany 13.7%
UK 7.4%
India 6.1%

The scar and stretch mark treatment market in Germany is forecast to grow at a CAGR of 7.3% between 2025 and 2035, reflecting steady but moderate expansion in a mature European environment. Demand is expected to be anchored by clinical rigor, regulatory oversight, and consumer preference for dermatologist-recommended formulations. Pharmacies are anticipated to remain dominant as trust channels, while e-commerce expansion provides incremental access for digitally engaged consumers. Growth is projected to be slower compared to emerging economies, though premium positioning and sustainable formulations are expected to secure strong traction among health-conscious buyers.
  • Pharmacies are expected to remain the central distribution channel, backed by consumer trust
  • Regulatory compliance and clinical validation are anticipated to drive competitive differentiation
  • Sustainable and natural formulations are projected to gain share among health-conscious demographics
  • Growth momentum is expected to rely on premiumization rather than volume-led expansion.

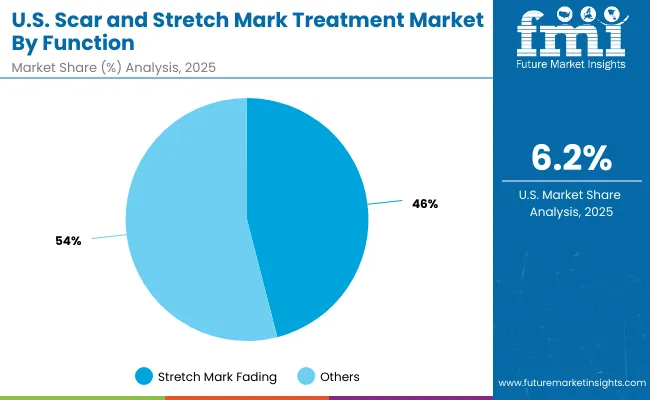
Growth Outlook for Scar and Stretch Mark Treatment Market in USA

Usa Scar And Stretch Mark Treatment Market

Segment Market Value Share, 2025
Stretch mark fading 46%
Others 54.0%

The scar and stretch mark treatment market in the United States is projected at USD 1123.73 Million in 2025. Stretch mark fading contributes 46%, equivalent to USD 516.92 Million, while other functions collectively account for 54.0%, valued at USD 606.82 Million. The marginal dominance of broader functions highlights a market orientation toward comprehensive skin improvement regimens rather than narrowly targeted outcomes. This balance reflects evolving consumer expectations for multi-functional benefits such as hydration, elasticity repair, and overall skin health. Rising demand for pregnancy-safe and dermatologist-tested solutions is expected to enhance adoption across both categories. Over the next decade, differentiation is anticipated to rely on clinical validation, subscription-based replenishment models, and oMillionichannel engagement that increases regimen adherence.
  • Market in the USA holds a share of USD 1123.73 Million in 2025
  • Broader functions lead stretch mark fading slightly at 54.0% vs 46%.
  • Adoption is supported by clinical credibility and expanding postpartum and adolescent care regimens.
  • Integrated solutions combining repair, hydration, and fading benefits are expected to define long-term positioning.

Opportunity Analysis of China Scar and Stretch Mark Treatment Market

China Scar And Stretch Mark Treatment Market

Segment Market Value Share, 2025
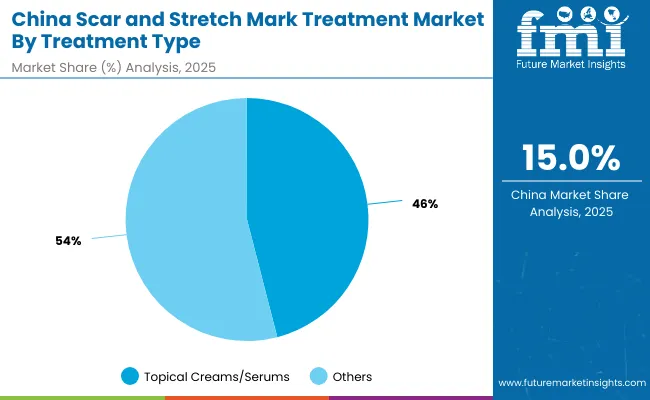
Topical creams/serums 46%
Others 54.0%

The scar and stretch mark treatment market in China is projected at USD 574.35 Million in 2025. Within this, topical creams and serums contribute 46%, valued at USD 264.20 Million, while other treatment types collectively dominate with 54.0%, equivalent to USD 310.15 Million. This distribution indicates a growing consumer preference for diversified formats such as oils, butters, and advanced dermatology-led alternatives beyond conventional topicals. Demand is expected to be reinforced by increasing postpartum care awareness, adolescent stretch-mark management, and broader adoption of multi-functional skincare regimens. Expanding e-commerce ecosystems in China are forecast to amplify accessibility, while premium product positioning backed by clinical claims is likely to enhance trust and accelerate uptake.
  • Market in China is valued at USD 574.35 Million in 2025.
  • Broader treatment types lead topical creams and serums with 54.0% vs 46%
  • Rising adoption is supported by postpartum and adolescent-focused skincare routines.
  • E-commerce expansion and premium positioning are anticipated to drive long-term growth.

Competitive Landscape of Scar and Stretch Mark Treatment Market

Scar And Stretch Mark Treatment Market By Company

Company Global Value Share 2025
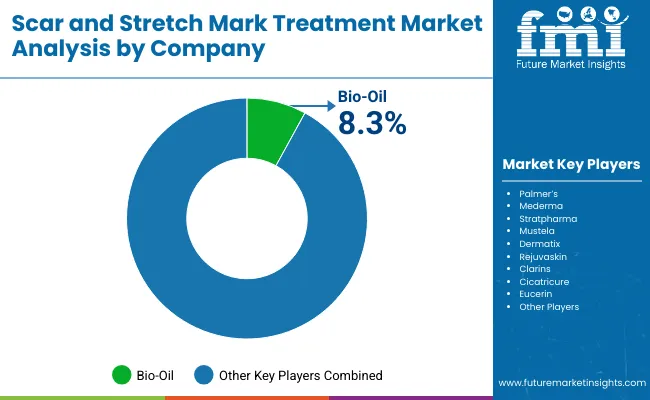
Bio-Oil 8.3%
Others 91.7%

The scar and stretch mark treatment market is moderately fragmented, with global leaders, regional specialists, and emerging digital-first players competing across diverse consumer groups. Bio-Oil remains the dominant player globally, holding an estimated 8.3% value share in 2025, making it the largest single brand in the category. Its leadership is supported by strong brand equity, dermatologist endorsements, and consistent presence across both pharmacy and e-commerce channels.

Mid-sized competitors such as Palmer’s, Mederma, and Mustela are expected to play significant roles through differentiated positioning, including natural formulations, pregnancy-safe claims, and targeted regimens for adolescent or postpartum users. Dermatix, Rejuvaskin, Clarins, Cicatricure, and Eucerin contribute further to competitive intensity, each building traction in regional markets through claim-specific product lines and trusted dermatology associations.

Specialist providers are increasingly leveraging digital commerce, influencer-driven marketing, and subscription bundles to scale rapidly, even without dominant global shares. Competitive advantage is shifting away from single-product formats toward multi-functional regimens that combine hydration, elasticity repair, and scar reduction in a single solution.

Competitive differentiation is anticipated to rely heavily on clinical validation, localized marketing strategies, and oMillionichannel integration. While Bio-Oil is projected to maintain leadership, growth from challengers is expected to accelerate through digital-first strategies and bundled offerings.

Key Developments in Scar and Stretch Mark Treatment Market

  • In April 2025, a market report by Research And Markets revealed that silicone-based products and treatments for atrophic scars were projected to lead global scar management efforts by 2035, indicating that clinical credibility and ease of use will be central to treatment formulation strategies.
  • Also in March 2025, at the American Academy of Dermatology (AAD) meeting, trial design innovations were emphasized, particularly greater specificity in patient stratification, biomarker-driven endpoints, and inclusion of adolescent and postpartum populations signifying that future products will be increasingly tailored and evidence-led.

Scope of the Report

Item Value
Quantitative Units USD 4,702.1 Million (2025) - USD 10,802.1 Million (2035)
Treatment Type Topical creams/serums, Oils & butters, Silicone gels/sheets, Clinical procedure support
Function Stretch mark fading, Scar reduction, Skin elasticity improvement, Repair & hydration
Channel Pharmacies/drugstores, E-commerce, Dermatology clinics, Mass retail
Claim Dermatologist-tested, Fragrance-free, Natural/organic, Pregnancy-safe
End User Women (post-pregnancy), Men, Adolescents (growth stretch marks)
Regions Covered North America, Europe, Asia-Pacific, Latin America, Middle East & Africa
Countries Covered United States, China, India, United Kingdom, Germany, Japan
Key Companies Profiled Bio-Oil, Palmer’s, Mederma, Stratpharma, Mustela, Dermatix, Rejuvaskin, Clarins, Cicatricure, Eucerin
Additional Attributes Dollar sales by treatment type, channel, and claims; adoption trends in postpartum care and adolescent skincare; shift toward e-commerce and subscription models; clinical validation and dermatologist endorsements; premium positioning in Japan and Europe; high growth in India and China; fragmentation with Bio-Oil leading global share (8.3%).

Key Segments

By Treatment Type:

  • Topical creams/serums
  • Oils & butters
  • Silicone gels/sheets
  • Clinic procedures support

By Function:

  • Scar reduction
  • Stretch mark fading
  • Skin elasticity improvement
  • Repair & hydration

By Channel:

  • Pharmacies/drugstores
  • E-commerce
  • Dermatology clinics
  • Mass retail

By Claim:

  • Dermatologist-tested
  • Fragrance-free
  • Natural/organic
  • Pregnancy-safe

By End User:

  • Women (post-pregnancy)
  • Men
  • Adolescents (growth stretch marks)

By Region:

  • North America
  • Latin America
  • Europe
  • East Asia
  • South Asia & Pacific
  • Middle East and Africa

Table of Content

  1. Executive Summary
    • Global Market Outlook
    • Demand-side Trends
    • Supply-side Trends
    • Technology Roadmap Analysis
    • Analysis and Recommendations
  2. Market Overview
    • Market Coverage / Taxonomy
    • Market Definition / Scope / Limitations
  3. Market Background
    • Market Dynamics
      • Drivers
      • Restraints
      • Opportunity
      • Trends
    • Scenario Forecast
      • Demand in Optimistic Scenario
      • Demand in Likely Scenario
      • Demand in Conservative Scenario
    • Opportunity Map Analysis
    • Product Life Cycle Analysis
    • Supply Chain Analysis
      • Supply Side Participants and their Roles
        • Producers
        • Mid-Level Participants (Traders/ Agents/ Brokers)
        • Wholesalers and Distributors
      • Value Added and Value Created at Node in the Supply Chain
      • List of Raw Material Suppliers
      • List of Existing and Potential Buyer’s
    • Investment Feasibility Matrix
    • Value Chain Analysis
      • Profit Margin Analysis
      • Wholesalers and Distributors
      • Retailers
    • PESTLE and Porter’s Analysis
    • Regulatory Landscape
      • By Key Regions
      • By Key Countries
    • Regional Parent Market Outlook
    • Production and Consumption Statistics
    • Import and Export Statistics
  4. Global Market Analysis 2020 to 2024 and Forecast, 2025 to 2035
    • Historical Market Size Value (USD Million) & Volume (Units) Analysis, 2020 to 2024
    • Current and Future Market Size Value (USD Million) & Volume (Units) Projections, 2025 to 2035
      • Y-o-Y Growth Trend Analysis
      • Absolute $ Opportunity Analysis
  5. Global Market Analysis 2020 to 2024 and Forecast 2025 to 2035, By  Treatment Type
    • Introduction / Key Findings
    • Historical Market Size Value (USD Million) & Volume (Units) Analysis By  Treatment Type, 2020 to 2024
    • Current and Future Market Size Value (USD Million) & Volume (Units) Analysis and Forecast By  Treatment Type, 2025 to 2035
      • Topical creams/serums
      • Oils & butters
      • Silicone gels/sheets
      • Clinic procedures support
    • Y-o-Y Growth Trend Analysis By  Treatment Type, 2020 to 2024
    • Absolute $ Opportunity Analysis By  Treatment Type, 2025 to 2035
  6. Global Market Analysis 2020 to 2024 and Forecast 2025 to 2035, By  Function
    • Introduction / Key Findings
    • Historical Market Size Value (USD Million) & Volume (Units) Analysis By  Function, 2020 to 2024
    • Current and Future Market Size Value (USD Million) & Volume (Units) Analysis and Forecast By  Function, 2025 to 2035
      • Scar reduction
      • Stretch mark fading
      • Skin elasticity improvement
      • Repair & hydration
    • Y-o-Y Growth Trend Analysis By  Function, 2020 to 2024
    • Absolute $ Opportunity Analysis By  Function, 2025 to 2035
  7. Global Market Analysis 2020 to 2024 and Forecast 2025 to 2035, By  Channel
    • Introduction / Key Findings
    • Historical Market Size Value (USD Million) & Volume (Units) Analysis By  Channel, 2020 to 2024
    • Current and Future Market Size Value (USD Million) & Volume (Units) Analysis and Forecast By  Channel, 2025 to 2035
      • Pharmacies/drugstores
      • E-commerce
      • Dermatology clinics
      • Mass retail
    • Y-o-Y Growth Trend Analysis By  Channel, 2020 to 2024
    • Absolute $ Opportunity Analysis By  Channel, 2025 to 2035
  8. Global Market Analysis 2020 to 2024 and Forecast 2025 to 2035, By  Claim
    • Introduction / Key Findings
    • Historical Market Size Value (USD Million) & Volume (Units) Analysis By  Claim, 2020 to 2024
    • Current and Future Market Size Value (USD Million) & Volume (Units) Analysis and Forecast By  Claim, 2025 to 2035
      • Dermatologist-tested
      • Fragrance-free
      • Natural/organic
      • Pregnancy-safe
    • Y-o-Y Growth Trend Analysis By  Claim, 2020 to 2024
    • Absolute $ Opportunity Analysis By  Claim, 2025 to 2035
  9. Global Market Analysis 2020 to 2024 and Forecast 2025 to 2035, By  End User
    • Introduction / Key Findings
    • Historical Market Size Value (USD Million) & Volume (Units) Analysis By  End User, 2020 to 2024
    • Current and Future Market Size Value (USD Million) & Volume (Units) Analysis and Forecast By  End User, 2025 to 2035
      • Women (post-pregnancy)
      • Men
      • Adolescents (growth stretch marks)
    • Y-o-Y Growth Trend Analysis By  End User, 2020 to 2024
    • Absolute $ Opportunity Analysis By  End User, 2025 to 2035
  10. Global Market Analysis 2020 to 2024 and Forecast 2025 to 2035, By Region
    • Introduction
    • Historical Market Size Value (USD Million) & Volume (Units) Analysis By Region, 2020 to 2024
    • Current Market Size Value (USD Million) & Volume (Units) Analysis and Forecast By Region, 2025 to 2035
      • North America
      • Latin America
      • Europe
      • East Asia
      • South Asia & Pacific
      • Middle East and Africa
    • Market Attractiveness Analysis By Region
  11. North America Market Analysis 2020 to 2024 and Forecast 2025 to 2035, By Country
    • Historical Market Size Value (USD Million) & Volume (Units) Trend Analysis By Market Taxonomy, 2020 to 2024
    • Market Size Value (USD Million) & Volume (Units) Forecast By Market Taxonomy, 2025 to 2035
      • By Country
        • U.S.
        • Canada
      • By  Treatment Type
      • By  Function
      • By  Channel
      • By  Claim
      • By  End User
    • Market Attractiveness Analysis
      • By Country
      • By  Treatment Type
      • By  Function
      • By  Channel
      • By  Claim
      • By  End User
    • Key Takeaways
  12. Latin America Market Analysis 2020 to 2024 and Forecast 2025 to 2035, By Country
    • Historical Market Size Value (USD Million) & Volume (Units) Trend Analysis By Market Taxonomy, 2020 to 2024
    • Market Size Value (USD Million) & Volume (Units) Forecast By Market Taxonomy, 2025 to 2035
      • By Country
        • Brazil
        • Mexico
        • Colombia
        • Rest of Latin America
      • By  Treatment Type
      • By  Function
      • By  Channel
      • By  Claim
      • By  End User
    • Market Attractiveness Analysis
      • By Country
      • By  Treatment Type
      • By  Function
      • By  Channel
      • By  Claim
      • By  End User
    • Key Takeaways
  13. Europe Market Analysis 2020 to 2024 and Forecast 2025 to 2035, By Country
    • Historical Market Size Value (USD Million) & Volume (Units) Trend Analysis By Market Taxonomy, 2020 to 2024
    • Market Size Value (USD Million) & Volume (Units) Forecast By Market Taxonomy, 2025 to 2035
      • By Country
        • Germany
        • U.K.
        • France
        • Italy
        • Spain
        • Belgium
        • Netherlands
        • Nordic
        • Switzerland
        • Russia
        • Poland
        • Rest of Europe
      • By  Treatment Type
      • By  Function
      • By  Channel
      • By  Claim
      • By  End User
    • Market Attractiveness Analysis
      • By Country
      • By  Treatment Type
      • By  Function
      • By  Channel
      • By  Claim
      • By  End User
    • Key Takeaways
  14. East Asia Market Analysis 2020 to 2024 and Forecast 2025 to 2035, By Country
    • Historical Market Size Value (USD Million) & Volume (Units) Trend Analysis By Market Taxonomy, 2020 to 2024
    • Market Size Value (USD Million) & Volume (Units) Forecast By Market Taxonomy, 2025 to 2035
      • By Country
        • China
        • Japan
        • South Korea
      • By  Treatment Type
      • By  Function
      • By  Channel
      • By  Claim
      • By  End User
    • Market Attractiveness Analysis
      • By Country
      • By  Treatment Type
      • By  Function
      • By  Channel
      • By  Claim
      • By  End User
    • Key Takeaways
  15. South Asia & Pacific Market Analysis 2020 to 2024 and Forecast 2025 to 2035, By Country
    • Historical Market Size Value (USD Million) & Volume (Units) Trend Analysis By Market Taxonomy, 2020 to 2024
    • Market Size Value (USD Million) & Volume (Units) Forecast By Market Taxonomy, 2025 to 2035
      • By Country
        • India
        • Thailand
        • Malaysia
        • Indonesia
        • Singapore
        • Vietnam
        • Australia
        • New Zealand
        • Rest of South Asia
      • By  Treatment Type
      • By  Function
      • By  Channel
      • By  Claim
      • By  End User
    • Market Attractiveness Analysis
      • By Country
      • By  Treatment Type
      • By  Function
      • By  Channel
      • By  Claim
      • By  End User
    • Key Takeaways
  16. Middle East and Africa Market Analysis 2020 to 2024 and Forecast 2025 to 2035, By Country
    • Historical Market Size Value (USD Million) & Volume (Units) Trend Analysis By Market Taxonomy, 2020 to 2024
    • Market Size Value (USD Million) & Volume (Units) Forecast By Market Taxonomy, 2025 to 2035
      • By Country
        • Turkey
        • UAE
        • Saudi Arabia
        • Israel
        • Other GCC Countries
        • North Africa
        • South Africa
      • By  Treatment Type
      • By  Function
      • By  Channel
      • By  Claim
      • By  End User
    • Market Attractiveness Analysis
      • By Country
      • By  Treatment Type
      • By  Function
      • By  Channel
      • By  Claim
      • By  End User
    • Key Takeaways
  17. Key Countries Market Analysis
    • U.S.
      • Pricing Analysis
      • Market Share Analysis, 2024
        • By  Treatment Type
        • By  Function
        • By  Channel
        • By  Claim
        • By  End User
    • Canada
      • Pricing Analysis
      • Market Share Analysis, 2024
        • By  Treatment Type
        • By  Function
        • By  Channel
        • By  Claim
        • By  End User
    • Brazil
      • Pricing Analysis
      • Market Share Analysis, 2024
        • By  Treatment Type
        • By  Function
        • By  Channel
        • By  Claim
        • By  End User
    • Mexico
      • Pricing Analysis
      • Market Share Analysis, 2024
        • By  Treatment Type
        • By  Function
        • By  Channel
        • By  Claim
        • By  End User
    • Colombia
      • Pricing Analysis
      • Market Share Analysis, 2024
        • By  Treatment Type
        • By  Function
        • By  Channel
        • By  Claim
        • By  End User
    • Germany
      • Pricing Analysis
      • Market Share Analysis, 2024
        • By  Treatment Type
        • By  Function
        • By  Channel
        • By  Claim
        • By  End User
    • U.K.
      • Pricing Analysis
      • Market Share Analysis, 2024
        • By  Treatment Type
        • By  Function
        • By  Channel
        • By  Claim
        • By  End User
    • France
      • Pricing Analysis
      • Market Share Analysis, 2024
        • By  Treatment Type
        • By  Function
        • By  Channel
        • By  Claim
        • By  End User
    • Italy
      • Pricing Analysis
      • Market Share Analysis, 2024
        • By  Treatment Type
        • By  Function
        • By  Channel
        • By  Claim
        • By  End User
    • Spain
      • Pricing Analysis
      • Market Share Analysis, 2024
        • By  Treatment Type
        • By  Function
        • By  Channel
        • By  Claim
        • By  End User
    • Belgium
      • Pricing Analysis
      • Market Share Analysis, 2024
        • By  Treatment Type
        • By  Function
        • By  Channel
        • By  Claim
        • By  End User
    • Netherlands
      • Pricing Analysis
      • Market Share Analysis, 2024
        • By  Treatment Type
        • By  Function
        • By  Channel
        • By  Claim
        • By  End User
    • Nordic
      • Pricing Analysis
      • Market Share Analysis, 2024
        • By  Treatment Type
        • By  Function
        • By  Channel
        • By  Claim
        • By  End User
    • Switzerland
      • Pricing Analysis
      • Market Share Analysis, 2024
        • By  Treatment Type
        • By  Function
        • By  Channel
        • By  Claim
        • By  End User
    • Russia
      • Pricing Analysis
      • Market Share Analysis, 2024
        • By  Treatment Type
        • By  Function
        • By  Channel
        • By  Claim
        • By  End User
    • Poland
      • Pricing Analysis
      • Market Share Analysis, 2024
        • By  Treatment Type
        • By  Function
        • By  Channel
        • By  Claim
        • By  End User
    • China
      • Pricing Analysis
      • Market Share Analysis, 2024
        • By  Treatment Type
        • By  Function
        • By  Channel
        • By  Claim
        • By  End User
    • Japan
      • Pricing Analysis
      • Market Share Analysis, 2024
        • By  Treatment Type
        • By  Function
        • By  Channel
        • By  Claim
        • By  End User
    • South Korea
      • Pricing Analysis
      • Market Share Analysis, 2024
        • By  Treatment Type
        • By  Function
        • By  Channel
        • By  Claim
        • By  End User
    • India
      • Pricing Analysis
      • Market Share Analysis, 2024
        • By  Treatment Type
        • By  Function
        • By  Channel
        • By  Claim
        • By  End User
    • Thailand
      • Pricing Analysis
      • Market Share Analysis, 2024
        • By  Treatment Type
        • By  Function
        • By  Channel
        • By  Claim
        • By  End User
    • Indonesia
      • Pricing Analysis
      • Market Share Analysis, 2024
        • By  Treatment Type
        • By  Function
        • By  Channel
        • By  Claim
        • By  End User
    • Australia
      • Pricing Analysis
      • Market Share Analysis, 2024
        • By  Treatment Type
        • By  Function
        • By  Channel
        • By  Claim
        • By  End User
    • New Zealand
      • Pricing Analysis
      • Market Share Analysis, 2024
        • By  Treatment Type
        • By  Function
        • By  Channel
        • By  Claim
        • By  End User
    • Turkey
      • Pricing Analysis
      • Market Share Analysis, 2024
        • By  Treatment Type
        • By  Function
        • By  Channel
        • By  Claim
        • By  End User
    • UAE
      • Pricing Analysis
      • Market Share Analysis, 2024
        • By  Treatment Type
        • By  Function
        • By  Channel
        • By  Claim
        • By  End User
    • Saudi Arabia
      • Pricing Analysis
      • Market Share Analysis, 2024
        • By  Treatment Type
        • By  Function
        • By  Channel
        • By  Claim
        • By  End User
    • Israel
      • Pricing Analysis
      • Market Share Analysis, 2024
        • By  Treatment Type
        • By  Function
        • By  Channel
        • By  Claim
        • By  End User
    • North Africa
      • Pricing Analysis
      • Market Share Analysis, 2024
        • By  Treatment Type
        • By  Function
        • By  Channel
        • By  Claim
        • By  End User
    • South Africa
      • Pricing Analysis
      • Market Share Analysis, 2024
        • By  Treatment Type
        • By  Function
        • By  Channel
        • By  Claim
        • By  End User
  18. Market Structure Analysis
    • Competition Dashboard
    • Competition Benchmarking
    • Market Share Analysis of Top Players
      • By Regional
      • By  Treatment Type
      • By  Function
      • By  Channel
      • By  Claim
      • By  End User
  19. Competition Analysis
    • Competition Deep Dive
      • Bio-Oil
        • Overview
        • Product Portfolio
        • Profitability by Market Segments (Product/Age /Sales Channel/Region)
        • Sales Footprint
        • Strategy Overview
          • Marketing Strategy
          • Product Strategy
          • Channel Strategy
      • Palmer’s
        • Overview
        • Product Portfolio
        • Profitability by Market Segments (Product/Age /Sales Channel/Region)
        • Sales Footprint
        • Strategy Overview
          • Marketing Strategy
          • Product Strategy
          • Channel Strategy
      • Mederma
        • Overview
        • Product Portfolio
        • Profitability by Market Segments (Product/Age /Sales Channel/Region)
        • Sales Footprint
        • Strategy Overview
          • Marketing Strategy
          • Product Strategy
          • Channel Strategy
      • Stratpharma
        • Overview
        • Product Portfolio
        • Profitability by Market Segments (Product/Age /Sales Channel/Region)
        • Sales Footprint
        • Strategy Overview
          • Marketing Strategy
          • Product Strategy
          • Channel Strategy
      • Mustela
        • Overview
        • Product Portfolio
        • Profitability by Market Segments (Product/Age /Sales Channel/Region)
        • Sales Footprint
        • Strategy Overview
          • Marketing Strategy
          • Product Strategy
          • Channel Strategy
      • Dermatix
        • Overview
        • Product Portfolio
        • Profitability by Market Segments (Product/Age /Sales Channel/Region)
        • Sales Footprint
        • Strategy Overview
          • Marketing Strategy
          • Product Strategy
          • Channel Strategy
      • Rejuvaskin
        • Overview
        • Product Portfolio
        • Profitability by Market Segments (Product/Age /Sales Channel/Region)
        • Sales Footprint
        • Strategy Overview
          • Marketing Strategy
          • Product Strategy
          • Channel Strategy
      • Clarins
        • Overview
        • Product Portfolio
        • Profitability by Market Segments (Product/Age /Sales Channel/Region)
        • Sales Footprint
        • Strategy Overview
          • Marketing Strategy
          • Product Strategy
          • Channel Strategy
      • Cicatricure
        • Overview
        • Product Portfolio
        • Profitability by Market Segments (Product/Age /Sales Channel/Region)
        • Sales Footprint
        • Strategy Overview
          • Marketing Strategy
          • Product Strategy
          • Channel Strategy
      • Eucerin
        • Overview
        • Product Portfolio
        • Profitability by Market Segments (Product/Age /Sales Channel/Region)
        • Sales Footprint
        • Strategy Overview
          • Marketing Strategy
          • Product Strategy
          • Channel Strategy
      • Others
        • Overview
        • Product Portfolio
        • Profitability by Market Segments (Product/Age /Sales Channel/Region)
        • Sales Footprint
        • Strategy Overview
          • Marketing Strategy
          • Product Strategy
          • Channel Strategy
  20. Assumptions & Acronyms Used
  21. Research Methodology

List of Tables

  • Table 1: Global Market Value (USD Million) Forecast by Region, 2020-2035
  • Table 2: Global Market Volume (Units) Forecast by Region, 2020-2035
  • Table 3: Global Market Value (USD Million) Forecast by Treatment Type, 2020-2035
  • Table 4: Global Market Volume (Units) Forecast by Treatment Type, 2020-2035
  • Table 5: Global Market Value (USD Million) Forecast by Function, 2020-2035
  • Table 6: Global Market Volume (Units) Forecast by Function, 2020-2035
  • Table 7: Global Market Value (USD Million) Forecast by Channel, 2020-2035
  • Table 8: Global Market Volume (Units) Forecast by Channel, 2020-2035
  • Table 9: Global Market Value (USD Million) Forecast by Claim, 2020-2035
  • Table 10: Global Market Volume (Units) Forecast by Claim, 2020-2035
  • Table 11: Global Market Value (USD Million) Forecast by End User, 2020-2035
  • Table 12: Global Market Volume (Units) Forecast by End User, 2020-2035
  • Table 13: North America Market Value (USD Million) Forecast by Country, 2020-2035
  • Table 14: North America Market Volume (Units) Forecast by Country, 2020-2035
  • Table 15: North America Market Value (USD Million) Forecast by Treatment Type, 2020-2035
  • Table 16: North America Market Volume (Units) Forecast by Treatment Type, 2020-2035
  • Table 17: North America Market Value (USD Million) Forecast by Function, 2020-2035
  • Table 18: North America Market Volume (Units) Forecast by Function, 2020-2035
  • Table 19: North America Market Value (USD Million) Forecast by Channel, 2020-2035
  • Table 20: North America Market Volume (Units) Forecast by Channel, 2020-2035
  • Table 21: North America Market Value (USD Million) Forecast by Claim, 2020-2035
  • Table 22: North America Market Volume (Units) Forecast by Claim, 2020-2035
  • Table 23: North America Market Value (USD Million) Forecast by End User, 2020-2035
  • Table 24: North America Market Volume (Units) Forecast by End User, 2020-2035
  • Table 25: Latin America Market Value (USD Million) Forecast by Country, 2020-2035
  • Table 26: Latin America Market Volume (Units) Forecast by Country, 2020-2035
  • Table 27: Latin America Market Value (USD Million) Forecast by Treatment Type, 2020-2035
  • Table 28: Latin America Market Volume (Units) Forecast by Treatment Type, 2020-2035
  • Table 29: Latin America Market Value (USD Million) Forecast by Function, 2020-2035
  • Table 30: Latin America Market Volume (Units) Forecast by Function, 2020-2035
  • Table 31: Latin America Market Value (USD Million) Forecast by Channel, 2020-2035
  • Table 32: Latin America Market Volume (Units) Forecast by Channel, 2020-2035
  • Table 33: Latin America Market Value (USD Million) Forecast by Claim, 2020-2035
  • Table 34: Latin America Market Volume (Units) Forecast by Claim, 2020-2035
  • Table 35: Latin America Market Value (USD Million) Forecast by End User, 2020-2035
  • Table 36: Latin America Market Volume (Units) Forecast by End User, 2020-2035
  • Table 37: Europe Market Value (USD Million) Forecast by Country, 2020-2035
  • Table 38: Europe Market Volume (Units) Forecast by Country, 2020-2035
  • Table 39: Europe Market Value (USD Million) Forecast by Treatment Type, 2020-2035
  • Table 40: Europe Market Volume (Units) Forecast by Treatment Type, 2020-2035
  • Table 41: Europe Market Value (USD Million) Forecast by Function, 2020-2035
  • Table 42: Europe Market Volume (Units) Forecast by Function, 2020-2035
  • Table 43: Europe Market Value (USD Million) Forecast by Channel, 2020-2035
  • Table 44: Europe Market Volume (Units) Forecast by Channel, 2020-2035
  • Table 45: Europe Market Value (USD Million) Forecast by Claim, 2020-2035
  • Table 46: Europe Market Volume (Units) Forecast by Claim, 2020-2035
  • Table 47: Europe Market Value (USD Million) Forecast by End User, 2020-2035
  • Table 48: Europe Market Volume (Units) Forecast by End User, 2020-2035
  • Table 49: East Asia Market Value (USD Million) Forecast by Country, 2020-2035
  • Table 50: East Asia Market Volume (Units) Forecast by Country, 2020-2035
  • Table 51: East Asia Market Value (USD Million) Forecast by Treatment Type, 2020-2035
  • Table 52: East Asia Market Volume (Units) Forecast by Treatment Type, 2020-2035
  • Table 53: East Asia Market Value (USD Million) Forecast by Function, 2020-2035
  • Table 54: East Asia Market Volume (Units) Forecast by Function, 2020-2035
  • Table 55: East Asia Market Value (USD Million) Forecast by Channel, 2020-2035
  • Table 56: East Asia Market Volume (Units) Forecast by Channel, 2020-2035
  • Table 57: East Asia Market Value (USD Million) Forecast by Claim, 2020-2035
  • Table 58: East Asia Market Volume (Units) Forecast by Claim, 2020-2035
  • Table 59: East Asia Market Value (USD Million) Forecast by End User, 2020-2035
  • Table 60: East Asia Market Volume (Units) Forecast by End User, 2020-2035
  • Table 61: South Asia & Pacific Market Value (USD Million) Forecast by Country, 2020-2035
  • Table 62: South Asia & Pacific Market Volume (Units) Forecast by Country, 2020-2035
  • Table 63: South Asia & Pacific Market Value (USD Million) Forecast by Treatment Type, 2020-2035
  • Table 64: South Asia & Pacific Market Volume (Units) Forecast by Treatment Type, 2020-2035
  • Table 65: South Asia & Pacific Market Value (USD Million) Forecast by Function, 2020-2035
  • Table 66: South Asia & Pacific Market Volume (Units) Forecast by Function, 2020-2035
  • Table 67: South Asia & Pacific Market Value (USD Million) Forecast by Channel, 2020-2035
  • Table 68: South Asia & Pacific Market Volume (Units) Forecast by Channel, 2020-2035
  • Table 69: South Asia & Pacific Market Value (USD Million) Forecast by Claim, 2020-2035
  • Table 70: South Asia & Pacific Market Volume (Units) Forecast by Claim, 2020-2035
  • Table 71: South Asia & Pacific Market Value (USD Million) Forecast by End User, 2020-2035
  • Table 72: South Asia & Pacific Market Volume (Units) Forecast by End User, 2020-2035
  • Table 73: Middle East and Africa Market Value (USD Million) Forecast by Country, 2020-2035
  • Table 74: Middle East and Africa Market Volume (Units) Forecast by Country, 2020-2035
  • Table 75: Middle East and Africa Market Value (USD Million) Forecast by Treatment Type, 2020-2035
  • Table 76: Middle East and Africa Market Volume (Units) Forecast by Treatment Type, 2020-2035
  • Table 77: Middle East and Africa Market Value (USD Million) Forecast by Function, 2020-2035
  • Table 78: Middle East and Africa Market Volume (Units) Forecast by Function, 2020-2035
  • Table 79: Middle East and Africa Market Value (USD Million) Forecast by Channel, 2020-2035
  • Table 80: Middle East and Africa Market Volume (Units) Forecast by Channel, 2020-2035
  • Table 81: Middle East and Africa Market Value (USD Million) Forecast by Claim, 2020-2035
  • Table 82: Middle East and Africa Market Volume (Units) Forecast by Claim, 2020-2035
  • Table 83: Middle East and Africa Market Value (USD Million) Forecast by End User, 2020-2035
  • Table 84: Middle East and Africa Market Volume (Units) Forecast by End User, 2020-2035

List of Figures

  • Figure 1: Global Market Value (USD Million) by Treatment Type, 2025-2035
  • Figure 2: Global Market Value (USD Million) by Function, 2025-2035
  • Figure 3: Global Market Value (USD Million) by Channel, 2025-2035
  • Figure 4: Global Market Value (USD Million) by Claim, 2025-2035
  • Figure 5: Global Market Value (USD Million) by End User, 2025-2035
  • Figure 6: Global Market Value (USD Million) by Region, 2025-2035
  • Figure 7: Global Market Value (USD Million) Analysis by Region, 2020-2035
  • Figure 8: Global Market Volume (Units) Analysis by Region, 2020-2035
  • Figure 9: Global Market Value Share (%) and BPS Analysis by Region, 2025-2035
  • Figure 10: Global Market Y-o-Y Growth (%) Projections by Region, 2025-2035
  • Figure 11: Global Market Value (USD Million) Analysis by Treatment Type, 2020-2035
  • Figure 12: Global Market Volume (Units) Analysis by Treatment Type, 2020-2035
  • Figure 13: Global Market Value Share (%) and BPS Analysis by Treatment Type, 2025-2035
  • Figure 14: Global Market Y-o-Y Growth (%) Projections by Treatment Type, 2025-2035
  • Figure 15: Global Market Value (USD Million) Analysis by Function, 2020-2035
  • Figure 16: Global Market Volume (Units) Analysis by Function, 2020-2035
  • Figure 17: Global Market Value Share (%) and BPS Analysis by Function, 2025-2035
  • Figure 18: Global Market Y-o-Y Growth (%) Projections by Function, 2025-2035
  • Figure 19: Global Market Value (USD Million) Analysis by Channel, 2020-2035
  • Figure 20: Global Market Volume (Units) Analysis by Channel, 2020-2035
  • Figure 21: Global Market Value Share (%) and BPS Analysis by Channel, 2025-2035
  • Figure 22: Global Market Y-o-Y Growth (%) Projections by Channel, 2025-2035
  • Figure 23: Global Market Value (USD Million) Analysis by Claim, 2020-2035
  • Figure 24: Global Market Volume (Units) Analysis by Claim, 2020-2035
  • Figure 25: Global Market Value Share (%) and BPS Analysis by Claim, 2025-2035
  • Figure 26: Global Market Y-o-Y Growth (%) Projections by Claim, 2025-2035
  • Figure 27: Global Market Value (USD Million) Analysis by End User, 2020-2035
  • Figure 28: Global Market Volume (Units) Analysis by End User, 2020-2035
  • Figure 29: Global Market Value Share (%) and BPS Analysis by End User, 2025-2035
  • Figure 30: Global Market Y-o-Y Growth (%) Projections by End User, 2025-2035
  • Figure 31: Global Market Attractiveness by Treatment Type, 2025-2035
  • Figure 32: Global Market Attractiveness by Function, 2025-2035
  • Figure 33: Global Market Attractiveness by Channel, 2025-2035
  • Figure 34: Global Market Attractiveness by Claim, 2025-2035
  • Figure 35: Global Market Attractiveness by End User, 2025-2035
  • Figure 36: Global Market Attractiveness by Region, 2025-2035
  • Figure 37: North America Market Value (USD Million) by Treatment Type, 2025-2035
  • Figure 38: North America Market Value (USD Million) by Function, 2025-2035
  • Figure 39: North America Market Value (USD Million) by Channel, 2025-2035
  • Figure 40: North America Market Value (USD Million) by Claim, 2025-2035
  • Figure 41: North America Market Value (USD Million) by End User, 2025-2035
  • Figure 42: North America Market Value (USD Million) by Country, 2025-2035
  • Figure 43: North America Market Value (USD Million) Analysis by Country, 2020-2035
  • Figure 44: North America Market Volume (Units) Analysis by Country, 2020-2035
  • Figure 45: North America Market Value Share (%) and BPS Analysis by Country, 2025-2035
  • Figure 46: North America Market Y-o-Y Growth (%) Projections by Country, 2025-2035
  • Figure 47: North America Market Value (USD Million) Analysis by Treatment Type, 2020-2035
  • Figure 48: North America Market Volume (Units) Analysis by Treatment Type, 2020-2035
  • Figure 49: North America Market Value Share (%) and BPS Analysis by Treatment Type, 2025-2035
  • Figure 50: North America Market Y-o-Y Growth (%) Projections by Treatment Type, 2025-2035
  • Figure 51: North America Market Value (USD Million) Analysis by Function, 2020-2035
  • Figure 52: North America Market Volume (Units) Analysis by Function, 2020-2035
  • Figure 53: North America Market Value Share (%) and BPS Analysis by Function, 2025-2035
  • Figure 54: North America Market Y-o-Y Growth (%) Projections by Function, 2025-2035
  • Figure 55: North America Market Value (USD Million) Analysis by Channel, 2020-2035
  • Figure 56: North America Market Volume (Units) Analysis by Channel, 2020-2035
  • Figure 57: North America Market Value Share (%) and BPS Analysis by Channel, 2025-2035
  • Figure 58: North America Market Y-o-Y Growth (%) Projections by Channel, 2025-2035
  • Figure 59: North America Market Value (USD Million) Analysis by Claim, 2020-2035
  • Figure 60: North America Market Volume (Units) Analysis by Claim, 2020-2035
  • Figure 61: North America Market Value Share (%) and BPS Analysis by Claim, 2025-2035
  • Figure 62: North America Market Y-o-Y Growth (%) Projections by Claim, 2025-2035
  • Figure 63: North America Market Value (USD Million) Analysis by End User, 2020-2035
  • Figure 64: North America Market Volume (Units) Analysis by End User, 2020-2035
  • Figure 65: North America Market Value Share (%) and BPS Analysis by End User, 2025-2035
  • Figure 66: North America Market Y-o-Y Growth (%) Projections by End User, 2025-2035
  • Figure 67: North America Market Attractiveness by Treatment Type, 2025-2035
  • Figure 68: North America Market Attractiveness by Function, 2025-2035
  • Figure 69: North America Market Attractiveness by Channel, 2025-2035
  • Figure 70: North America Market Attractiveness by Claim, 2025-2035
  • Figure 71: North America Market Attractiveness by End User, 2025-2035
  • Figure 72: North America Market Attractiveness by Country, 2025-2035
  • Figure 73: Latin America Market Value (USD Million) by Treatment Type, 2025-2035
  • Figure 74: Latin America Market Value (USD Million) by Function, 2025-2035
  • Figure 75: Latin America Market Value (USD Million) by Channel, 2025-2035
  • Figure 76: Latin America Market Value (USD Million) by Claim, 2025-2035
  • Figure 77: Latin America Market Value (USD Million) by End User, 2025-2035
  • Figure 78: Latin America Market Value (USD Million) by Country, 2025-2035
  • Figure 79: Latin America Market Value (USD Million) Analysis by Country, 2020-2035
  • Figure 80: Latin America Market Volume (Units) Analysis by Country, 2020-2035
  • Figure 81: Latin America Market Value Share (%) and BPS Analysis by Country, 2025-2035
  • Figure 82: Latin America Market Y-o-Y Growth (%) Projections by Country, 2025-2035
  • Figure 83: Latin America Market Value (USD Million) Analysis by Treatment Type, 2020-2035
  • Figure 84: Latin America Market Volume (Units) Analysis by Treatment Type, 2020-2035
  • Figure 85: Latin America Market Value Share (%) and BPS Analysis by Treatment Type, 2025-2035
  • Figure 86: Latin America Market Y-o-Y Growth (%) Projections by Treatment Type, 2025-2035
  • Figure 87: Latin America Market Value (USD Million) Analysis by Function, 2020-2035
  • Figure 88: Latin America Market Volume (Units) Analysis by Function, 2020-2035
  • Figure 89: Latin America Market Value Share (%) and BPS Analysis by Function, 2025-2035
  • Figure 90: Latin America Market Y-o-Y Growth (%) Projections by Function, 2025-2035
  • Figure 91: Latin America Market Value (USD Million) Analysis by Channel, 2020-2035
  • Figure 92: Latin America Market Volume (Units) Analysis by Channel, 2020-2035
  • Figure 93: Latin America Market Value Share (%) and BPS Analysis by Channel, 2025-2035
  • Figure 94: Latin America Market Y-o-Y Growth (%) Projections by Channel, 2025-2035
  • Figure 95: Latin America Market Value (USD Million) Analysis by Claim, 2020-2035
  • Figure 96: Latin America Market Volume (Units) Analysis by Claim, 2020-2035
  • Figure 97: Latin America Market Value Share (%) and BPS Analysis by Claim, 2025-2035
  • Figure 98: Latin America Market Y-o-Y Growth (%) Projections by Claim, 2025-2035
  • Figure 99: Latin America Market Value (USD Million) Analysis by End User, 2020-2035
  • Figure 100: Latin America Market Volume (Units) Analysis by End User, 2020-2035
  • Figure 101: Latin America Market Value Share (%) and BPS Analysis by End User, 2025-2035
  • Figure 102: Latin America Market Y-o-Y Growth (%) Projections by End User, 2025-2035
  • Figure 103: Latin America Market Attractiveness by Treatment Type, 2025-2035
  • Figure 104: Latin America Market Attractiveness by Function, 2025-2035
  • Figure 105: Latin America Market Attractiveness by Channel, 2025-2035
  • Figure 106: Latin America Market Attractiveness by Claim, 2025-2035
  • Figure 107: Latin America Market Attractiveness by End User, 2025-2035
  • Figure 108: Latin America Market Attractiveness by Country, 2025-2035
  • Figure 109: Europe Market Value (USD Million) by Treatment Type, 2025-2035
  • Figure 110: Europe Market Value (USD Million) by Function, 2025-2035
  • Figure 111: Europe Market Value (USD Million) by Channel, 2025-2035
  • Figure 112: Europe Market Value (USD Million) by Claim, 2025-2035
  • Figure 113: Europe Market Value (USD Million) by End User, 2025-2035
  • Figure 114: Europe Market Value (USD Million) by Country, 2025-2035
  • Figure 115: Europe Market Value (USD Million) Analysis by Country, 2020-2035
  • Figure 116: Europe Market Volume (Units) Analysis by Country, 2020-2035
  • Figure 117: Europe Market Value Share (%) and BPS Analysis by Country, 2025-2035
  • Figure 118: Europe Market Y-o-Y Growth (%) Projections by Country, 2025-2035
  • Figure 119: Europe Market Value (USD Million) Analysis by Treatment Type, 2020-2035
  • Figure 120: Europe Market Volume (Units) Analysis by Treatment Type, 2020-2035
  • Figure 121: Europe Market Value Share (%) and BPS Analysis by Treatment Type, 2025-2035
  • Figure 122: Europe Market Y-o-Y Growth (%) Projections by Treatment Type, 2025-2035
  • Figure 123: Europe Market Value (USD Million) Analysis by Function, 2020-2035
  • Figure 124: Europe Market Volume (Units) Analysis by Function, 2020-2035
  • Figure 125: Europe Market Value Share (%) and BPS Analysis by Function, 2025-2035
  • Figure 126: Europe Market Y-o-Y Growth (%) Projections by Function, 2025-2035
  • Figure 127: Europe Market Value (USD Million) Analysis by Channel, 2020-2035
  • Figure 128: Europe Market Volume (Units) Analysis by Channel, 2020-2035
  • Figure 129: Europe Market Value Share (%) and BPS Analysis by Channel, 2025-2035
  • Figure 130: Europe Market Y-o-Y Growth (%) Projections by Channel, 2025-2035
  • Figure 131: Europe Market Value (USD Million) Analysis by Claim, 2020-2035
  • Figure 132: Europe Market Volume (Units) Analysis by Claim, 2020-2035
  • Figure 133: Europe Market Value Share (%) and BPS Analysis by Claim, 2025-2035
  • Figure 134: Europe Market Y-o-Y Growth (%) Projections by Claim, 2025-2035
  • Figure 135: Europe Market Value (USD Million) Analysis by End User, 2020-2035
  • Figure 136: Europe Market Volume (Units) Analysis by End User, 2020-2035
  • Figure 137: Europe Market Value Share (%) and BPS Analysis by End User, 2025-2035
  • Figure 138: Europe Market Y-o-Y Growth (%) Projections by End User, 2025-2035
  • Figure 139: Europe Market Attractiveness by Treatment Type, 2025-2035
  • Figure 140: Europe Market Attractiveness by Function, 2025-2035
  • Figure 141: Europe Market Attractiveness by Channel, 2025-2035
  • Figure 142: Europe Market Attractiveness by Claim, 2025-2035
  • Figure 143: Europe Market Attractiveness by End User, 2025-2035
  • Figure 144: Europe Market Attractiveness by Country, 2025-2035
  • Figure 145: East Asia Market Value (USD Million) by Treatment Type, 2025-2035
  • Figure 146: East Asia Market Value (USD Million) by Function, 2025-2035
  • Figure 147: East Asia Market Value (USD Million) by Channel, 2025-2035
  • Figure 148: East Asia Market Value (USD Million) by Claim, 2025-2035
  • Figure 149: East Asia Market Value (USD Million) by End User, 2025-2035
  • Figure 150: East Asia Market Value (USD Million) by Country, 2025-2035
  • Figure 151: East Asia Market Value (USD Million) Analysis by Country, 2020-2035
  • Figure 152: East Asia Market Volume (Units) Analysis by Country, 2020-2035
  • Figure 153: East Asia Market Value Share (%) and BPS Analysis by Country, 2025-2035
  • Figure 154: East Asia Market Y-o-Y Growth (%) Projections by Country, 2025-2035
  • Figure 155: East Asia Market Value (USD Million) Analysis by Treatment Type, 2020-2035
  • Figure 156: East Asia Market Volume (Units) Analysis by Treatment Type, 2020-2035
  • Figure 157: East Asia Market Value Share (%) and BPS Analysis by Treatment Type, 2025-2035
  • Figure 158: East Asia Market Y-o-Y Growth (%) Projections by Treatment Type, 2025-2035
  • Figure 159: East Asia Market Value (USD Million) Analysis by Function, 2020-2035
  • Figure 160: East Asia Market Volume (Units) Analysis by Function, 2020-2035
  • Figure 161: East Asia Market Value Share (%) and BPS Analysis by Function, 2025-2035
  • Figure 162: East Asia Market Y-o-Y Growth (%) Projections by Function, 2025-2035
  • Figure 163: East Asia Market Value (USD Million) Analysis by Channel, 2020-2035
  • Figure 164: East Asia Market Volume (Units) Analysis by Channel, 2020-2035
  • Figure 165: East Asia Market Value Share (%) and BPS Analysis by Channel, 2025-2035
  • Figure 166: East Asia Market Y-o-Y Growth (%) Projections by Channel, 2025-2035
  • Figure 167: East Asia Market Value (USD Million) Analysis by Claim, 2020-2035
  • Figure 168: East Asia Market Volume (Units) Analysis by Claim, 2020-2035
  • Figure 169: East Asia Market Value Share (%) and BPS Analysis by Claim, 2025-2035
  • Figure 170: East Asia Market Y-o-Y Growth (%) Projections by Claim, 2025-2035
  • Figure 171: East Asia Market Value (USD Million) Analysis by End User, 2020-2035
  • Figure 172: East Asia Market Volume (Units) Analysis by End User, 2020-2035
  • Figure 173: East Asia Market Value Share (%) and BPS Analysis by End User, 2025-2035
  • Figure 174: East Asia Market Y-o-Y Growth (%) Projections by End User, 2025-2035
  • Figure 175: East Asia Market Attractiveness by Treatment Type, 2025-2035
  • Figure 176: East Asia Market Attractiveness by Function, 2025-2035
  • Figure 177: East Asia Market Attractiveness by Channel, 2025-2035
  • Figure 178: East Asia Market Attractiveness by Claim, 2025-2035
  • Figure 179: East Asia Market Attractiveness by End User, 2025-2035
  • Figure 180: East Asia Market Attractiveness by Country, 2025-2035
  • Figure 181: South Asia & Pacific Market Value (USD Million) by Treatment Type, 2025-2035
  • Figure 182: South Asia & Pacific Market Value (USD Million) by Function, 2025-2035
  • Figure 183: South Asia & Pacific Market Value (USD Million) by Channel, 2025-2035
  • Figure 184: South Asia & Pacific Market Value (USD Million) by Claim, 2025-2035
  • Figure 185: South Asia & Pacific Market Value (USD Million) by End User, 2025-2035
  • Figure 186: South Asia & Pacific Market Value (USD Million) by Country, 2025-2035
  • Figure 187: South Asia & Pacific Market Value (USD Million) Analysis by Country, 2020-2035
  • Figure 188: South Asia & Pacific Market Volume (Units) Analysis by Country, 2020-2035
  • Figure 189: South Asia & Pacific Market Value Share (%) and BPS Analysis by Country, 2025-2035
  • Figure 190: South Asia & Pacific Market Y-o-Y Growth (%) Projections by Country, 2025-2035
  • Figure 191: South Asia & Pacific Market Value (USD Million) Analysis by Treatment Type, 2020-2035
  • Figure 192: South Asia & Pacific Market Volume (Units) Analysis by Treatment Type, 2020-2035
  • Figure 193: South Asia & Pacific Market Value Share (%) and BPS Analysis by Treatment Type, 2025-2035
  • Figure 194: South Asia & Pacific Market Y-o-Y Growth (%) Projections by Treatment Type, 2025-2035
  • Figure 195: South Asia & Pacific Market Value (USD Million) Analysis by Function, 2020-2035
  • Figure 196: South Asia & Pacific Market Volume (Units) Analysis by Function, 2020-2035
  • Figure 197: South Asia & Pacific Market Value Share (%) and BPS Analysis by Function, 2025-2035
  • Figure 198: South Asia & Pacific Market Y-o-Y Growth (%) Projections by Function, 2025-2035
  • Figure 199: South Asia & Pacific Market Value (USD Million) Analysis by Channel, 2020-2035
  • Figure 200: South Asia & Pacific Market Volume (Units) Analysis by Channel, 2020-2035
  • Figure 201: South Asia & Pacific Market Value Share (%) and BPS Analysis by Channel, 2025-2035
  • Figure 202: South Asia & Pacific Market Y-o-Y Growth (%) Projections by Channel, 2025-2035
  • Figure 203: South Asia & Pacific Market Value (USD Million) Analysis by Claim, 2020-2035
  • Figure 204: South Asia & Pacific Market Volume (Units) Analysis by Claim, 2020-2035
  • Figure 205: South Asia & Pacific Market Value Share (%) and BPS Analysis by Claim, 2025-2035
  • Figure 206: South Asia & Pacific Market Y-o-Y Growth (%) Projections by Claim, 2025-2035
  • Figure 207: South Asia & Pacific Market Value (USD Million) Analysis by End User, 2020-2035
  • Figure 208: South Asia & Pacific Market Volume (Units) Analysis by End User, 2020-2035
  • Figure 209: South Asia & Pacific Market Value Share (%) and BPS Analysis by End User, 2025-2035
  • Figure 210: South Asia & Pacific Market Y-o-Y Growth (%) Projections by End User, 2025-2035
  • Figure 211: South Asia & Pacific Market Attractiveness by Treatment Type, 2025-2035
  • Figure 212: South Asia & Pacific Market Attractiveness by Function, 2025-2035
  • Figure 213: South Asia & Pacific Market Attractiveness by Channel, 2025-2035
  • Figure 214: South Asia & Pacific Market Attractiveness by Claim, 2025-2035
  • Figure 215: South Asia & Pacific Market Attractiveness by End User, 2025-2035
  • Figure 216: South Asia & Pacific Market Attractiveness by Country, 2025-2035
  • Figure 217: Middle East and Africa Market Value (USD Million) by Treatment Type, 2025-2035
  • Figure 218: Middle East and Africa Market Value (USD Million) by Function, 2025-2035
  • Figure 219: Middle East and Africa Market Value (USD Million) by Channel, 2025-2035
  • Figure 220: Middle East and Africa Market Value (USD Million) by Claim, 2025-2035
  • Figure 221: Middle East and Africa Market Value (USD Million) by End User, 2025-2035
  • Figure 222: Middle East and Africa Market Value (USD Million) by Country, 2025-2035
  • Figure 223: Middle East and Africa Market Value (USD Million) Analysis by Country, 2020-2035
  • Figure 224: Middle East and Africa Market Volume (Units) Analysis by Country, 2020-2035
  • Figure 225: Middle East and Africa Market Value Share (%) and BPS Analysis by Country, 2025-2035
  • Figure 226: Middle East and Africa Market Y-o-Y Growth (%) Projections by Country, 2025-2035
  • Figure 227: Middle East and Africa Market Value (USD Million) Analysis by Treatment Type, 2020-2035
  • Figure 228: Middle East and Africa Market Volume (Units) Analysis by Treatment Type, 2020-2035
  • Figure 229: Middle East and Africa Market Value Share (%) and BPS Analysis by Treatment Type, 2025-2035
  • Figure 230: Middle East and Africa Market Y-o-Y Growth (%) Projections by Treatment Type, 2025-2035
  • Figure 231: Middle East and Africa Market Value (USD Million) Analysis by Function, 2020-2035
  • Figure 232: Middle East and Africa Market Volume (Units) Analysis by Function, 2020-2035
  • Figure 233: Middle East and Africa Market Value Share (%) and BPS Analysis by Function, 2025-2035
  • Figure 234: Middle East and Africa Market Y-o-Y Growth (%) Projections by Function, 2025-2035
  • Figure 235: Middle East and Africa Market Value (USD Million) Analysis by Channel, 2020-2035
  • Figure 236: Middle East and Africa Market Volume (Units) Analysis by Channel, 2020-2035
  • Figure 237: Middle East and Africa Market Value Share (%) and BPS Analysis by Channel, 2025-2035
  • Figure 238: Middle East and Africa Market Y-o-Y Growth (%) Projections by Channel, 2025-2035
  • Figure 239: Middle East and Africa Market Value (USD Million) Analysis by Claim, 2020-2035
  • Figure 240: Middle East and Africa Market Volume (Units) Analysis by Claim, 2020-2035
  • Figure 241: Middle East and Africa Market Value Share (%) and BPS Analysis by Claim, 2025-2035
  • Figure 242: Middle East and Africa Market Y-o-Y Growth (%) Projections by Claim, 2025-2035
  • Figure 243: Middle East and Africa Market Value (USD Million) Analysis by End User, 2020-2035
  • Figure 244: Middle East and Africa Market Volume (Units) Analysis by End User, 2020-2035
  • Figure 245: Middle East and Africa Market Value Share (%) and BPS Analysis by End User, 2025-2035
  • Figure 246: Middle East and Africa Market Y-o-Y Growth (%) Projections by End User, 2025-2035
  • Figure 247: Middle East and Africa Market Attractiveness by Treatment Type, 2025-2035
  • Figure 248: Middle East and Africa Market Attractiveness by Function, 2025-2035
  • Figure 249: Middle East and Africa Market Attractiveness by Channel, 2025-2035
  • Figure 250: Middle East and Africa Market Attractiveness by Claim, 2025-2035
  • Figure 251: Middle East and Africa Market Attractiveness by End User, 2025-2035
  • Figure 252: Middle East and Africa Market Attractiveness by Country, 2025-2035

Frequently Asked Questions

How big is the Scar and Stretch Mark Treatment Market in 2025?

The global Scar and Stretch Mark Treatment Market is estimated to be valued at USD 4,702.1 million in 2025.

What will be the size of the Scar and Stretch Mark Treatment Market in 2035?

The market size for the Scar and Stretch Mark Treatment Market is projected to reach USD 10,802.1 million by 2035.

How much will be the Scar and Stretch Mark Treatment Market growth between 2025 and 2035?

The Scar and Stretch Mark Treatment Market is expected to grow at a CAGR of 8.7% between 2025 and 2035.

What are the key product types in the Scar and Stretch Mark Treatment Market?

The key product types in the Scar and Stretch Mark Treatment Market include topical creams/serums, oils & butters, silicone gels/sheets, and clinical procedure support.

Which functional segment is expected to contribute a significant share in the Scar and Stretch Mark Treatment Market in 2025?

In terms of function, stretch mark fading is expected to command a 46% share in the Scar and Stretch Mark Treatment Market in 2025.

Explore Similar Insights

Future Market Insights

Scar and Stretch Mark Treatment Market

Chat With MaRIA

Chat With

MaRIA

Hi There, I am MaRIA, Your Market Research Intelligence Assistant. How may I help you?