Sleek Can Market Size and Share Forecast Outlook 2025 to 2035

The sleek can market is expected to grow from USD 6.3 billion in 2025 to USD 9.5 billion by 2035, resulting in a total increase of USD 3.2 billion over the forecast decade. This represents a 50.8% total expansion, with the market advancing at a compound annual growth rate (CAGR) of 4.2%. Over ten years, the market grows by a 1.5 multiple.
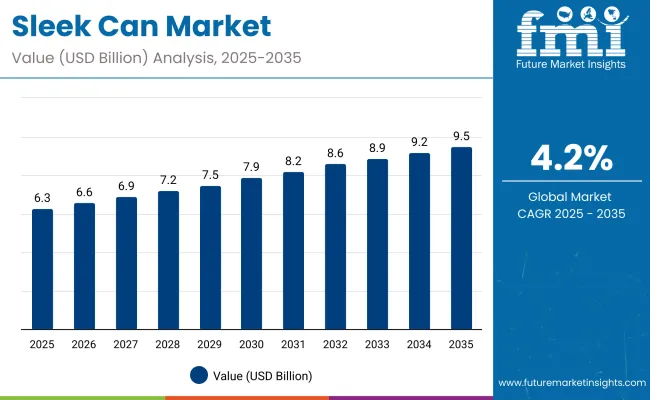
Quick Stats for Sleek Can Market

  • Market Value (2025): USD 6.3 billion
  • Market Forecast Value (2035): USD 9.5 billion
  • Market Forecast CAGR: 4.2%
  • Leading Segment in 2025: Aluminum (68.7%)
  • Key Growth Regions: Asia-Pacific (India is the fastest-growing market with 5.2% CAGR)
  • Top Key Players: Ball Corporation, Crown Holdings, Visy, Orora Beverage, Biopineoe, Hiuier Pack

Sleek Can Market

Metric Value
Industry Size (2025E) USD 6.3 billion
Industry Value (2035F) USD 9.5 billion
CAGR (2025 to 2035) 4.2%

In the first five years (2025-2030), the market progresses from USD 6.3 billion to USD 7.6 billion, contributing USD 1.3 billion, or 40.6% of total decade growth. This phase is shaped by rising demand in energy drinks and carbonated soft drinks, where sleek formats enhance branding and portability. Premium positioning in North America and Europe drives strong adoption.

In the second half (2030-2035), the market grows from USD 7.6 billion to USD 9.5 billion, adding USD 1.9 billion, or 59.4% of the total growth. This acceleration is supported by lightweight aluminium innovations, recyclability improvements, and expansion in functional beverage packaging. Growth is reinforced by breweries and nutraceutical brands adopting sleek cans for differentiation, ensuring their place as a preferred format in global beverage markets.

From 2020 to 2024, the sleek can market expanded from USD 5.4 billion to USD 6.0 billion, driven by strong adoption in energy drinks, functional beverages, and premium alcoholic drinks. Nearly 70% of revenue was dominated by major can manufacturers focused on light weighting, design appeal, and recyclability. Leading firms such as Ball Corporation, Crown Holdings, and Ardagh Group emphasized high-speed production, BPA-free coatings, and improved printability. Differentiation centered on portability, stackability, and shelf impact, while smart-label integration remained a secondary innovation. Service-led offerings such as design consulting contributed under 12% of revenues, as most beverage brands opted for direct procurement of cans in bulk.

By 2035, the sleek cans market will reach USD 9.5 billion, growing at a CAGR of 4.20%, with sustainable aluminum innovations and digitally enhanced cans representing over 40% of total value. Competition will intensify as new players introduce bio-coated metals, AR-enabled interactive packaging, and modular customization options. Established leaders are adapting with hybrid models combining manufacturing excellence with design-driven differentiation and IoT traceability. Emerging companies such as Canpack, Envases, and CCL Industries are gaining momentum with eco-aligned finishes, variable-size capabilities, and advanced decoration technologies that meet evolving consumer demand for both sustainability and premium beverage presentation.

Why is the Sleek Can Market growing?

The rising popularity of energy drinks, sparkling water, and premium ready-to-drink beverages is fueling growth in the sleek can market. These cans provide a modern, stylish look and excellent branding opportunities, appealing to younger consumers and lifestyle-focused buyers. Lightweight construction and recyclability further support adoption across beverage categories.

Sleek cans featuring aluminum bodies, high-resolution printing, and tamper-evident closures are gaining traction for their ability to preserve taste and carbonation. Their stackability, reduced material usage, and compatibility with automated filling lines enhance operational efficiency. Sustainability initiatives promoting recyclable metal packaging also contribute to strong global market expansion.

Segmental Analysis

The market is segmented by material, capacity, application, end-use industry, and region. Material segmentation includes aluminum, steel, tinplate, composite laminates (metal-plastic hybrids), and bio-based coated metals, each offering durability, lightweight features, and sustainability benefits. Capacity covers small (150 ml-250 ml), medium (251 ml-355 ml), and large (356 ml-500 ml and above), aligning with beverage portion preferences and branding needs.

Applications include carbonated soft drinks, energy drinks, alcoholic beverages, functional and nutritional drinks, bottled water, and ready-to-drink coffee and tea, supporting diverse consumption trends. End-use industries consist of food and beverage manufacturers, breweries and distilleries, nutraceutical brands, retail and supermarkets, and the food service sector. Regionally, the market is segmented into North America, Europe, Asia-Pacific, Latin America, and the Middle East & Africa.
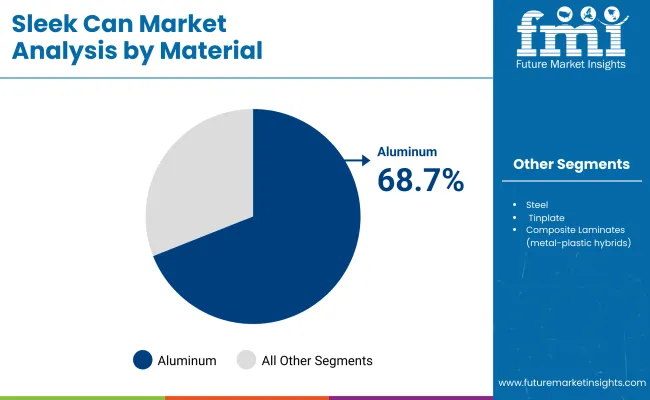
Aluminum Dominates with Lightweight Strength and Recycling Advantages

Sleek Can Market By Material

Aluminum is forecast to account for 68.7% of the sleek can market in 2025, supported by its lightweight structure, durability, and strong recyclability. Its high barrier properties protect beverages from light and oxygen exposure, ensuring taste preservation and extended shelf life. Brands also prefer aluminum for its premium feel and sustainability profile.

Rising consumer demand for eco-friendly packaging has accelerated the transition from steel and tinplate to aluminum. Innovations in coating and printing technologies enhance branding opportunities, while infinite recyclability strengthens environmental appeal. The material’s compatibility with diverse beverages reinforces its leadership in the sleek can segment.
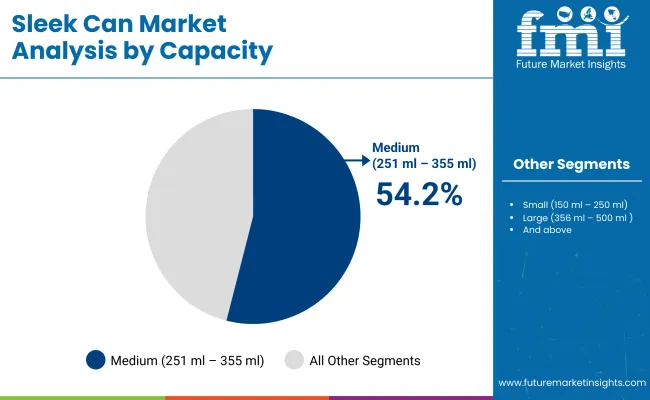
Medium Capacity Cans Lead with Consumer Convenience and Standardization

Sleek Can Market By Capacity

Medium-sized cans (251-355 ml) are projected to hold 54.2% of the market in 2025, driven by their suitability for carbonated drinks, energy beverages, and functional drinks. Their balance between portability and portion control makes them the most widely accepted format worldwide.

Adoption is fueled by their dominance in vending, retail, and on-the-go consumption channels. Beverage companies rely on this size for cost-efficient filling and compatibility with existing production lines. Medium capacity cans also allow effective packaging for limited-edition launches and multipack promotions.
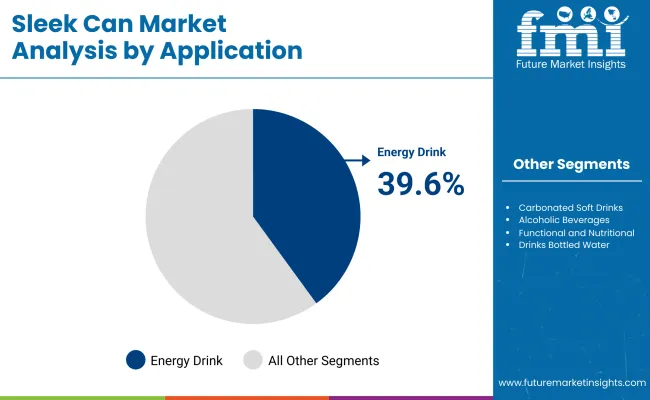
Energy Drinks Dominate Applications with High Growth in Functional Beverages

Sleek Can Market Application

Energy drinks are expected to capture 39.6% of demand in 2025, as sleek cans align with the category’s branding and lifestyle-driven appeal. The slim design emphasizes modernity, mobility, and premium positioning, resonating strongly with younger demographics and athletes.

The functional beverage boom has reinforced this trend, with sleek cans enabling differentiation on crowded shelves. Their ability to accommodate nitrogen flushing and barrier linings enhances product stability. Marketing strategies highlighting convenience and energy-boosting benefits further cement sleek cans as the preferred format for energy drinks.
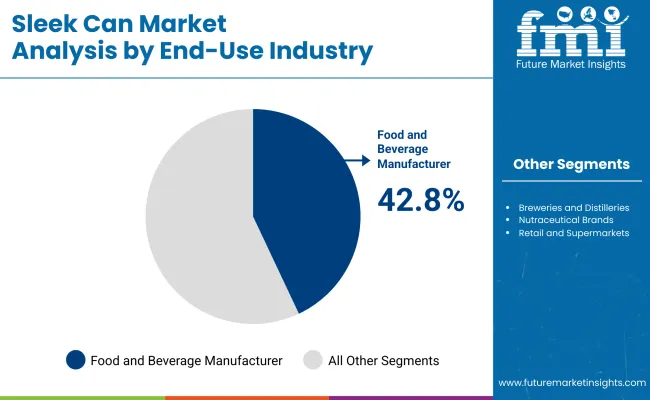
Food and Beverage Manufacturers Lead End-Use with Large-Scale Production Needs

Sleek Can Market End Use

Food and beverage manufacturers are projected to account for 42.8% of demand in 2025, as they represent the largest producers of carbonated, energy, and functional beverages. Sleek cans are favored for their ability to support mass production, branding consistency, and product shelf appeal.

Manufacturers benefit from streamlined logistics, as cans offer stacking efficiency and reduced transportation costs. Partnerships with packaging companies ensure consistent supply of high-quality aluminum formats. As global beverage demand expands, large-scale producers continue to anchor sleek can adoption.

What are the Drivers, Restraints, and Key Trends of the Sleek Can Market?

The sleek can market is growing as beverage brands adopt slim, lightweight packaging to enhance shelf appeal and reduce material usage. Rising consumption of energy drinks, RTD coffee, and functional beverages supports demand. However, high production costs and recycling challenges limit broader adoption. Trends in eco-friendly coatings, customizable printing, and lightweight aluminum are driving market innovation.

Premium Appeal, Convenience, and Functional Beverage Growth Driving Adoption

Sleek cans are increasingly chosen for their slim design, which offers a modern look and easy portability. Their strong visual appeal supports brand differentiation on crowded retail shelves. The format is especially popular in energy drinks, carbonated soft drinks, and functional beverages, aligning with lifestyle-focused consumer demand. Beverage companies also prefer sleek cans for their compatibility with chilled vending machines and convenience packaging channels. These factors are positioning sleek cans as a premium yet practical solution.

High Manufacturing Costs, Recycling Limitations, and Supply Challenges Restraining Growth

Adoption is hindered by the higher cost of producing sleek cans compared to standard formats, driven by specialized tooling and forming requirements. Recycling presents challenges due to multi-material laminates and coated interiors that complicate recovery processes. Raw material price volatility, particularly for aluminum, adds further uncertainty for manufacturers. Smaller beverage companies often struggle with limited access to sleek can production lines, restricting availability and raising costs. These constraints slow adoption outside premium beverage categories.

Eco-friendly Coatings, Light weighting, and Customization Trends Emerging

Key trends include the development of BPA-free and eco-friendly can linings that meet stringent regulatory standards. Lightweight aluminum innovations are reducing material use while maintaining strength and durability. Customizable high-definition printing and limited-edition designs are enhancing brand identity and consumer engagement. Growth in functional and nutraceutical beverages is further expanding the use of sleek cans, supported by sustainability commitments and increased investment in regional can production facilities. These trends are redefining sleek cans as a sustainable and consumer-driven packaging format.
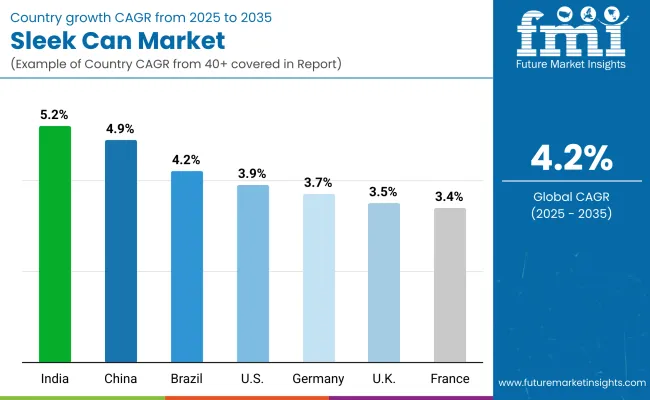
Analysis of Sleek Can Market by Key Countries

Sleek Can Market By Country

The global sleek can market is experiencing consistent growth, driven by rising demand for premium beverages, sustainable packaging, and portability. Asia-Pacific is emerging as the fastest-growing region, with India and China adopting sleek cans due to expanding energy drink and RTD beverage markets. Developed economies like the USA, Germany, and Japan emphasize recyclable aluminum formats, lightweight designs, and innovative finishes to meet consumer preferences and regulatory goals. Beverage makers worldwide continue shifting toward sleek formats to enhance branding and convenience.
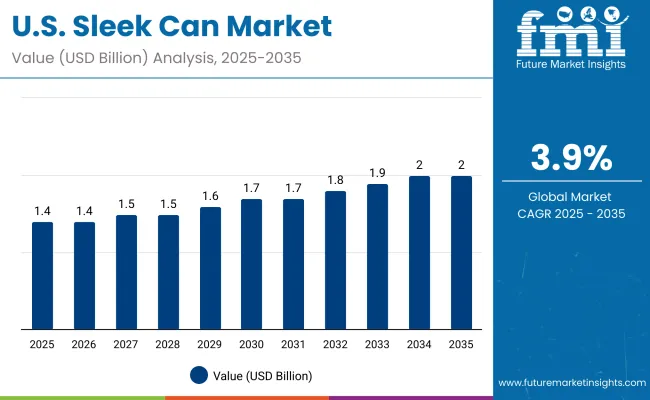
Sales Outlook for Sleek Can Market United States

Sleek Can Market Usa

The USA market is projected to grow at a CAGR of 3.9% from 2025 to 2035, supported by rising demand for energy drinks, craft beverages, and functional drinks. Consumers increasingly prefer lightweight, recyclable packaging aligned with sustainability goals. Manufacturers are introducing customizable sleek can formats with advanced printing for branding. The growth of premium RTD cocktails and low-alcohol beverages is further fueling adoption, as sleek cans become a preferred option across breweries, health brands, and retailers.
  • Energy drink makers use sleek cans to target young, urban consumers.
  • Craft breweries shift toward recyclable aluminum sleek formats for branding.
  • OEMs add advanced digital printing to enhance customization and appeal.

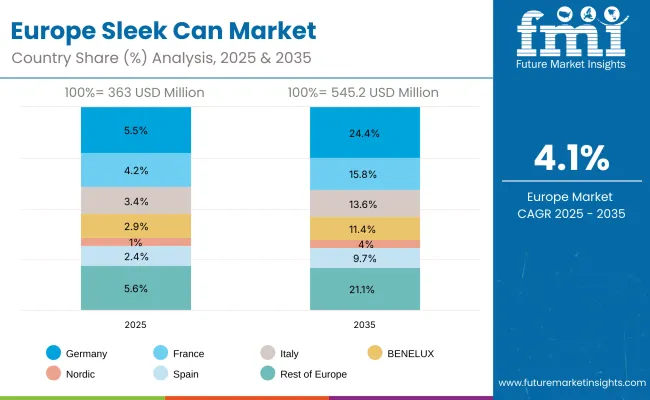
Growth Outlook for Sleek Can Market Germany

Sleek Can Market Europe

Germany’s market is expected to grow at a CAGR of 3.7%, supported by strong demand for beer, energy drinks, and premium soft drinks. Stringent EU sustainability regulations are pushing beverage brands toward fully recyclable, lightweight aluminum cans. German OEMs are focusing on developing coatings and finishes that extend shelf life and preserve product quality. Rising exports of German beverages also support adoption of sleek cans, with an emphasis on durability, branding, and sustainability compliance.

  • Beer producers prefer sleek cans for export-friendly, durable packaging solutions.
  • Energy drink brands adopt recyclable formats for EU compliance.
  • OEMs develop coatings ensuring freshness and longer shelf life.

Expansion Outlook for Sleek Can Market United Kingdom

The UK market is projected to grow at a CAGR of 3.5%, driven by rising demand for premium RTD cocktails, flavored waters, and energy drinks. Sleek cans are gaining traction in retail and e-commerce channels due to their convenience and branding advantages. Mid-sized producers and startups are adopting customizable cans for niche beverage launches. The shift toward recyclable, lightweight materials supports sustainability goals while appealing to environmentally conscious consumers.

  • RTD cocktail brands adopt sleek cans to capture urban markets.
  • Startups leverage sleek cans for niche and innovative product launches.
  • Retailers demand recyclable cans aligned with packaging waste targets.

Sales Outlook for Sleek Can Market China

China’s market is forecast to grow at a CAGR of 4.9%, fueled by strong demand for energy drinks, carbonated beverages, and functional drinks. Expanding urbanization and rising disposable incomes are driving adoption. Domestic manufacturers are scaling cost-effective sleek cans with advanced finishes for branding. Growth in online beverage retail and quick-service channels is further supporting adoption, making sleek cans a preferred choice for convenience, appeal, and export-oriented beverage packaging strategies.

  • Energy drink firms expand sleek can use to meet youth demand.
  • Domestic OEMs scale cost-effective sleek formats with premium designs.
  • E-commerce boosts demand for sleek cans in quick-service delivery.

Growth Outlook for Sleek Can Market India

India is forecast to record the fastest growth at a CAGR of 5.2%, supported by rising demand for energy drinks, functional beverages, and RTD cocktails. Growing middle-class consumption and urbanization are accelerating adoption of sleek cans for convenience and portability. Beverage brands are focusing on recyclable aluminum packaging aligned with global sustainability standards. Local manufacturers are scaling production to meet rising demand from both domestic consumers and export-oriented beverage producers.

  • Energy drink startups adopt sleek cans for branding and portability.
  • Beverage firms emphasize recyclable packaging to align with global goals.
  • OEMs scale sleek can production to meet domestic and export demand.

Growth Outlook for Sleek Can Market Japan

Japan’s market is projected to grow at a CAGR of 3.6%, supported by demand in premium teas, health beverages, and functional drinks. Sleek cans are favored for compactness, portability, and premium presentation. Manufacturers are investing in innovative coatings and finishes that preserve delicate flavors and extend shelf life. Customizable cans with cultural designs are also gaining traction, appealing to both domestic and export consumers in Japan’s premium beverage segment.

  • Tea and health drink brands adopt sleek cans for convenience.
  • OEMs design advanced coatings to preserve delicate beverage flavors.
  • Retailers push customizable cultural designs for consumer engagement.

Expansion Outlook for Sleek Can Market South Korea

South Korea’s market is expected to grow at a CAGR of 3.3%, supported by rising demand for energy drinks, flavored waters, and functional teas. Sleek cans are gaining popularity in K-beauty-inspired beverage collaborations, offering portability and style. Beverage startups are using sleek cans as a premium branding tool. Export-driven demand for K-drinks is also fueling adoption, with recyclable aluminum sleek cans positioned as both trendy and eco-friendly packaging solutions.
  • K-drink exporters use sleek cans for premium and eco-friendly appeal.
  • Beverage startups adopt sleek cans for stylish, brand-focused launches.
  • Collaborations integrate sleek cans with K-beauty-inspired beverage products.

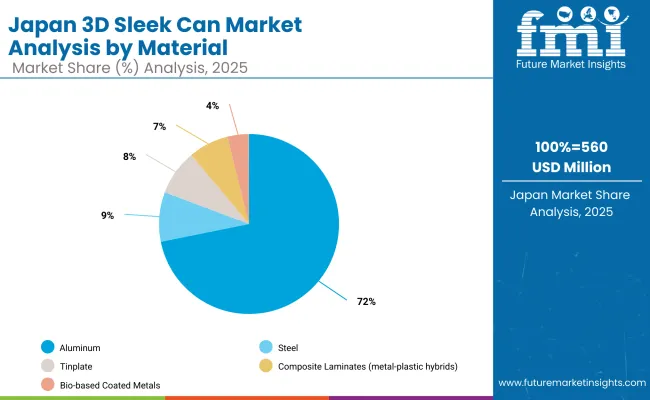
Analysis of Japan Sleek Can Market by Material

Sleek Can Market Japan

Japan’s sleek can market, valued at USD 560 million in 2025, is overwhelmingly led by aluminum with a 70.3% share, reflecting its dominance due to lightweight, recyclability, and premium appeal. Steel contributes 9.2%, tinplate accounts for 8.3%, composite laminates represent 7.3%, and bio-based coated metals stand at 4.9%. The strong position of aluminum highlights its suitability for beverages and energy drinks, aligning with consumer preference for convenience and sustainability. However, bio-based coated metals and composites are gradually expanding, signaling opportunities for eco-friendly innovation within Japan’s packaging sector.
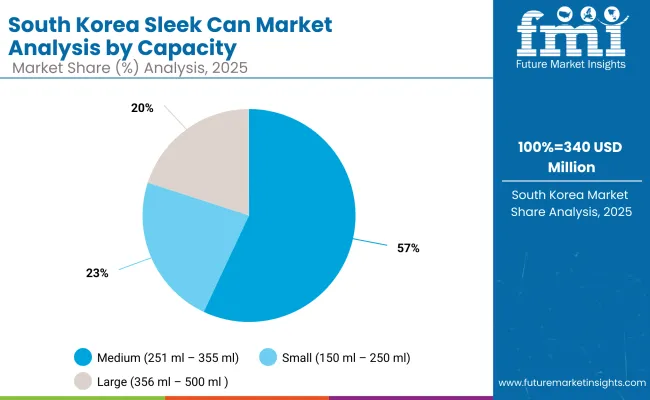
Analysis of South Korea Sleek Can Market by Capacity

Sleek Can Market South Korea

South Korea’s sleek can market in 2025, worth USD 340 million, is dominated by medium-capacity cans (251-355 ml), capturing 55.9% of share. Small cans (150-250 ml) follow with 14.0%, while large formats (356-500 ml and above) represent 12.7%. The dominance of medium-size cans reflects strong use in carbonated beverages, energy drinks, and ready-to-drink teas, catering to convenience-driven consumption. Small cans are increasingly preferred for portion control and health-conscious demand, while large sizes are used in multipacks and premium product launches. This distribution highlights South Korea’s diverse demand for sleek cans across different consumer groups and beverage categories.
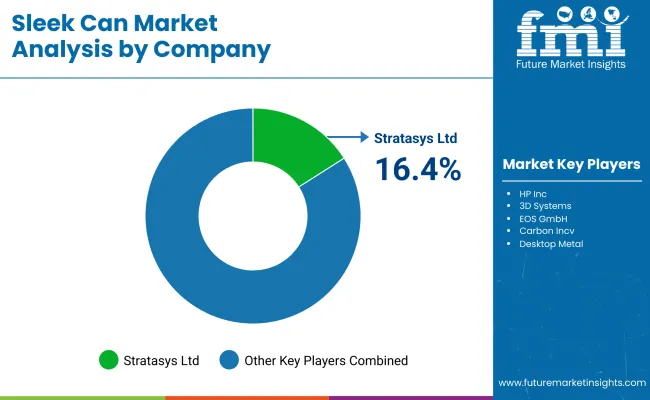
Competitive Landscape of Sleek Can Market

Sleek Can Market By Company

The sleek can market is moderately fragmented, with global can makers, regional packaging firms, and specialty producers competing across carbonated soft drinks, energy beverages, and alcoholic segments. Global leaders such as Ball Corporation, Crown Holdings, and Visy hold notable market share, driven by lightweight aluminum innovations, high-speed filling compatibility, and compliance with recycling and food safety standards. Their strategies increasingly emphasize sustainable sourcing, design differentiation, and regional production footprint expansion.

Established mid-sized players including Orora Beverage and Biopineoe are supporting adoption of slim-profile cans featuring advanced lithographic printing, improved barrier coatings, and ergonomic designs that appeal to health-conscious and premium beverage consumers. These companies are especially active in functional drinks and craft beverages, offering enhanced branding opportunities, reduced material usage, and tailored production flexibility.

Specialized providers such as Hiuier Pack focus on customized sleek can solutions for regional bottlers and niche markets. Their strengths lie in small-batch manufacturing, innovative surface finishes, and rapid prototyping, enabling beverage brands to test new formats, achieve greater shelf appeal, and cater to emerging consumer trends in personalization and sustainability-driven packaging.

Key Development

  • In March 2025, Visy launched a new beverage can averaging 83% recycled aluminium, part of the Re-In-Can-Ation project with Stone & Wood, Lion, Novelis, and Rio Tinto at its Yatala (Queensland) plant.
  • In October 2024, Visy completed upgrades at its Smithfield (NSW) facility, enabling the first local manufacturing of Sleek cans in Australia, with a capacity of over 3 million cans/day.

Key Companies

  • Ball Corporation
  • Crown Holdings
  • Visy
  • Orora Beverage
  • Biopineoe
  • Hiuier Pack

Scope of the Report

Item Value
Quantitative Units USD 6.3 Billion
By Material Aluminum, Steel, Tinplate, Composite Laminates (metal-plastic hybrids), Bio-based Coated Metals
By Capacity Small (150 ml - 250 ml), Medium (251 ml - 355 ml), Large (356 ml - 500 ml and above)
By Application Carbonated Soft Drinks, Energy Drinks, Alcoholic Beverages, Functional and Nutritional Drinks, Bottled Water, Ready-to-Drink Coffee and Tea
By End-Use Industry Food and Beverage Manufacturers, Breweries and Distilleries, Nutraceutical Brands, Retail and Supermarkets, Foodservice Sector
Key Companies Profiled Ball Corporation, Crown Holdings, Visy, Orora Beverage, Biopineoe, Hiuier Pack
Additional Attributes Rising demand for aluminum sleek cans due to recyclability and lightweight properties, strong growth in energy and functional drinks fueling medium-capacity can use, breweries and distilleries driving premiumization through design-focused sleek cans, increasing adoption of bio-based coated metals to align with sustainability initiatives, and expanding retail and foodservice distribution enhancing accessibility across global markets.

Key Segmentation

By Material:

  • Aluminum
  • Steel
  • Tinplate
  • Composite Laminates (metal-plastic hybrids)
  • Bio-based Coated Metals

By Capacity:

  • Small (150 ml - 250 ml)
  • Medium (251 ml - 355 ml)
  • Large (356 ml - 500 ml and above)

By Application:

  • Carbonated Soft Drinks
  • Energy Drinks
  • Alcoholic Beverages
  • Functional and Nutritional Drinks
  • Bottled Water
  • Ready-to-Drink Coffee and Tea

By End-Use Industry:

  • Food and Beverage Manufacturers
  • Breweries and Distilleries
  • Nutraceutical Brands
  • Retail and Supermarkets
  • Foodservice Sector

By Region:

  • North America
  • Europe
  • Asia-Pacific
  • Latin America
  • Middle East & Africa

Table of Content

  1. Executive Summary
    • Global Market Outlook
    • Demand-side Trends
    • Supply-side Trends
    • Technology Roadmap Analysis
    • Analysis and Recommendations
  2. Market Overview
    • Market Coverage / Taxonomy
    • Market Definition / Scope / Limitations
  3. Market Background
    • Market Dynamics
      • Drivers
      • Restraints
      • Opportunity
      • Trends
    • Scenario Forecast
      • Demand in Optimistic Scenario
      • Demand in Likely Scenario
      • Demand in Conservative Scenario
    • Opportunity Map Analysis
    • Product Life Cycle Analysis
    • Supply Chain Analysis
      • Supply Side Participants and their Roles
        • Producers
        • Mid-Level Participants (Traders/ Agents/ Brokers)
        • Wholesalers and Distributors
      • Value Added and Value Created at Node in the Supply Chain
      • List of Raw Material Suppliers
      • List of Existing and Potential Buyer’s
    • Investment Feasibility Matrix
    • Value Chain Analysis
      • Profit Margin Analysis
      • Wholesalers and Distributors
      • Retailers
    • PESTLE and Porter’s Analysis
    • Regulatory Landscape
      • By Key Regions
      • By Key Countries
    • Regional Parent Market Outlook
    • Production and Consumption Statistics
    • Import and Export Statistics
  4. Global Market Analysis 2020 to 2024 and Forecast, 2025 to 2035
    • Historical Market Size Value (USD Billion) & Volume (Units) Analysis, 2020 to 2024
    • Current and Future Market Size Value (USD Billion) & Volume (Units) Projections, 2025 to 2035
      • Y-o-Y Growth Trend Analysis
      • Absolute $ Opportunity Analysis
  5. Global Market Analysis 2020 to 2024 and Forecast 2025 to 2035, By Material
    • Introduction / Key Findings
    • Historical Market Size Value (USD Billion) & Volume (Units) Analysis By Material, 2020 to 2024
    • Current and Future Market Size Value (USD Billion) & Volume (Units) Analysis and Forecast By Material, 2025 to 2035
      • Aluminum
      • Steel
      • Tinplate
      • Composite Laminates (metal-plastic hybrids)
      • Bio-based Coated Metals
    • Y-o-Y Growth Trend Analysis By Material, 2020 to 2024
    • Absolute $ Opportunity Analysis By Material, 2025 to 2035
  6. Global Market Analysis 2020 to 2024 and Forecast 2025 to 2035, By Capacity
    • Introduction / Key Findings
    • Historical Market Size Value (USD Billion) & Volume (Units) Analysis By Capacity, 2020 to 2024
    • Current and Future Market Size Value (USD Billion) & Volume (Units) Analysis and Forecast By Capacity, 2025 to 2035
      • Small (150 ml - 250 ml)
      • Medium (251 ml - 355 ml)
      • Large (356 ml - 500 ml and above)
    • Y-o-Y Growth Trend Analysis By Capacity, 2020 to 2024
    • Absolute $ Opportunity Analysis By Capacity, 2025 to 2035
  7. Global Market Analysis 2020 to 2024 and Forecast 2025 to 2035, By Application
    • Introduction / Key Findings
    • Historical Market Size Value (USD Billion) & Volume (Units) Analysis By Application, 2020 to 2024
    • Current and Future Market Size Value (USD Billion) & Volume (Units) Analysis and Forecast By Application, 2025 to 2035
      • Carbonated Soft Drinks
      • Energy Drinks
      • Alcoholic Beverages
      • Functional and Nutritional Drinks
      • Bottled Water
      • Ready-to-Drink Coffee and Tea
    • Y-o-Y Growth Trend Analysis By Application, 2020 to 2024
    • Absolute $ Opportunity Analysis By Application, 2025 to 2035
  8. Global Market Analysis 2020 to 2024 and Forecast 2025 to 2035, By End-Use Industry
    • Introduction / Key Findings
    • Historical Market Size Value (USD Billion) & Volume (Units) Analysis By End-Use Industry, 2020 to 2024
    • Current and Future Market Size Value (USD Billion) & Volume (Units) Analysis and Forecast By End-Use Industry, 2025 to 2035
      • Food and Beverage Manufacturers
      • Breweries and Distilleries
      • Nutraceutical Brands
      • Retail and Supermarkets
      • Foodservice Sector
    • Y-o-Y Growth Trend Analysis By End-Use Industry, 2020 to 2024
    • Absolute $ Opportunity Analysis By End-Use Industry, 2025 to 2035
  9. Global Market Analysis 2020 to 2024 and Forecast 2025 to 2035, By Region
    • Introduction
    • Historical Market Size Value (USD Billion) & Volume (Units) Analysis By Region, 2020 to 2024
    • Current Market Size Value (USD Billion) & Volume (Units) Analysis and Forecast By Region, 2025 to 2035
      • North America
      • Latin America
      • East Asia
      • South Asia & Pacific
      • Western Europe
      • Eastern Europe
      • Middle East & Africa
    • Market Attractiveness Analysis By Region
  10. North America Market Analysis 2020 to 2024 and Forecast 2025 to 2035, By Country
    • Historical Market Size Value (USD Billion) & Volume (Units) Trend Analysis By Market Taxonomy, 2020 to 2024
    • Market Size Value (USD Billion) & Volume (Units) Forecast By Market Taxonomy, 2025 to 2035
      • By Country
        • USA
        • Canada
        • Mexico
      • By Material
      • By Capacity
      • By Application
      • By End-Use Industry
    • Market Attractiveness Analysis
      • By Country
      • By Material
      • By Capacity
      • By Application
      • By End-Use Industry
    • Key Takeaways
  11. Latin America Market Analysis 2020 to 2024 and Forecast 2025 to 2035, By Country
    • Historical Market Size Value (USD Billion) & Volume (Units) Trend Analysis By Market Taxonomy, 2020 to 2024
    • Market Size Value (USD Billion) & Volume (Units) Forecast By Market Taxonomy, 2025 to 2035
      • By Country
        • Brazil
        • Argentina
        • Rest of Latin America
      • By Material
      • By Capacity
      • By Application
      • By End-Use Industry
    • Market Attractiveness Analysis
      • By Country
      • By Material
      • By Capacity
      • By Application
      • By End-Use Industry
    • Key Takeaways
  12. East Asia Market Analysis 2020 to 2024 and Forecast 2025 to 2035, By Country
    • Historical Market Size Value (USD Billion) & Volume (Units) Trend Analysis By Market Taxonomy, 2020 to 2024
    • Market Size Value (USD Billion) & Volume (Units) Forecast By Market Taxonomy, 2025 to 2035
      • By Country
        • China
        • Japan
        • South Korea
      • By Material
      • By Capacity
      • By Application
      • By End-Use Industry
    • Market Attractiveness Analysis
      • By Country
      • By Material
      • By Capacity
      • By Application
      • By End-Use Industry
    • Key Takeaways
  13. South Asia & Pacific Market Analysis 2020 to 2024 and Forecast 2025 to 2035, By Country
    • Historical Market Size Value (USD Billion) & Volume (Units) Trend Analysis By Market Taxonomy, 2020 to 2024
    • Market Size Value (USD Billion) & Volume (Units) Forecast By Market Taxonomy, 2025 to 2035
      • By Country
        • India
        • ASEAN Countries
        • Australia& New Zealand
        • Rest of South Asia
      • By Material
      • By Capacity
      • By Application
      • By End-Use Industry
    • Market Attractiveness Analysis
      • By Country
      • By Material
      • By Capacity
      • By Application
      • By End-Use Industry
    • Key Takeaways
  14. Western Europe Market Analysis 2020 to 2024 and Forecast 2025 to 2035, By Country
    • Historical Market Size Value (USD Billion) & Volume (Units) Trend Analysis By Market Taxonomy, 2020 to 2024
    • Market Size Value (USD Billion) & Volume (Units) Forecast By Market Taxonomy, 2025 to 2035
      • By Country
        • Germany
        • UK
        • France
        • Italy
        • Spain
        • BENELUX
        • Nordic Countries
        • Rest of Western Europe
      • By Material
      • By Capacity
      • By Application
      • By End-Use Industry
    • Market Attractiveness Analysis
      • By Country
      • By Material
      • By Capacity
      • By Application
      • By End-Use Industry
    • Key Takeaways
  15. Eastern Europe Market Analysis 2020 to 2024 and Forecast 2025 to 2035, By Country
    • Historical Market Size Value (USD Billion) & Volume (Units) Trend Analysis By Market Taxonomy, 2020 to 2024
    • Market Size Value (USD Billion) & Volume (Units) Forecast By Market Taxonomy, 2025 to 2035
      • By Country
        • Russia
        • Hungary
        • Poland
        • Rest of Eastern Europe
      • By Material
      • By Capacity
      • By Application
      • By End-Use Industry
    • Market Attractiveness Analysis
      • By Country
      • By Material
      • By Capacity
      • By Application
      • By End-Use Industry
    • Key Takeaways
  16. Middle East & Africa Market Analysis 2020 to 2024 and Forecast 2025 to 2035, By Country
    • Historical Market Size Value (USD Billion) & Volume (Units) Trend Analysis By Market Taxonomy, 2020 to 2024
    • Market Size Value (USD Billion) & Volume (Units) Forecast By Market Taxonomy, 2025 to 2035
      • By Country
        • Saudi Arabia
        • Türkiye
        • South Africa
        • Other African Union
        • Rest of Middle East & Africa
      • By Material
      • By Capacity
      • By Application
      • By End-Use Industry
    • Market Attractiveness Analysis
      • By Country
      • By Material
      • By Capacity
      • By Application
      • By End-Use Industry
    • Key Takeaways
  17. Key Countries Market Analysis
    • USA
      • Pricing Analysis
      • Market Share Analysis, 2024
        • By Material
        • By Capacity
        • By Application
        • By End-Use Industry
    • Brazil
      • Pricing Analysis
      • Market Share Analysis, 2024
        • By Material
        • By Capacity
        • By Application
        • By End-Use Industry
    • China
      • Pricing Analysis
      • Market Share Analysis, 2024
        • By Material
        • By Capacity
        • By Application
        • By End-Use Industry
    • India
      • Pricing Analysis
      • Market Share Analysis, 2024
        • By Material
        • By Capacity
        • By Application
        • By End-Use Industry
    • Europe
      • Pricing Analysis
      • Market Share Analysis, 2024
        • By Material
        • By Capacity
        • By Application
        • By End-Use Industry
    • Germany
      • Pricing Analysis
      • Market Share Analysis, 2024
        • By Material
        • By Capacity
        • By Application
        • By End-Use Industry
    • France
      • Pricing Analysis
      • Market Share Analysis, 2024
        • By Material
        • By Capacity
        • By Application
        • By End-Use Industry
    • UK
      • Pricing Analysis
      • Market Share Analysis, 2024
        • By Material
        • By Capacity
        • By Application
        • By End-Use Industry
  18. Market Structure Analysis
    • Competition Dashboard
    • Competition Benchmarking
    • Market Share Analysis of Top Players
      • By Regional
      • By Material
      • By Capacity
      • By Application
      • By End-Use Industry
  19. Competition Analysis
    • Competition Deep Dive
      • Ball Corporation
        • Overview
        • Product Portfolio
        • Profitability by Market Segments (Product/Age /Sales Channel/Region)
        • Sales Footprint
        • Strategy Overview
          • Marketing Strategy
          • Product Strategy
          • Channel Strategy
      • Crown Holdings
        • Overview
        • Product Portfolio
        • Profitability by Market Segments (Product/Age /Sales Channel/Region)
        • Sales Footprint
        • Strategy Overview
          • Marketing Strategy
          • Product Strategy
          • Channel Strategy
      • Visy
        • Overview
        • Product Portfolio
        • Profitability by Market Segments (Product/Age /Sales Channel/Region)
        • Sales Footprint
        • Strategy Overview
          • Marketing Strategy
          • Product Strategy
          • Channel Strategy
      • Orora Beverage
        • Overview
        • Product Portfolio
        • Profitability by Market Segments (Product/Age /Sales Channel/Region)
        • Sales Footprint
        • Strategy Overview
          • Marketing Strategy
          • Product Strategy
          • Channel Strategy
      • Biopineoe
        • Overview
        • Product Portfolio
        • Profitability by Market Segments (Product/Age /Sales Channel/Region)
        • Sales Footprint
        • Strategy Overview
          • Marketing Strategy
          • Product Strategy
          • Channel Strategy
      • Hiuier Pack
        • Overview
        • Product Portfolio
        • Profitability by Market Segments (Product/Age /Sales Channel/Region)
        • Sales Footprint
        • Strategy Overview
          • Marketing Strategy
          • Product Strategy
          • Channel Strategy
  20. Assumptions & Acronyms Used
  21. Research Methodology

List of Tables

  • Table 1: Global Market Value (USD Billion) Forecast by Region, 2020-2035
  • Table 2: Global Market Volume (Units) Forecast by Region, 2020-2035
  • Table 3: Global Market Value (USD Billion) Forecast by Material, 2020-2035
  • Table 4: Global Market Volume (Units) Forecast by Material, 2020-2035
  • Table 5: Global Market Value (USD Billion) Forecast by Capacity, 2020-2035
  • Table 6: Global Market Volume (Units) Forecast by Capacity, 2020-2035
  • Table 7: Global Market Value (USD Billion) Forecast by Application, 2020-2035
  • Table 8: Global Market Volume (Units) Forecast by Application, 2020-2035
  • Table 9: Global Market Value (USD Billion) Forecast by End-Use Industry, 2020-2035
  • Table 10: Global Market Volume (Units) Forecast by End-Use Industry, 2020-2035
  • Table 11: North America Market Value (USD Billion) Forecast by Country, 2020-2035
  • Table 12: North America Market Volume (Units) Forecast by Country, 2020-2035
  • Table 13: North America Market Value (USD Billion) Forecast by Material, 2020-2035
  • Table 14: North America Market Volume (Units) Forecast by Material, 2020-2035
  • Table 15: North America Market Value (USD Billion) Forecast by Capacity, 2020-2035
  • Table 16: North America Market Volume (Units) Forecast by Capacity, 2020-2035
  • Table 17: North America Market Value (USD Billion) Forecast by Application, 2020-2035
  • Table 18: North America Market Volume (Units) Forecast by Application, 2020-2035
  • Table 19: North America Market Value (USD Billion) Forecast by End-Use Industry, 2020-2035
  • Table 20: North America Market Volume (Units) Forecast by End-Use Industry, 2020-2035
  • Table 21: Latin America Market Value (USD Billion) Forecast by Country, 2020-2035
  • Table 22: Latin America Market Volume (Units) Forecast by Country, 2020-2035
  • Table 23: Latin America Market Value (USD Billion) Forecast by Material, 2020-2035
  • Table 24: Latin America Market Volume (Units) Forecast by Material, 2020-2035
  • Table 25: Latin America Market Value (USD Billion) Forecast by Capacity, 2020-2035
  • Table 26: Latin America Market Volume (Units) Forecast by Capacity, 2020-2035
  • Table 27: Latin America Market Value (USD Billion) Forecast by Application, 2020-2035
  • Table 28: Latin America Market Volume (Units) Forecast by Application, 2020-2035
  • Table 29: Latin America Market Value (USD Billion) Forecast by End-Use Industry, 2020-2035
  • Table 30: Latin America Market Volume (Units) Forecast by End-Use Industry, 2020-2035
  • Table 31: East Asia Market Value (USD Billion) Forecast by Country, 2020-2035
  • Table 32: East Asia Market Volume (Units) Forecast by Country, 2020-2035
  • Table 33: East Asia Market Value (USD Billion) Forecast by Material, 2020-2035
  • Table 34: East Asia Market Volume (Units) Forecast by Material, 2020-2035
  • Table 35: East Asia Market Value (USD Billion) Forecast by Capacity, 2020-2035
  • Table 36: East Asia Market Volume (Units) Forecast by Capacity, 2020-2035
  • Table 37: East Asia Market Value (USD Billion) Forecast by Application, 2020-2035
  • Table 38: East Asia Market Volume (Units) Forecast by Application, 2020-2035
  • Table 39: East Asia Market Value (USD Billion) Forecast by End-Use Industry, 2020-2035
  • Table 40: East Asia Market Volume (Units) Forecast by End-Use Industry, 2020-2035
  • Table 41: South Asia & Pacific Market Value (USD Billion) Forecast by Country, 2020-2035
  • Table 42: South Asia & Pacific Market Volume (Units) Forecast by Country, 2020-2035
  • Table 43: South Asia & Pacific Market Value (USD Billion) Forecast by Material, 2020-2035
  • Table 44: South Asia & Pacific Market Volume (Units) Forecast by Material, 2020-2035
  • Table 45: South Asia & Pacific Market Value (USD Billion) Forecast by Capacity, 2020-2035
  • Table 46: South Asia & Pacific Market Volume (Units) Forecast by Capacity, 2020-2035
  • Table 47: South Asia & Pacific Market Value (USD Billion) Forecast by Application, 2020-2035
  • Table 48: South Asia & Pacific Market Volume (Units) Forecast by Application, 2020-2035
  • Table 49: South Asia & Pacific Market Value (USD Billion) Forecast by End-Use Industry, 2020-2035
  • Table 50: South Asia & Pacific Market Volume (Units) Forecast by End-Use Industry, 2020-2035
  • Table 51: Western Europe Market Value (USD Billion) Forecast by Country, 2020-2035
  • Table 52: Western Europe Market Volume (Units) Forecast by Country, 2020-2035
  • Table 53: Western Europe Market Value (USD Billion) Forecast by Material, 2020-2035
  • Table 54: Western Europe Market Volume (Units) Forecast by Material, 2020-2035
  • Table 55: Western Europe Market Value (USD Billion) Forecast by Capacity, 2020-2035
  • Table 56: Western Europe Market Volume (Units) Forecast by Capacity, 2020-2035
  • Table 57: Western Europe Market Value (USD Billion) Forecast by Application, 2020-2035
  • Table 58: Western Europe Market Volume (Units) Forecast by Application, 2020-2035
  • Table 59: Western Europe Market Value (USD Billion) Forecast by End-Use Industry, 2020-2035
  • Table 60: Western Europe Market Volume (Units) Forecast by End-Use Industry, 2020-2035
  • Table 61: Eastern Europe Market Value (USD Billion) Forecast by Country, 2020-2035
  • Table 62: Eastern Europe Market Volume (Units) Forecast by Country, 2020-2035
  • Table 63: Eastern Europe Market Value (USD Billion) Forecast by Material, 2020-2035
  • Table 64: Eastern Europe Market Volume (Units) Forecast by Material, 2020-2035
  • Table 65: Eastern Europe Market Value (USD Billion) Forecast by Capacity, 2020-2035
  • Table 66: Eastern Europe Market Volume (Units) Forecast by Capacity, 2020-2035
  • Table 67: Eastern Europe Market Value (USD Billion) Forecast by Application, 2020-2035
  • Table 68: Eastern Europe Market Volume (Units) Forecast by Application, 2020-2035
  • Table 69: Eastern Europe Market Value (USD Billion) Forecast by End-Use Industry, 2020-2035
  • Table 70: Eastern Europe Market Volume (Units) Forecast by End-Use Industry, 2020-2035
  • Table 71: Middle East & Africa Market Value (USD Billion) Forecast by Country, 2020-2035
  • Table 72: Middle East & Africa Market Volume (Units) Forecast by Country, 2020-2035
  • Table 73: Middle East & Africa Market Value (USD Billion) Forecast by Material, 2020-2035
  • Table 74: Middle East & Africa Market Volume (Units) Forecast by Material, 2020-2035
  • Table 75: Middle East & Africa Market Value (USD Billion) Forecast by Capacity, 2020-2035
  • Table 76: Middle East & Africa Market Volume (Units) Forecast by Capacity, 2020-2035
  • Table 77: Middle East & Africa Market Value (USD Billion) Forecast by Application, 2020-2035
  • Table 78: Middle East & Africa Market Volume (Units) Forecast by Application, 2020-2035
  • Table 79: Middle East & Africa Market Value (USD Billion) Forecast by End-Use Industry, 2020-2035
  • Table 80: Middle East & Africa Market Volume (Units) Forecast by End-Use Industry, 2020-2035

List of Figures

  • Figure 1: Global Market Value (USD Billion) by Material, 2025-2035
  • Figure 2: Global Market Value (USD Billion) by Capacity, 2025-2035
  • Figure 3: Global Market Value (USD Billion) by Application, 2025-2035
  • Figure 4: Global Market Value (USD Billion) by End-Use Industry, 2025-2035
  • Figure 5: Global Market Value (USD Billion) by Region, 2025-2035
  • Figure 6: Global Market Value (USD Billion) Analysis by Region, 2020-2035
  • Figure 7: Global Market Volume (Units) Analysis by Region, 2020-2035
  • Figure 8: Global Market Value Share (%) and BPS Analysis by Region, 2025-2035
  • Figure 9: Global Market Y-o-Y Growth (%) Projections by Region, 2025-2035
  • Figure 10: Global Market Value (USD Billion) Analysis by Material, 2020-2035
  • Figure 11: Global Market Volume (Units) Analysis by Material, 2020-2035
  • Figure 12: Global Market Value Share (%) and BPS Analysis by Material, 2025-2035
  • Figure 13: Global Market Y-o-Y Growth (%) Projections by Material, 2025-2035
  • Figure 14: Global Market Value (USD Billion) Analysis by Capacity, 2020-2035
  • Figure 15: Global Market Volume (Units) Analysis by Capacity, 2020-2035
  • Figure 16: Global Market Value Share (%) and BPS Analysis by Capacity, 2025-2035
  • Figure 17: Global Market Y-o-Y Growth (%) Projections by Capacity, 2025-2035
  • Figure 18: Global Market Value (USD Billion) Analysis by Application, 2020-2035
  • Figure 19: Global Market Volume (Units) Analysis by Application, 2020-2035
  • Figure 20: Global Market Value Share (%) and BPS Analysis by Application, 2025-2035
  • Figure 21: Global Market Y-o-Y Growth (%) Projections by Application, 2025-2035
  • Figure 22: Global Market Value (USD Billion) Analysis by End-Use Industry, 2020-2035
  • Figure 23: Global Market Volume (Units) Analysis by End-Use Industry, 2020-2035
  • Figure 24: Global Market Value Share (%) and BPS Analysis by End-Use Industry, 2025-2035
  • Figure 25: Global Market Y-o-Y Growth (%) Projections by End-Use Industry, 2025-2035
  • Figure 26: Global Market Attractiveness by Material, 2025-2035
  • Figure 27: Global Market Attractiveness by Capacity, 2025-2035
  • Figure 28: Global Market Attractiveness by Application, 2025-2035
  • Figure 29: Global Market Attractiveness by End-Use Industry, 2025-2035
  • Figure 30: Global Market Attractiveness by Region, 2025-2035
  • Figure 31: North America Market Value (USD Billion) by Material, 2025-2035
  • Figure 32: North America Market Value (USD Billion) by Capacity, 2025-2035
  • Figure 33: North America Market Value (USD Billion) by Application, 2025-2035
  • Figure 34: North America Market Value (USD Billion) by End-Use Industry, 2025-2035
  • Figure 35: North America Market Value (USD Billion) by Country, 2025-2035
  • Figure 36: North America Market Value (USD Billion) Analysis by Country, 2020-2035
  • Figure 37: North America Market Volume (Units) Analysis by Country, 2020-2035
  • Figure 38: North America Market Value Share (%) and BPS Analysis by Country, 2025-2035
  • Figure 39: North America Market Y-o-Y Growth (%) Projections by Country, 2025-2035
  • Figure 40: North America Market Value (USD Billion) Analysis by Material, 2020-2035
  • Figure 41: North America Market Volume (Units) Analysis by Material, 2020-2035
  • Figure 42: North America Market Value Share (%) and BPS Analysis by Material, 2025-2035
  • Figure 43: North America Market Y-o-Y Growth (%) Projections by Material, 2025-2035
  • Figure 44: North America Market Value (USD Billion) Analysis by Capacity, 2020-2035
  • Figure 45: North America Market Volume (Units) Analysis by Capacity, 2020-2035
  • Figure 46: North America Market Value Share (%) and BPS Analysis by Capacity, 2025-2035
  • Figure 47: North America Market Y-o-Y Growth (%) Projections by Capacity, 2025-2035
  • Figure 48: North America Market Value (USD Billion) Analysis by Application, 2020-2035
  • Figure 49: North America Market Volume (Units) Analysis by Application, 2020-2035
  • Figure 50: North America Market Value Share (%) and BPS Analysis by Application, 2025-2035
  • Figure 51: North America Market Y-o-Y Growth (%) Projections by Application, 2025-2035
  • Figure 52: North America Market Value (USD Billion) Analysis by End-Use Industry, 2020-2035
  • Figure 53: North America Market Volume (Units) Analysis by End-Use Industry, 2020-2035
  • Figure 54: North America Market Value Share (%) and BPS Analysis by End-Use Industry, 2025-2035
  • Figure 55: North America Market Y-o-Y Growth (%) Projections by End-Use Industry, 2025-2035
  • Figure 56: North America Market Attractiveness by Material, 2025-2035
  • Figure 57: North America Market Attractiveness by Capacity, 2025-2035
  • Figure 58: North America Market Attractiveness by Application, 2025-2035
  • Figure 59: North America Market Attractiveness by End-Use Industry, 2025-2035
  • Figure 60: North America Market Attractiveness by Country, 2025-2035
  • Figure 61: Latin America Market Value (USD Billion) by Material, 2025-2035
  • Figure 62: Latin America Market Value (USD Billion) by Capacity, 2025-2035
  • Figure 63: Latin America Market Value (USD Billion) by Application, 2025-2035
  • Figure 64: Latin America Market Value (USD Billion) by End-Use Industry, 2025-2035
  • Figure 65: Latin America Market Value (USD Billion) by Country, 2025-2035
  • Figure 66: Latin America Market Value (USD Billion) Analysis by Country, 2020-2035
  • Figure 67: Latin America Market Volume (Units) Analysis by Country, 2020-2035
  • Figure 68: Latin America Market Value Share (%) and BPS Analysis by Country, 2025-2035
  • Figure 69: Latin America Market Y-o-Y Growth (%) Projections by Country, 2025-2035
  • Figure 70: Latin America Market Value (USD Billion) Analysis by Material, 2020-2035
  • Figure 71: Latin America Market Volume (Units) Analysis by Material, 2020-2035
  • Figure 72: Latin America Market Value Share (%) and BPS Analysis by Material, 2025-2035
  • Figure 73: Latin America Market Y-o-Y Growth (%) Projections by Material, 2025-2035
  • Figure 74: Latin America Market Value (USD Billion) Analysis by Capacity, 2020-2035
  • Figure 75: Latin America Market Volume (Units) Analysis by Capacity, 2020-2035
  • Figure 76: Latin America Market Value Share (%) and BPS Analysis by Capacity, 2025-2035
  • Figure 77: Latin America Market Y-o-Y Growth (%) Projections by Capacity, 2025-2035
  • Figure 78: Latin America Market Value (USD Billion) Analysis by Application, 2020-2035
  • Figure 79: Latin America Market Volume (Units) Analysis by Application, 2020-2035
  • Figure 80: Latin America Market Value Share (%) and BPS Analysis by Application, 2025-2035
  • Figure 81: Latin America Market Y-o-Y Growth (%) Projections by Application, 2025-2035
  • Figure 82: Latin America Market Value (USD Billion) Analysis by End-Use Industry, 2020-2035
  • Figure 83: Latin America Market Volume (Units) Analysis by End-Use Industry, 2020-2035
  • Figure 84: Latin America Market Value Share (%) and BPS Analysis by End-Use Industry, 2025-2035
  • Figure 85: Latin America Market Y-o-Y Growth (%) Projections by End-Use Industry, 2025-2035
  • Figure 86: Latin America Market Attractiveness by Material, 2025-2035
  • Figure 87: Latin America Market Attractiveness by Capacity, 2025-2035
  • Figure 88: Latin America Market Attractiveness by Application, 2025-2035
  • Figure 89: Latin America Market Attractiveness by End-Use Industry, 2025-2035
  • Figure 90: Latin America Market Attractiveness by Country, 2025-2035
  • Figure 91: East Asia Market Value (USD Billion) by Material, 2025-2035
  • Figure 92: East Asia Market Value (USD Billion) by Capacity, 2025-2035
  • Figure 93: East Asia Market Value (USD Billion) by Application, 2025-2035
  • Figure 94: East Asia Market Value (USD Billion) by End-Use Industry, 2025-2035
  • Figure 95: East Asia Market Value (USD Billion) by Country, 2025-2035
  • Figure 96: East Asia Market Value (USD Billion) Analysis by Country, 2020-2035
  • Figure 97: East Asia Market Volume (Units) Analysis by Country, 2020-2035
  • Figure 98: East Asia Market Value Share (%) and BPS Analysis by Country, 2025-2035
  • Figure 99: East Asia Market Y-o-Y Growth (%) Projections by Country, 2025-2035
  • Figure 100: East Asia Market Value (USD Billion) Analysis by Material, 2020-2035
  • Figure 101: East Asia Market Volume (Units) Analysis by Material, 2020-2035
  • Figure 102: East Asia Market Value Share (%) and BPS Analysis by Material, 2025-2035
  • Figure 103: East Asia Market Y-o-Y Growth (%) Projections by Material, 2025-2035
  • Figure 104: East Asia Market Value (USD Billion) Analysis by Capacity, 2020-2035
  • Figure 105: East Asia Market Volume (Units) Analysis by Capacity, 2020-2035
  • Figure 106: East Asia Market Value Share (%) and BPS Analysis by Capacity, 2025-2035
  • Figure 107: East Asia Market Y-o-Y Growth (%) Projections by Capacity, 2025-2035
  • Figure 108: East Asia Market Value (USD Billion) Analysis by Application, 2020-2035
  • Figure 109: East Asia Market Volume (Units) Analysis by Application, 2020-2035
  • Figure 110: East Asia Market Value Share (%) and BPS Analysis by Application, 2025-2035
  • Figure 111: East Asia Market Y-o-Y Growth (%) Projections by Application, 2025-2035
  • Figure 112: East Asia Market Value (USD Billion) Analysis by End-Use Industry, 2020-2035
  • Figure 113: East Asia Market Volume (Units) Analysis by End-Use Industry, 2020-2035
  • Figure 114: East Asia Market Value Share (%) and BPS Analysis by End-Use Industry, 2025-2035
  • Figure 115: East Asia Market Y-o-Y Growth (%) Projections by End-Use Industry, 2025-2035
  • Figure 116: East Asia Market Attractiveness by Material, 2025-2035
  • Figure 117: East Asia Market Attractiveness by Capacity, 2025-2035
  • Figure 118: East Asia Market Attractiveness by Application, 2025-2035
  • Figure 119: East Asia Market Attractiveness by End-Use Industry, 2025-2035
  • Figure 120: East Asia Market Attractiveness by Country, 2025-2035
  • Figure 121: South Asia & Pacific Market Value (USD Billion) by Material, 2025-2035
  • Figure 122: South Asia & Pacific Market Value (USD Billion) by Capacity, 2025-2035
  • Figure 123: South Asia & Pacific Market Value (USD Billion) by Application, 2025-2035
  • Figure 124: South Asia & Pacific Market Value (USD Billion) by End-Use Industry, 2025-2035
  • Figure 125: South Asia & Pacific Market Value (USD Billion) by Country, 2025-2035
  • Figure 126: South Asia & Pacific Market Value (USD Billion) Analysis by Country, 2020-2035
  • Figure 127: South Asia & Pacific Market Volume (Units) Analysis by Country, 2020-2035
  • Figure 128: South Asia & Pacific Market Value Share (%) and BPS Analysis by Country, 2025-2035
  • Figure 129: South Asia & Pacific Market Y-o-Y Growth (%) Projections by Country, 2025-2035
  • Figure 130: South Asia & Pacific Market Value (USD Billion) Analysis by Material, 2020-2035
  • Figure 131: South Asia & Pacific Market Volume (Units) Analysis by Material, 2020-2035
  • Figure 132: South Asia & Pacific Market Value Share (%) and BPS Analysis by Material, 2025-2035
  • Figure 133: South Asia & Pacific Market Y-o-Y Growth (%) Projections by Material, 2025-2035
  • Figure 134: South Asia & Pacific Market Value (USD Billion) Analysis by Capacity, 2020-2035
  • Figure 135: South Asia & Pacific Market Volume (Units) Analysis by Capacity, 2020-2035
  • Figure 136: South Asia & Pacific Market Value Share (%) and BPS Analysis by Capacity, 2025-2035
  • Figure 137: South Asia & Pacific Market Y-o-Y Growth (%) Projections by Capacity, 2025-2035
  • Figure 138: South Asia & Pacific Market Value (USD Billion) Analysis by Application, 2020-2035
  • Figure 139: South Asia & Pacific Market Volume (Units) Analysis by Application, 2020-2035
  • Figure 140: South Asia & Pacific Market Value Share (%) and BPS Analysis by Application, 2025-2035
  • Figure 141: South Asia & Pacific Market Y-o-Y Growth (%) Projections by Application, 2025-2035
  • Figure 142: South Asia & Pacific Market Value (USD Billion) Analysis by End-Use Industry, 2020-2035
  • Figure 143: South Asia & Pacific Market Volume (Units) Analysis by End-Use Industry, 2020-2035
  • Figure 144: South Asia & Pacific Market Value Share (%) and BPS Analysis by End-Use Industry, 2025-2035
  • Figure 145: South Asia & Pacific Market Y-o-Y Growth (%) Projections by End-Use Industry, 2025-2035
  • Figure 146: South Asia & Pacific Market Attractiveness by Material, 2025-2035
  • Figure 147: South Asia & Pacific Market Attractiveness by Capacity, 2025-2035
  • Figure 148: South Asia & Pacific Market Attractiveness by Application, 2025-2035
  • Figure 149: South Asia & Pacific Market Attractiveness by End-Use Industry, 2025-2035
  • Figure 150: South Asia & Pacific Market Attractiveness by Country, 2025-2035
  • Figure 151: Western Europe Market Value (USD Billion) by Material, 2025-2035
  • Figure 152: Western Europe Market Value (USD Billion) by Capacity, 2025-2035
  • Figure 153: Western Europe Market Value (USD Billion) by Application, 2025-2035
  • Figure 154: Western Europe Market Value (USD Billion) by End-Use Industry, 2025-2035
  • Figure 155: Western Europe Market Value (USD Billion) by Country, 2025-2035
  • Figure 156: Western Europe Market Value (USD Billion) Analysis by Country, 2020-2035
  • Figure 157: Western Europe Market Volume (Units) Analysis by Country, 2020-2035
  • Figure 158: Western Europe Market Value Share (%) and BPS Analysis by Country, 2025-2035
  • Figure 159: Western Europe Market Y-o-Y Growth (%) Projections by Country, 2025-2035
  • Figure 160: Western Europe Market Value (USD Billion) Analysis by Material, 2020-2035
  • Figure 161: Western Europe Market Volume (Units) Analysis by Material, 2020-2035
  • Figure 162: Western Europe Market Value Share (%) and BPS Analysis by Material, 2025-2035
  • Figure 163: Western Europe Market Y-o-Y Growth (%) Projections by Material, 2025-2035
  • Figure 164: Western Europe Market Value (USD Billion) Analysis by Capacity, 2020-2035
  • Figure 165: Western Europe Market Volume (Units) Analysis by Capacity, 2020-2035
  • Figure 166: Western Europe Market Value Share (%) and BPS Analysis by Capacity, 2025-2035
  • Figure 167: Western Europe Market Y-o-Y Growth (%) Projections by Capacity, 2025-2035
  • Figure 168: Western Europe Market Value (USD Billion) Analysis by Application, 2020-2035
  • Figure 169: Western Europe Market Volume (Units) Analysis by Application, 2020-2035
  • Figure 170: Western Europe Market Value Share (%) and BPS Analysis by Application, 2025-2035
  • Figure 171: Western Europe Market Y-o-Y Growth (%) Projections by Application, 2025-2035
  • Figure 172: Western Europe Market Value (USD Billion) Analysis by End-Use Industry, 2020-2035
  • Figure 173: Western Europe Market Volume (Units) Analysis by End-Use Industry, 2020-2035
  • Figure 174: Western Europe Market Value Share (%) and BPS Analysis by End-Use Industry, 2025-2035
  • Figure 175: Western Europe Market Y-o-Y Growth (%) Projections by End-Use Industry, 2025-2035
  • Figure 176: Western Europe Market Attractiveness by Material, 2025-2035
  • Figure 177: Western Europe Market Attractiveness by Capacity, 2025-2035
  • Figure 178: Western Europe Market Attractiveness by Application, 2025-2035
  • Figure 179: Western Europe Market Attractiveness by End-Use Industry, 2025-2035
  • Figure 180: Western Europe Market Attractiveness by Country, 2025-2035
  • Figure 181: Eastern Europe Market Value (USD Billion) by Material, 2025-2035
  • Figure 182: Eastern Europe Market Value (USD Billion) by Capacity, 2025-2035
  • Figure 183: Eastern Europe Market Value (USD Billion) by Application, 2025-2035
  • Figure 184: Eastern Europe Market Value (USD Billion) by End-Use Industry, 2025-2035
  • Figure 185: Eastern Europe Market Value (USD Billion) by Country, 2025-2035
  • Figure 186: Eastern Europe Market Value (USD Billion) Analysis by Country, 2020-2035
  • Figure 187: Eastern Europe Market Volume (Units) Analysis by Country, 2020-2035
  • Figure 188: Eastern Europe Market Value Share (%) and BPS Analysis by Country, 2025-2035
  • Figure 189: Eastern Europe Market Y-o-Y Growth (%) Projections by Country, 2025-2035
  • Figure 190: Eastern Europe Market Value (USD Billion) Analysis by Material, 2020-2035
  • Figure 191: Eastern Europe Market Volume (Units) Analysis by Material, 2020-2035
  • Figure 192: Eastern Europe Market Value Share (%) and BPS Analysis by Material, 2025-2035
  • Figure 193: Eastern Europe Market Y-o-Y Growth (%) Projections by Material, 2025-2035
  • Figure 194: Eastern Europe Market Value (USD Billion) Analysis by Capacity, 2020-2035
  • Figure 195: Eastern Europe Market Volume (Units) Analysis by Capacity, 2020-2035
  • Figure 196: Eastern Europe Market Value Share (%) and BPS Analysis by Capacity, 2025-2035
  • Figure 197: Eastern Europe Market Y-o-Y Growth (%) Projections by Capacity, 2025-2035
  • Figure 198: Eastern Europe Market Value (USD Billion) Analysis by Application, 2020-2035
  • Figure 199: Eastern Europe Market Volume (Units) Analysis by Application, 2020-2035
  • Figure 200: Eastern Europe Market Value Share (%) and BPS Analysis by Application, 2025-2035
  • Figure 201: Eastern Europe Market Y-o-Y Growth (%) Projections by Application, 2025-2035
  • Figure 202: Eastern Europe Market Value (USD Billion) Analysis by End-Use Industry, 2020-2035
  • Figure 203: Eastern Europe Market Volume (Units) Analysis by End-Use Industry, 2020-2035
  • Figure 204: Eastern Europe Market Value Share (%) and BPS Analysis by End-Use Industry, 2025-2035
  • Figure 205: Eastern Europe Market Y-o-Y Growth (%) Projections by End-Use Industry, 2025-2035
  • Figure 206: Eastern Europe Market Attractiveness by Material, 2025-2035
  • Figure 207: Eastern Europe Market Attractiveness by Capacity, 2025-2035
  • Figure 208: Eastern Europe Market Attractiveness by Application, 2025-2035
  • Figure 209: Eastern Europe Market Attractiveness by End-Use Industry, 2025-2035
  • Figure 210: Eastern Europe Market Attractiveness by Country, 2025-2035
  • Figure 211: Middle East & Africa Market Value (USD Billion) by Material, 2025-2035
  • Figure 212: Middle East & Africa Market Value (USD Billion) by Capacity, 2025-2035
  • Figure 213: Middle East & Africa Market Value (USD Billion) by Application, 2025-2035
  • Figure 214: Middle East & Africa Market Value (USD Billion) by End-Use Industry, 2025-2035
  • Figure 215: Middle East & Africa Market Value (USD Billion) by Country, 2025-2035
  • Figure 216: Middle East & Africa Market Value (USD Billion) Analysis by Country, 2020-2035
  • Figure 217: Middle East & Africa Market Volume (Units) Analysis by Country, 2020-2035
  • Figure 218: Middle East & Africa Market Value Share (%) and BPS Analysis by Country, 2025-2035
  • Figure 219: Middle East & Africa Market Y-o-Y Growth (%) Projections by Country, 2025-2035
  • Figure 220: Middle East & Africa Market Value (USD Billion) Analysis by Material, 2020-2035
  • Figure 221: Middle East & Africa Market Volume (Units) Analysis by Material, 2020-2035
  • Figure 222: Middle East & Africa Market Value Share (%) and BPS Analysis by Material, 2025-2035
  • Figure 223: Middle East & Africa Market Y-o-Y Growth (%) Projections by Material, 2025-2035
  • Figure 224: Middle East & Africa Market Value (USD Billion) Analysis by Capacity, 2020-2035
  • Figure 225: Middle East & Africa Market Volume (Units) Analysis by Capacity, 2020-2035
  • Figure 226: Middle East & Africa Market Value Share (%) and BPS Analysis by Capacity, 2025-2035
  • Figure 227: Middle East & Africa Market Y-o-Y Growth (%) Projections by Capacity, 2025-2035
  • Figure 228: Middle East & Africa Market Value (USD Billion) Analysis by Application, 2020-2035
  • Figure 229: Middle East & Africa Market Volume (Units) Analysis by Application, 2020-2035
  • Figure 230: Middle East & Africa Market Value Share (%) and BPS Analysis by Application, 2025-2035
  • Figure 231: Middle East & Africa Market Y-o-Y Growth (%) Projections by Application, 2025-2035
  • Figure 232: Middle East & Africa Market Value (USD Billion) Analysis by End-Use Industry, 2020-2035
  • Figure 233: Middle East & Africa Market Volume (Units) Analysis by End-Use Industry, 2020-2035
  • Figure 234: Middle East & Africa Market Value Share (%) and BPS Analysis by End-Use Industry, 2025-2035
  • Figure 235: Middle East & Africa Market Y-o-Y Growth (%) Projections by End-Use Industry, 2025-2035
  • Figure 236: Middle East & Africa Market Attractiveness by Material, 2025-2035
  • Figure 237: Middle East & Africa Market Attractiveness by Capacity, 2025-2035
  • Figure 238: Middle East & Africa Market Attractiveness by Application, 2025-2035
  • Figure 239: Middle East & Africa Market Attractiveness by End-Use Industry, 2025-2035
  • Figure 240: Middle East & Africa Market Attractiveness by Country, 2025-2035

Frequently Asked Questions

How big is the sleek can market in 2025?

The global sleek can market is estimated to be valued at USD 6.3 billion in 2025.

What will be the size of the sleek can market in 2035?

The market size for the sleek can market is projected to reach USD 9.5 billion by 2035.

How much will be the sleek can market growth between 2025 and 2035?

The sleek can market is expected to grow at a CAGR of 4.2% between 2025 and 2035.

What are the key materials in the sleek can market?

The key materials in the sleek can market include aluminum, steel, tinplate, composite laminates (metal-plastic hybrids), and bio-based coated metals.

Which material segment is expected to contribute significant share in the sleek can market in 2025?

The aluminum segment is expected to account for the highest share of 68.7% in the sleek can market in 2025.

Explore Similar Insights

Future Market Insights

Sleek Can Market