Stubby Can Market Size and Share Forecast Outlook 2025 to 2035

The stubby can market will expand from USD 1.5 billion in 2025 to USD 3.0 billion by 2035, doubling in value with a CAGR of 7.2%. This growth underscores strong consumer preference for sustainable, compact, and brand-differentiated beverage packaging. The industry will advance by a 2.0 multiple over the forecast period.
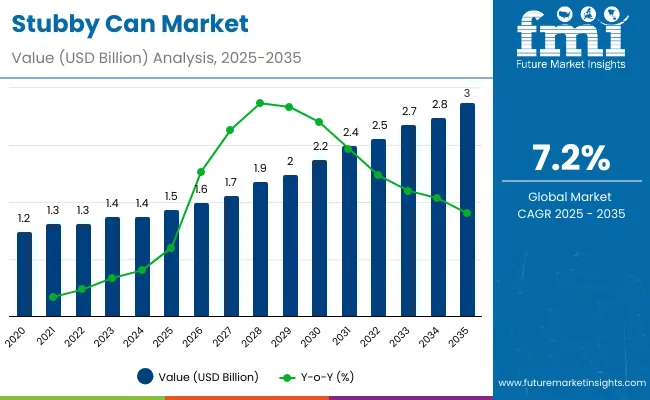
Quick Stats for Stubby Can Market

  • Market Value (2025): USD 1.5 billion
  • Market Forecast Value (2035): USD 3.0 billion
  • Market Forecast CAGR: 7.2%
  • Leading Segment in 2025: Aluminum material segment (48.2%)
  • Key Growth Regions: Asia-Pacific (Japan leading at 7.9% CAGR)
  • Top Key Players: Hainan Hiuier Industrial Co., Erjin Pack, Hefei Biopin Import & Export Trading, Qingdao BaiXi Industry, Axton Aluminum

Stubby Can Market

Metric Value
Industry Size (2025E) USD 1.5 billion
Industry Value (2035F) USD 3.0 billion
CAGR (2025 to 2035) 7.2%

From 2025 to 2030, the market will increase from USD 1.5 billion to USD 2.1 billion, adding USD 0.6 billion or 40% of the decade’s growth. This phase reflects rising consumption of beer, carbonated soft drinks, and functional beverages in smaller serving sizes. Aluminum’s recyclability and shelf-life properties enhance its adoption by beverage companies and retailers.

Between 2030 and 2035, the market will expand from USD 2.1 billion to USD 3.0 billion, contributing USD 0.9 billion or 60% of decade growth. This period is defined by rapid adoption of recyclable aluminum, branding differentiation, and expansion of energy and RTD coffee applications. Lightweight formats and digital printing drive competitive momentum.

From 2020 to 2024, the stubby can market expanded steadily due to strong beer consumption, premiumization trends, and adoption of recyclable formats. Aluminum accounted for most revenues, with beverage manufacturers favoring its lightweighting and superior preservation properties. Companies emphasized branding differentiation through high-definition printing and novel shapes. Tinplate and composites played secondary roles, with uptake concentrated in specialty beverage niches.

By 2035, the market will reach USD 3.0 billion at a CAGR of 7.2%, led by aluminum stubby cans representing nearly half of the total value. Competitive intensity will grow as companies deliver innovative designs, recyclable coatings, and smart packaging solutions. Automation-ready manufacturing, eco-certifications, and hybrid aluminum composites will define the competitive edge. Asia-Pacific will lead demand, while developed markets strengthen adoption through premium positioning.

Why the Stubby Can Market is Growing?

The stubby can market is expanding because of sustainability, portability, and consumer preference for compact packaging formats. Aluminum leads due to its infinite recyclability and ability to protect beverage quality, while medium-sized cans align with portion-control trends. Rising alcohol and soft drink demand supports consistent adoption.

Marketing and differentiation also drive growth, as breweries and beverage companies use stubby cans for branding appeal. Expansion of RTD coffee and energy drinks contributes to versatility in application. With global beverage consumption rising, stubby cans are becoming the preferred choice for convenience and eco-friendly appeal.

Segmental Overview

The stubby can market is segmented based on material, capacity, application, and end-use industry. Materials include aluminum, steel, tinplate, recycled aluminum, and composite laminates. Capacity categories are small (150 ml-250 ml), medium (251 ml-355 ml), and large (356 ml-500 ml and above). Applications span carbonated soft drinks, beer and alcoholic beverages, energy drinks, functional and nutritional drinks, and ready-to-drink coffee and tea. End-use industries include food and beverage manufacturers, breweries and distilleries, nutraceutical brands, retail and supermarkets, and the foodservice sector.
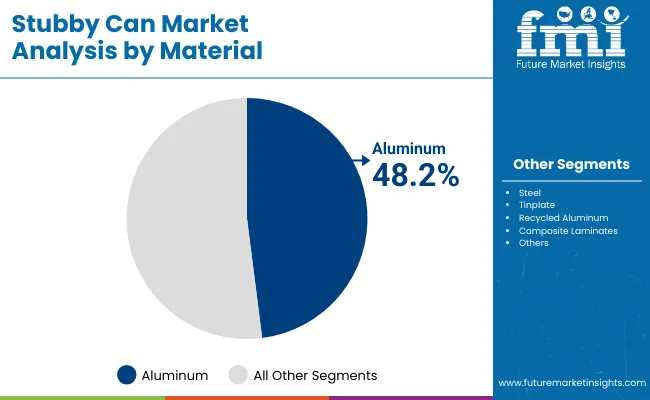
Aluminum Dominates with Recyclability and Preservation Benefits

Stubby Can Market By Material

Aluminum will account for 48.2% of the market in 2025 due to its strength, lightweight nature, and infinite recyclability. Beverage manufacturers prefer aluminum for its superior barrier properties, ensuring longer shelf life and maintaining carbonation in soft drinks and alcoholic beverages. Its alignment with global sustainability goals reinforces its position as the most adopted material.

Further growth of aluminum stubby cans is supported by circular economy practices and consumer demand for eco-friendly choices. Recycled aluminum solutions are becoming integral to beverage packaging portfolios, while innovation in coatings ensures safety and freshness. Aluminum’s adaptability for premium designs and high-speed production machinery consolidates its leadership through 2035.
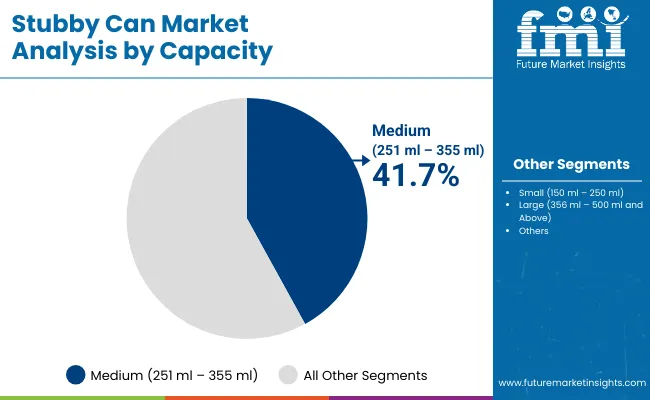
Medium Capacity Cans Align with Consumer Preference

Stubby Can Market By Capacity

Medium-capacity cans (251-355 ml) are projected to account for 41.7% of demand in 2025. Their popularity reflects consumer preference for portion control, on-the-go convenience, and versatility across beverage types. Breweries and carbonated soft drink companies rely on medium cans for branding and affordability, enhancing their position as the leading capacity category.

Growth is reinforced by adoption in energy drinks and functional beverages. Medium cans strike a balance between affordability and sustainability while meeting global consumer lifestyles. Enhanced printing technologies allow greater brand visibility, making medium-sized stubby cans central to competitive differentiation in the beverage market.
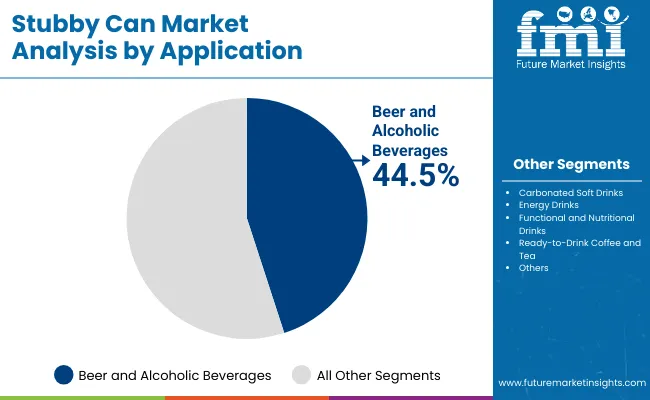
Beer and Alcoholic Beverages Lead Application Demand

Stubby Can Market By Application

Beer and alcoholic beverages will account for 44.5% of demand in 2025. Stubby cans are favored in this segment for their portability, branding flexibility, and recyclability. Their compatibility with cold-chain storage and retail-ready presentation ensures continued adoption by breweries and distilleries worldwide.

The segment will benefit from premiumization, with breweries adopting stubby cans for limited editions and craft beer launches. Expansion of alcoholic beverage markets in Asia-Pacific and Latin America reinforces demand. Branding, durability, and global recycling systems ensure stubby cans remain dominant in alcoholic beverage packaging.
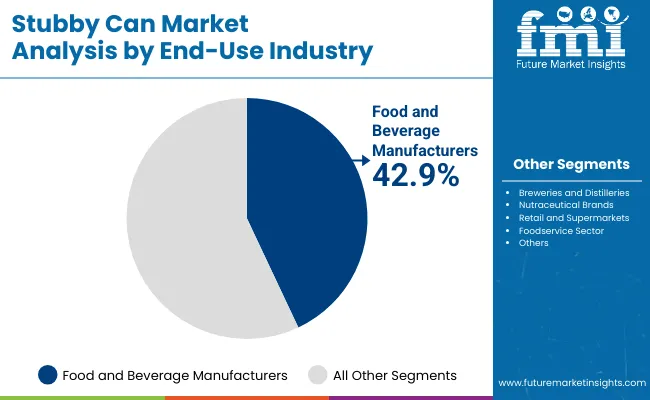
Food and Beverage Manufacturers Dominate End-Use Industry

Stubby Can Market By End Use

Food and beverage manufacturers will contribute 42.9% of market demand in 2025. Their large-scale production and reliance on recyclable, cost-effective packaging sustain demand for stubby cans. Beverage brands use cans as a medium to ensure quality, extend shelf life, and enhance consumer trust.

The segment’s leadership is reinforced by integration of automation and eco-labeling, making stubby cans ideal for large beverage corporations. Expansion of health-oriented drinks also encourages manufacturers to adopt stubby cans for functional products. With emphasis on branding and compliance, manufacturers will remain the core drivers of industry adoption.

Drivers, Restraints, and Key Trends of the Stubby Can Market

The stubby can market is strongly driven by rising beverage consumption, sustainability mandates, and the shift toward recyclable aluminum packaging. Consumers increasingly prefer compact formats that balance convenience and portion control. Breweries and beverage manufacturers emphasize stubby cans for branding differentiation, while modernization of retail and expansion of RTD categories boost adoption globally.

Challenges include high production costs of aluminum compared to PET bottles and glass, as well as recycling infrastructure gaps in emerging markets. Competition from alternative packaging formats such as glass and flexible plastics also pressures adoption. For some beverage producers, high initial investment in canning lines further limits transition.Lightweighting innovations and advanced digital printing technologies are shaping the competitive landscape. Premium alcoholic beverages and craft launches are leveraging stubby cans for branding appeal, while energy drinks and functional beverages adopt compact cans for portability. Integration of recycled aluminum, automation-ready manufacturing, and sustainable coatings reflects long-term industry direction.
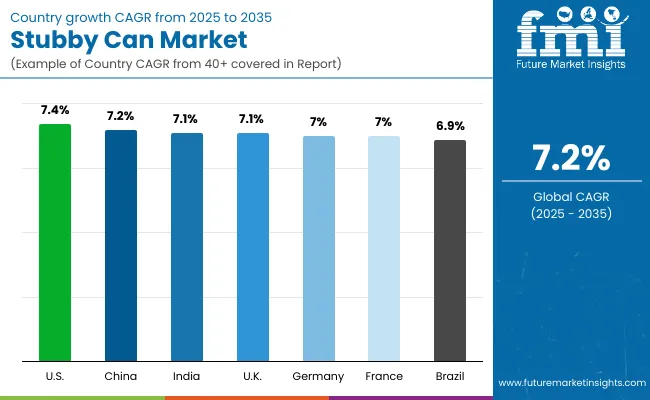
Analysis of Stubby Can Market by Key Countries

Stubby Can Market By Country

The global stubby can market is witnessing robust expansion, supported by rising beverage demand, sustainability mandates, and brand-driven adoption. Asia-Pacific is the fastest-growing region, with Japan and South Korea leading adoption due to strong beer and functional drink demand. Developed regions such as the USA, Germany, and the UK emphasize recyclable aluminum stubby cans, premiumization, and automation-ready production systems to align with sustainability and branding goals.
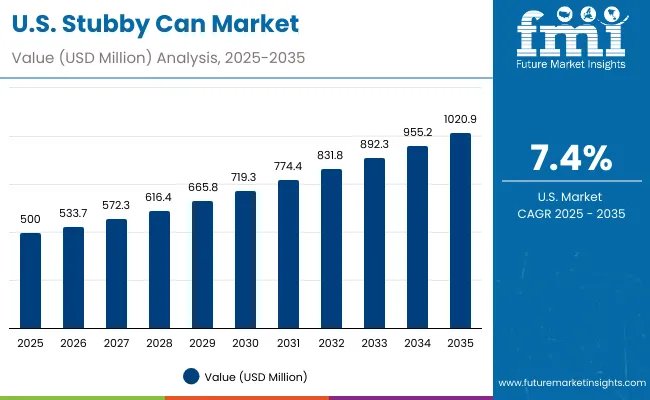
United States Sales Outlook

Stubby Can Market Usa

The USA stubby can market is forecast to expand at 7.4% CAGR between 2025 and 2035, driven by strong beer and carbonated beverage consumption. Regulatory support for recyclability and sustainability enhances aluminum adoption, while medium-capacity formats remain the preferred choice for both alcoholic and non-alcoholic drinks. Premium branding and expanding energy drink sales support continued growth, with supermarkets and breweries reinforcing high-volume adoption.
  • Aluminum stubby cans dominate beverage packaging formats.
  • Breweries adopt stubby cans for premiumization and limited editions.
  • Automation-ready lines increase cost efficiency and scale.

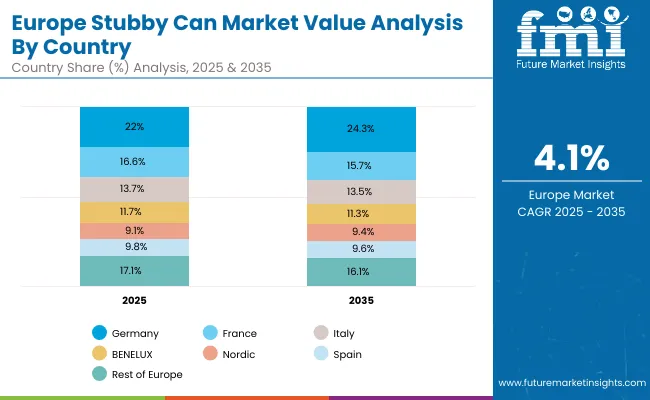
Germany Growth Outlook

Stubby Can Market Europe

Germany’s stubby can market will grow at 7.0% CAGR during 2025-2035. Strong beer culture, advanced recycling systems, and strict packaging regulations reinforce aluminum adoption. Medium-sized cans dominate beer and soft drink packaging, aligning with portion-control preferences. Craft breweries and large beverage manufacturers both leverage stubby cans for branding, freshness, and sustainability, ensuring consistent growth across retail and foodservice segments.

  • Medium-capacity cans dominate beer packaging.
  • Aluminum aligns with sustainability compliance.
  • Craft breweries drive premium stubby can demand.

United Kingdom Expansion Outlook

The UK market is forecast to expand at 7.1% CAGR, driven by sustainability commitments, alcoholic beverage consumption, and retail partnerships. Breweries and distilleries are increasingly adopting recyclable stubby cans to meet eco-friendly goals while maintaining consumer appeal. Strong demand for premium alcoholic beverages, coupled with innovation in RTD drinks, is enhancing demand for aluminum-based stubby cans across supermarkets and on-trade channels.

  • Beer and craft beverage launches drive adoption.
  • Retailers emphasize recyclable formats.
  • Branding differentiation drives premium positioning.

China Sales Outlook

China’s stubby can market is projected to grow at 7.2% CAGR. Rising disposable incomes, urbanization, and expanding retail networks boost beverage consumption, fuelingaluminum stubby can adoption. Premiumization of alcoholic drinks and growing energy drink demand create opportunities, while domestic beverage companies increasingly adopt medium-capacity cans for affordability and branding differentiation in mass-market products.

  • Aluminum dominates beer and soft drink packaging.
  • Retail modernization supports expanded distribution.
  • Premium beverage launches accelerate consumer adoption.

India Growth Outlook

India’s market will expand at 7.1% CAGR during 2025-2035. Rising consumption of alcoholic beverages, expanding urban middle-class, and growing popularity of energy drinks boost demand for stubby cans. Medium-sized formats are widely preferred for affordability and convenience, while multinational breweries and beverage companies strengthen their presence in Indian retail channels with recyclable aluminum solutions.

  • Breweries expand stubby can adoption in premium beer.
  • Energy drink brands adopt recyclable formats.
  • Retail expansion fuels demand.

Japan Outlook

Japan will be the fastest-growing market with a 7.9% CAGR. High beer consumption, premium beverage culture, and stringent recycling compliance drive stubby can adoption. RTD coffee, functional beverages, and energy drinks are strong growth contributors. Premium branding and high-definition printing innovations enhance appeal among Japanese consumers, ensuring aluminum stubby cans dominate across retail and foodservice segments.

  • Aluminum cans dominate across beverage categories.
  • Premium branding strengthens appeal.
  • Recycling compliance reinforces adoption.

South Korea Expansion Outlook

South Korea’s market is set to grow at 7.8% CAGR. Strong beer and energy drink consumption, coupled with premium beverage positioning, support aluminum stubby can demand. Retail modernization and innovation in branding further boost adoption. Sustainability mandates and consumer preference for recyclable formats align with aluminum’s leadership, making South Korea a key growth driver within Asia-Pacific.
  • Energy drinks drive aluminum stubby can adoption.
  • Premium alcoholic beverages strengthen demand.
  • Branding and digital printing boost competitiveness.

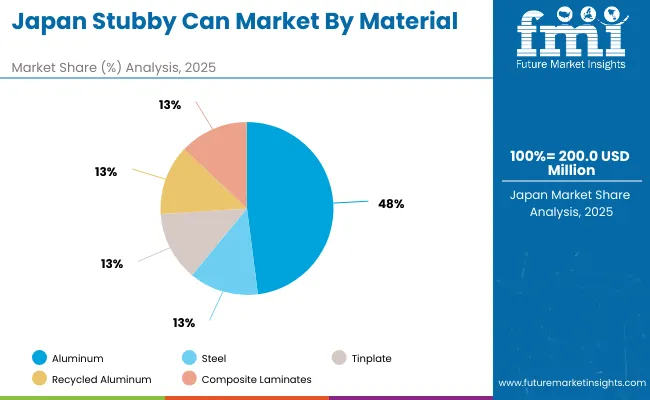
Analysis of Japan by Material

Stubby Can Market Japan

Japan’s stubby can market, valued at USD 200 million in 2025, is led by aluminum, holding 48.6% share due to its recyclability and lightweight benefits. Steel accounts for 16.4%, offering durability in beverage storage. Tinplate follows at 14.9%, primarily supporting niche applications in packaging. Recycled aluminum secures 12.9%, growing steadily with sustainability emphasis. Composite laminates, at 7.2%, serve specialized demand, especially in premium beverage packaging. This segmentation underscores Japan’s reliance on aluminum, while sustainability-driven adoption of recycled aluminum indicates market readiness for green transitions, supported by regulations and consumer preferences for eco-conscious packaging alternatives.
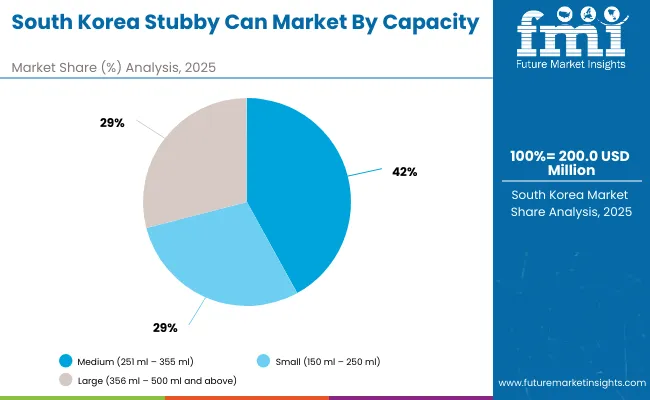
Analysis of South Korea by Capacity

Stubby Can Market South Korea

South Korea’s stubby can market, worth USD 200 million in 2025, is dominated by medium-sized cans (251-355 ml) with 41.1% share, preferred for carbonated drinks and convenience packaging. Small cans (150-250 ml) account for 17.8%, reflecting popularity in energy drinks and health beverages. Large cans (356-500 ml and above) hold 17.5%, catering to beer and alcoholic beverages. This distribution highlights consumer preference for medium sizes in everyday use, while smaller formats grow due to lifestyle shifts. Meanwhile, larger cans remain integral in the alcoholic segment, ensuring a balanced market that meets both daily convenience and leisure-driven consumption needs.
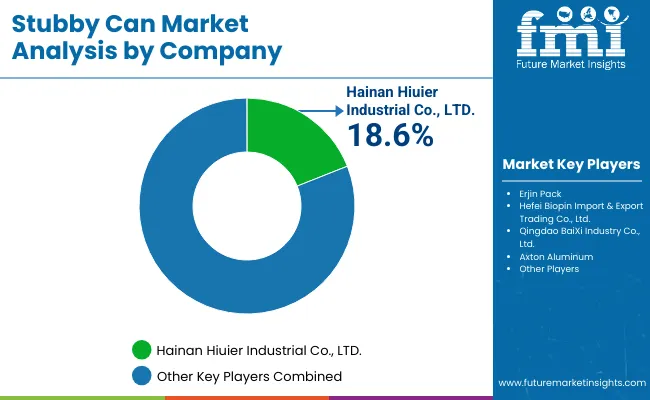
Competitive Landscape of Stubby Can Market

Stubby Can Market By Company

The stubby can market is moderately fragmented, with both global and regional companies competing on design, sustainability, and cost efficiency. Companies such as Hainan Hiuier Industrial, Erjin Pack, Hefei Biopin, Qingdao BaiXi Industry, and Axton Aluminum dominate the supply chain with aluminum-based stubby cans. Emphasis is placed on lightweighting, recyclability, and branding flexibility to appeal to beverage manufacturers worldwide.

Smaller firms contribute through contract manufacturing and specialized designs for craft breweries and niche beverage producers. Innovation in composite laminates and printing technologies drives premium packaging solutions. Competitive strategies increasingly focus on automation-ready lines and integration of recycled aluminum. The competitive landscape reflects a balance between scale efficiencies and innovative differentiation.

Key Developments of Stubby Can Market

  • In 2024 Qingdao Baixi Industry, signed a 25-year distributed photovoltaic (PV) power generation cooperation to build a green manufacturing system for its two-piece cans division, targeting lower energy consumption and electricity costs.
  • In 2024, Erjin PackExpanded its product portfolio by adding PET beverage cans and tin cans to its aluminumlineup, positioning itself as a full-service beverage packaging provider with multi-material solutions. (Company update, Dec 05, 2024).

Key Companies

  • Hainan Hiuier Industrial Co., LTD.
  • Erjin Pack
  • Hefei Biopin Import & Export Trading Co., Ltd.
  • Qingdao BaiXi Industry Co., Ltd.
  • Axton Aluminum

Scope of the Report

Item Value
Quantitative Units USD 1.5 Billion
By Material Aluminum, Steel, Tinplate, Recycled Aluminum, Composite Laminates
By Capacity Small (150 ml-250 ml), Medium (251 ml-355 ml), Large (356 ml-500 ml and above)
By Application Carbonated Soft Drinks, Beer and Alcoholic Beverages, Energy Drinks, Functional and Nutritional Drinks, Ready-to-Drink Coffee and Tea
By End-Use Industry Food and Beverage Manufacturers, Breweries and Distilleries, Nutraceutical Brands, Retail and Supermarkets, Foodservice Sector
Key Companies Profiled Hainan Hiuier Industrial, Erjin Pack, Hefei Biopin, Qingdao BaiXi Industry, Axton Aluminum
Additional Attributes Growth supported by recyclability, beer and soft drink demand, branding, automation, and sustainability goals.

Key Segmentation

By Material:

  • Aluminum
  • Steel
  • Tinplate
  • Recycled Aluminum
  • Composite Laminates

By Capacity:

  • Small (150 ml - 250 ml)
  • Medium (251 ml - 355 ml)
  • Large (356 ml - 500 ml and above)

By Application:

  • Carbonated Soft Drinks
  • Beer and Alcoholic Beverages
  • Energy Drinks
  • Functional and Nutritional Drinks
  • Ready-to-Drink Coffee and Tea

By End-Use Industry:

  • Food and Beverage Manufacturers
  • Breweries and Distilleries
  • Nutraceutical Brands
  • Retail and Supermarkets
  • Foodservice Sector

By Region:

  • North America
  • Europe
  • Asia-Pacific
  • Latin America
  • Middle East & Africa

Table of Content

  1. Executive Summary
    • Global Market Outlook
    • Demand-side Trends
    • Supply-side Trends
    • Technology Roadmap Analysis
    • Analysis and Recommendations
  2. Market Overview
    • Market Coverage / Taxonomy
    • Market Definition / Scope / Limitations
  3. Market Background
    • Market Dynamics
      • Drivers
      • Restraints
      • Opportunity
      • Trends
    • Scenario Forecast
      • Demand in Optimistic Scenario
      • Demand in Likely Scenario
      • Demand in Conservative Scenario
    • Opportunity Map Analysis
    • Product Life Cycle Analysis
    • Supply Chain Analysis
      • Supply Side Participants and their Roles
        • Producers
        • Mid-Level Participants (Traders/ Agents/ Brokers)
        • Wholesalers and Distributors
      • Value Added and Value Created at Node in the Supply Chain
      • List of Raw Material Suppliers
      • List of Existing and Potential Buyer’s
    • Investment Feasibility Matrix
    • Value Chain Analysis
      • Profit Margin Analysis
      • Wholesalers and Distributors
      • Retailers
    • PESTLE and Porter’s Analysis
    • Regulatory Landscape
      • By Key Regions
      • By Key Countries
    • Regional Parent Market Outlook
    • Production and Consumption Statistics
    • Import and Export Statistics
  4. Global Market Analysis 2020 to 2024 and Forecast, 2025 to 2035
    • Historical Market Size Value (USD Billion) & Volume (Units) Analysis, 2020 to 2024
    • Current and Future Market Size Value (USD Billion) & Volume (Units) Projections, 2025 to 2035
      • Y-o-Y Growth Trend Analysis
      • Absolute $ Opportunity Analysis
  5. Global Market Analysis 2020 to 2024 and Forecast 2025 to 2035, By Material
    • Introduction / Key Findings
    • Historical Market Size Value (USD Billion) & Volume (Units) Analysis By Material, 2020 to 2024
    • Current and Future Market Size Value (USD Billion) & Volume (Units) Analysis and Forecast By Material, 2025 to 2035
      • Aluminum
      • Steel
      • Tinplate
      • Recycled Aluminum
      • Composite Laminates
    • Y-o-Y Growth Trend Analysis By Material, 2020 to 2024
    • Absolute $ Opportunity Analysis By Material, 2025 to 2035
  6. Global Market Analysis 2020 to 2024 and Forecast 2025 to 2035, By Capacity
    • Introduction / Key Findings
    • Historical Market Size Value (USD Billion) & Volume (Units) Analysis By Capacity, 2020 to 2024
    • Current and Future Market Size Value (USD Billion) & Volume (Units) Analysis and Forecast By Capacity, 2025 to 2035
      • Medium (251 ml - 355 ml)
      • Small (150 ml - 250 ml)
      • Large (356 ml - 500 ml and above)
    • Y-o-Y Growth Trend Analysis By Capacity, 2020 to 2024
    • Absolute $ Opportunity Analysis By Capacity, 2025 to 2035
  7. Global Market Analysis 2020 to 2024 and Forecast 2025 to 2035, By Application
    • Introduction / Key Findings
    • Historical Market Size Value (USD Billion) & Volume (Units) Analysis By Application, 2020 to 2024
    • Current and Future Market Size Value (USD Billion) & Volume (Units) Analysis and Forecast By Application, 2025 to 2035
      • Beer and Alcoholic Beverages
      • Carbonated Soft Drinks
      • Energy Drinks
      • Functional and Nutritional Drinks
      • Ready-to-Drink Coffee and Tea
    • Y-o-Y Growth Trend Analysis By Application, 2020 to 2024
    • Absolute $ Opportunity Analysis By Application, 2025 to 2035
  8. Global Market Analysis 2020 to 2024 and Forecast 2025 to 2035, By End-Use Industry
    • Introduction / Key Findings
    • Historical Market Size Value (USD Billion) & Volume (Units) Analysis By End-Use Industry, 2020 to 2024
    • Current and Future Market Size Value (USD Billion) & Volume (Units) Analysis and Forecast By End-Use Industry, 2025 to 2035
      • Food and Beverage Manufacturers
      • Breweries and Distilleries
      • Nutraceutical Brands
      • Retail and Supermarkets
      • Foodservice Sector
    • Y-o-Y Growth Trend Analysis By End-Use Industry, 2020 to 2024
    • Absolute $ Opportunity Analysis By End-Use Industry, 2025 to 2035
  9. Global Market Analysis 2020 to 2024 and Forecast 2025 to 2035, By Region
    • Introduction
    • Historical Market Size Value (USD Billion) & Volume (Units) Analysis By Region, 2020 to 2024
    • Current Market Size Value (USD Billion) & Volume (Units) Analysis and Forecast By Region, 2025 to 2035
      • North America
      • Latin America
      • East Asia
      • South Asia & Pacific
      • Europe
      • Middle East & Africa
    • Market Attractiveness Analysis By Region
  10. North America Market Analysis 2020 to 2024 and Forecast 2025 to 2035, By Country
    • Historical Market Size Value (USD Billion) & Volume (Units) Trend Analysis By Market Taxonomy, 2020 to 2024
    • Market Size Value (USD Billion) & Volume (Units) Forecast By Market Taxonomy, 2025 to 2035
      • By Country
        • USA
        • Canada
        • Mexico
      • By Material
      • By Capacity
      • By Application
      • By End-Use Industry
    • Market Attractiveness Analysis
      • By Country
      • By Material
      • By Capacity
      • By Application
      • By End-Use Industry
    • Key Takeaways
  11. Latin America Market Analysis 2020 to 2024 and Forecast 2025 to 2035, By Country
    • Historical Market Size Value (USD Billion) & Volume (Units) Trend Analysis By Market Taxonomy, 2020 to 2024
    • Market Size Value (USD Billion) & Volume (Units) Forecast By Market Taxonomy, 2025 to 2035
      • By Country
        • Brazil
        • Argentina
        • Rest of Latin America
      • By Material
      • By Capacity
      • By Application
      • By End-Use Industry
    • Market Attractiveness Analysis
      • By Country
      • By Material
      • By Capacity
      • By Application
      • By End-Use Industry
    • Key Takeaways
  12. East Asia Market Analysis 2020 to 2024 and Forecast 2025 to 2035, By Country
    • Historical Market Size Value (USD Billion) & Volume (Units) Trend Analysis By Market Taxonomy, 2020 to 2024
    • Market Size Value (USD Billion) & Volume (Units) Forecast By Market Taxonomy, 2025 to 2035
      • By Country
        • China
        • Japan
        • South Korea
      • By Material
      • By Capacity
      • By Application
      • By End-Use Industry
    • Market Attractiveness Analysis
      • By Country
      • By Material
      • By Capacity
      • By Application
      • By End-Use Industry
    • Key Takeaways
  13. South Asia & Pacific Market Analysis 2020 to 2024 and Forecast 2025 to 2035, By Country
    • Historical Market Size Value (USD Billion) & Volume (Units) Trend Analysis By Market Taxonomy, 2020 to 2024
    • Market Size Value (USD Billion) & Volume (Units) Forecast By Market Taxonomy, 2025 to 2035
      • By Country
        • India
        • ASEAN Countries
        • Australia& New Zealand
        • Rest of South Asia
      • By Material
      • By Capacity
      • By Application
      • By End-Use Industry
    • Market Attractiveness Analysis
      • By Country
      • By Material
      • By Capacity
      • By Application
      • By End-Use Industry
    • Key Takeaways
  14. Europe Market Analysis 2020 to 2024 and Forecast 2025 to 2035, By Country
    • Historical Market Size Value (USD Billion) & Volume (Units) Trend Analysis By Market Taxonomy, 2020 to 2024
    • Market Size Value (USD Billion) & Volume (Units) Forecast By Market Taxonomy, 2025 to 2035
      • By Country
        • Germany
        • UK
        • France
        • Italy
        • Spain
        • BENELUX
        • Nordic Countries
        • Russia
        • Hungary
        • Poland
        • Rest of Europe
      • By Material
      • By Capacity
      • By Application
      • By End-Use Industry
    • Market Attractiveness Analysis
      • By Country
      • By Material
      • By Capacity
      • By Application
      • By End-Use Industry
    • Key Takeaways
  15. Middle East & Africa Market Analysis 2020 to 2024 and Forecast 2025 to 2035, By Country
    • Historical Market Size Value (USD Billion) & Volume (Units) Trend Analysis By Market Taxonomy, 2020 to 2024
    • Market Size Value (USD Billion) & Volume (Units) Forecast By Market Taxonomy, 2025 to 2035
      • By Country
        • Saudi Arabia
        • Türkiye
        • South Africa
        • Other African Union
        • Rest of Middle East & Africa
      • By Material
      • By Capacity
      • By Application
      • By End-Use Industry
    • Market Attractiveness Analysis
      • By Country
      • By Material
      • By Capacity
      • By Application
      • By End-Use Industry
    • Key Takeaways
  16. Key Countries Market Analysis
    • USA.
      • Pricing Analysis
      • Market Share Analysis, 2024
        • By Material
        • By Capacity
        • By Application
        • By End-Use Industry
    • Brazil
      • Pricing Analysis
      • Market Share Analysis, 2024
        • By Material
        • By Capacity
        • By Application
        • By End-Use Industry
    • China
      • Pricing Analysis
      • Market Share Analysis, 2024
        • By Material
        • By Capacity
        • By Application
        • By End-Use Industry
    • India
      • Pricing Analysis
      • Market Share Analysis, 2024
        • By Material
        • By Capacity
        • By Application
        • By End-Use Industry
    • Europe
      • Pricing Analysis
      • Market Share Analysis, 2024
        • By Material
        • By Capacity
        • By Application
        • By End-Use Industry
    • Germany
      • Pricing Analysis
      • Market Share Analysis, 2024
        • By Material
        • By Capacity
        • By Application
        • By End-Use Industry
    • France
      • Pricing Analysis
      • Market Share Analysis, 2024
        • By Material
        • By Capacity
        • By Application
        • By End-Use Industry
    • UK
      • Pricing Analysis
      • Market Share Analysis, 2024
        • By Material
        • By Capacity
        • By Application
        • By End-Use Industry
  17. Market Structure Analysis
    • Competition Dashboard
    • Competition Benchmarking
    • Market Share Analysis of Top Players
      • By Regional
      • By Material
      • By Capacity
      • By Application
      • By End-Use Industry
  18. Competition Analysis
    • Competition Deep Dive
      • Hainan Hiuier Industrial Co., LTD.
        • Overview
        • Product Portfolio
        • Profitability by Market Segments (Product/Age /Sales Channel/Region)
        • Sales Footprint
        • Strategy Overview
          • Marketing Strategy
          • Product Strategy
          • Channel Strategy
      • Erjin Pack
        • Overview
        • Product Portfolio
        • Profitability by Market Segments (Product/Age /Sales Channel/Region)
        • Sales Footprint
        • Strategy Overview
          • Marketing Strategy
          • Product Strategy
          • Channel Strategy
      • Hefei Biopin Import & Export Trading Co., Ltd.
        • Overview
        • Product Portfolio
        • Profitability by Market Segments (Product/Age /Sales Channel/Region)
        • Sales Footprint
        • Strategy Overview
          • Marketing Strategy
          • Product Strategy
          • Channel Strategy
      • Qingdao BaiXi Industry Co., Ltd.
        • Overview
        • Product Portfolio
        • Profitability by Market Segments (Product/Age /Sales Channel/Region)
        • Sales Footprint
        • Strategy Overview
          • Marketing Strategy
          • Product Strategy
          • Channel Strategy
      • Axton Aluminum
        • Overview
        • Product Portfolio
        • Profitability by Market Segments (Product/Age /Sales Channel/Region)
        • Sales Footprint
        • Strategy Overview
          • Marketing Strategy
          • Product Strategy
          • Channel Strategy
  19. Assumptions & Acronyms Used
  20. Research Methodology

List of Tables

  • Table 1: Global Market Value (USD Billion) Forecast by Region, 2020-2035
  • Table 2: Global Market Volume (Units) Forecast by Region, 2020-2035
  • Table 3: Global Market Value (USD Billion) Forecast by Material, 2020-2035
  • Table 4: Global Market Volume (Units) Forecast by Material, 2020-2035
  • Table 5: Global Market Value (USD Billion) Forecast by Capacity, 2020-2035
  • Table 6: Global Market Volume (Units) Forecast by Capacity, 2020-2035
  • Table 7: Global Market Value (USD Billion) Forecast by Application, 2020-2035
  • Table 8: Global Market Volume (Units) Forecast by Application, 2020-2035
  • Table 9: Global Market Value (USD Billion) Forecast by End-Use Industry, 2020-2035
  • Table 10: Global Market Volume (Units) Forecast by End-Use Industry, 2020-2035
  • Table 11: North America Market Value (USD Billion) Forecast by Country, 2020-2035
  • Table 12: North America Market Volume (Units) Forecast by Country, 2020-2035
  • Table 13: North America Market Value (USD Billion) Forecast by Material, 2020-2035
  • Table 14: North America Market Volume (Units) Forecast by Material, 2020-2035
  • Table 15: North America Market Value (USD Billion) Forecast by Capacity, 2020-2035
  • Table 16: North America Market Volume (Units) Forecast by Capacity, 2020-2035
  • Table 17: North America Market Value (USD Billion) Forecast by Application, 2020-2035
  • Table 18: North America Market Volume (Units) Forecast by Application, 2020-2035
  • Table 19: North America Market Value (USD Billion) Forecast by End-Use Industry, 2020-2035
  • Table 20: North America Market Volume (Units) Forecast by End-Use Industry, 2020-2035
  • Table 21: Latin America Market Value (USD Billion) Forecast by Country, 2020-2035
  • Table 22: Latin America Market Volume (Units) Forecast by Country, 2020-2035
  • Table 23: Latin America Market Value (USD Billion) Forecast by Material, 2020-2035
  • Table 24: Latin America Market Volume (Units) Forecast by Material, 2020-2035
  • Table 25: Latin America Market Value (USD Billion) Forecast by Capacity, 2020-2035
  • Table 26: Latin America Market Volume (Units) Forecast by Capacity, 2020-2035
  • Table 27: Latin America Market Value (USD Billion) Forecast by Application, 2020-2035
  • Table 28: Latin America Market Volume (Units) Forecast by Application, 2020-2035
  • Table 29: Latin America Market Value (USD Billion) Forecast by End-Use Industry, 2020-2035
  • Table 30: Latin America Market Volume (Units) Forecast by End-Use Industry, 2020-2035
  • Table 31: East Asia Market Value (USD Billion) Forecast by Country, 2020-2035
  • Table 32: East Asia Market Volume (Units) Forecast by Country, 2020-2035
  • Table 33: East Asia Market Value (USD Billion) Forecast by Material, 2020-2035
  • Table 34: East Asia Market Volume (Units) Forecast by Material, 2020-2035
  • Table 35: East Asia Market Value (USD Billion) Forecast by Capacity, 2020-2035
  • Table 36: East Asia Market Volume (Units) Forecast by Capacity, 2020-2035
  • Table 37: East Asia Market Value (USD Billion) Forecast by Application, 2020-2035
  • Table 38: East Asia Market Volume (Units) Forecast by Application, 2020-2035
  • Table 39: East Asia Market Value (USD Billion) Forecast by End-Use Industry, 2020-2035
  • Table 40: East Asia Market Volume (Units) Forecast by End-Use Industry, 2020-2035
  • Table 41: South Asia & Pacific Market Value (USD Billion) Forecast by Country, 2020-2035
  • Table 42: South Asia & Pacific Market Volume (Units) Forecast by Country, 2020-2035
  • Table 43: South Asia & Pacific Market Value (USD Billion) Forecast by Material, 2020-2035
  • Table 44: South Asia & Pacific Market Volume (Units) Forecast by Material, 2020-2035
  • Table 45: South Asia & Pacific Market Value (USD Billion) Forecast by Capacity, 2020-2035
  • Table 46: South Asia & Pacific Market Volume (Units) Forecast by Capacity, 2020-2035
  • Table 47: South Asia & Pacific Market Value (USD Billion) Forecast by Application, 2020-2035
  • Table 48: South Asia & Pacific Market Volume (Units) Forecast by Application, 2020-2035
  • Table 49: South Asia & Pacific Market Value (USD Billion) Forecast by End-Use Industry, 2020-2035
  • Table 50: South Asia & Pacific Market Volume (Units) Forecast by End-Use Industry, 2020-2035
  • Table 51: Europe Market Value (USD Billion) Forecast by Country, 2020-2035
  • Table 52: Europe Market Volume (Units) Forecast by Country, 2020-2035
  • Table 53: Europe Market Value (USD Billion) Forecast by Material, 2020-2035
  • Table 54: Europe Market Volume (Units) Forecast by Material, 2020-2035
  • Table 55: Europe Market Value (USD Billion) Forecast by Capacity, 2020-2035
  • Table 56: Europe Market Volume (Units) Forecast by Capacity, 2020-2035
  • Table 57: Europe Market Value (USD Billion) Forecast by Application, 2020-2035
  • Table 58: Europe Market Volume (Units) Forecast by Application, 2020-2035
  • Table 59: Europe Market Value (USD Billion) Forecast by End-Use Industry, 2020-2035
  • Table 60: Europe Market Volume (Units) Forecast by End-Use Industry, 2020-2035
  • Table 61: Middle East & Africa Market Value (USD Billion) Forecast by Country, 2020-2035
  • Table 62: Middle East & Africa Market Volume (Units) Forecast by Country, 2020-2035
  • Table 63: Middle East & Africa Market Value (USD Billion) Forecast by Material, 2020-2035
  • Table 64: Middle East & Africa Market Volume (Units) Forecast by Material, 2020-2035
  • Table 65: Middle East & Africa Market Value (USD Billion) Forecast by Capacity, 2020-2035
  • Table 66: Middle East & Africa Market Volume (Units) Forecast by Capacity, 2020-2035
  • Table 67: Middle East & Africa Market Value (USD Billion) Forecast by Application, 2020-2035
  • Table 68: Middle East & Africa Market Volume (Units) Forecast by Application, 2020-2035
  • Table 69: Middle East & Africa Market Value (USD Billion) Forecast by End-Use Industry, 2020-2035
  • Table 70: Middle East & Africa Market Volume (Units) Forecast by End-Use Industry, 2020-2035

List of Figures

  • Figure 1: Global Market Value (USD Billion) by Material, 2025-2035
  • Figure 2: Global Market Value (USD Billion) by Capacity, 2025-2035
  • Figure 3: Global Market Value (USD Billion) by Application, 2025-2035
  • Figure 4: Global Market Value (USD Billion) by End-Use Industry, 2025-2035
  • Figure 5: Global Market Value (USD Billion) by Region, 2025-2035
  • Figure 6: Global Market Value (USD Billion) Analysis by Region, 2020-2035
  • Figure 7: Global Market Volume (Units) Analysis by Region, 2020-2035
  • Figure 8: Global Market Value Share (%) and BPS Analysis by Region, 2025-2035
  • Figure 9: Global Market Y-o-Y Growth (%) Projections by Region, 2025-2035
  • Figure 10: Global Market Value (USD Billion) Analysis by Material, 2020-2035
  • Figure 11: Global Market Volume (Units) Analysis by Material, 2020-2035
  • Figure 12: Global Market Value Share (%) and BPS Analysis by Material, 2025-2035
  • Figure 13: Global Market Y-o-Y Growth (%) Projections by Material, 2025-2035
  • Figure 14: Global Market Value (USD Billion) Analysis by Capacity, 2020-2035
  • Figure 15: Global Market Volume (Units) Analysis by Capacity, 2020-2035
  • Figure 16: Global Market Value Share (%) and BPS Analysis by Capacity, 2025-2035
  • Figure 17: Global Market Y-o-Y Growth (%) Projections by Capacity, 2025-2035
  • Figure 18: Global Market Value (USD Billion) Analysis by Application, 2020-2035
  • Figure 19: Global Market Volume (Units) Analysis by Application, 2020-2035
  • Figure 20: Global Market Value Share (%) and BPS Analysis by Application, 2025-2035
  • Figure 21: Global Market Y-o-Y Growth (%) Projections by Application, 2025-2035
  • Figure 22: Global Market Value (USD Billion) Analysis by End-Use Industry, 2020-2035
  • Figure 23: Global Market Volume (Units) Analysis by End-Use Industry, 2020-2035
  • Figure 24: Global Market Value Share (%) and BPS Analysis by End-Use Industry, 2025-2035
  • Figure 25: Global Market Y-o-Y Growth (%) Projections by End-Use Industry, 2025-2035
  • Figure 26: Global Market Attractiveness by Material, 2025-2035
  • Figure 27: Global Market Attractiveness by Capacity, 2025-2035
  • Figure 28: Global Market Attractiveness by Application, 2025-2035
  • Figure 29: Global Market Attractiveness by End-Use Industry, 2025-2035
  • Figure 30: Global Market Attractiveness by Region, 2025-2035
  • Figure 31: North America Market Value (USD Billion) by Material, 2025-2035
  • Figure 32: North America Market Value (USD Billion) by Capacity, 2025-2035
  • Figure 33: North America Market Value (USD Billion) by Application, 2025-2035
  • Figure 34: North America Market Value (USD Billion) by End-Use Industry, 2025-2035
  • Figure 35: North America Market Value (USD Billion) by Country, 2025-2035
  • Figure 36: North America Market Value (USD Billion) Analysis by Country, 2020-2035
  • Figure 37: North America Market Volume (Units) Analysis by Country, 2020-2035
  • Figure 38: North America Market Value Share (%) and BPS Analysis by Country, 2025-2035
  • Figure 39: North America Market Y-o-Y Growth (%) Projections by Country, 2025-2035
  • Figure 40: North America Market Value (USD Billion) Analysis by Material, 2020-2035
  • Figure 41: North America Market Volume (Units) Analysis by Material, 2020-2035
  • Figure 42: North America Market Value Share (%) and BPS Analysis by Material, 2025-2035
  • Figure 43: North America Market Y-o-Y Growth (%) Projections by Material, 2025-2035
  • Figure 44: North America Market Value (USD Billion) Analysis by Capacity, 2020-2035
  • Figure 45: North America Market Volume (Units) Analysis by Capacity, 2020-2035
  • Figure 46: North America Market Value Share (%) and BPS Analysis by Capacity, 2025-2035
  • Figure 47: North America Market Y-o-Y Growth (%) Projections by Capacity, 2025-2035
  • Figure 48: North America Market Value (USD Billion) Analysis by Application, 2020-2035
  • Figure 49: North America Market Volume (Units) Analysis by Application, 2020-2035
  • Figure 50: North America Market Value Share (%) and BPS Analysis by Application, 2025-2035
  • Figure 51: North America Market Y-o-Y Growth (%) Projections by Application, 2025-2035
  • Figure 52: North America Market Value (USD Billion) Analysis by End-Use Industry, 2020-2035
  • Figure 53: North America Market Volume (Units) Analysis by End-Use Industry, 2020-2035
  • Figure 54: North America Market Value Share (%) and BPS Analysis by End-Use Industry, 2025-2035
  • Figure 55: North America Market Y-o-Y Growth (%) Projections by End-Use Industry, 2025-2035
  • Figure 56: North America Market Attractiveness by Material, 2025-2035
  • Figure 57: North America Market Attractiveness by Capacity, 2025-2035
  • Figure 58: North America Market Attractiveness by Application, 2025-2035
  • Figure 59: North America Market Attractiveness by End-Use Industry, 2025-2035
  • Figure 60: North America Market Attractiveness by Country, 2025-2035
  • Figure 61: Latin America Market Value (USD Billion) by Material, 2025-2035
  • Figure 62: Latin America Market Value (USD Billion) by Capacity, 2025-2035
  • Figure 63: Latin America Market Value (USD Billion) by Application, 2025-2035
  • Figure 64: Latin America Market Value (USD Billion) by End-Use Industry, 2025-2035
  • Figure 65: Latin America Market Value (USD Billion) by Country, 2025-2035
  • Figure 66: Latin America Market Value (USD Billion) Analysis by Country, 2020-2035
  • Figure 67: Latin America Market Volume (Units) Analysis by Country, 2020-2035
  • Figure 68: Latin America Market Value Share (%) and BPS Analysis by Country, 2025-2035
  • Figure 69: Latin America Market Y-o-Y Growth (%) Projections by Country, 2025-2035
  • Figure 70: Latin America Market Value (USD Billion) Analysis by Material, 2020-2035
  • Figure 71: Latin America Market Volume (Units) Analysis by Material, 2020-2035
  • Figure 72: Latin America Market Value Share (%) and BPS Analysis by Material, 2025-2035
  • Figure 73: Latin America Market Y-o-Y Growth (%) Projections by Material, 2025-2035
  • Figure 74: Latin America Market Value (USD Billion) Analysis by Capacity, 2020-2035
  • Figure 75: Latin America Market Volume (Units) Analysis by Capacity, 2020-2035
  • Figure 76: Latin America Market Value Share (%) and BPS Analysis by Capacity, 2025-2035
  • Figure 77: Latin America Market Y-o-Y Growth (%) Projections by Capacity, 2025-2035
  • Figure 78: Latin America Market Value (USD Billion) Analysis by Application, 2020-2035
  • Figure 79: Latin America Market Volume (Units) Analysis by Application, 2020-2035
  • Figure 80: Latin America Market Value Share (%) and BPS Analysis by Application, 2025-2035
  • Figure 81: Latin America Market Y-o-Y Growth (%) Projections by Application, 2025-2035
  • Figure 82: Latin America Market Value (USD Billion) Analysis by End-Use Industry, 2020-2035
  • Figure 83: Latin America Market Volume (Units) Analysis by End-Use Industry, 2020-2035
  • Figure 84: Latin America Market Value Share (%) and BPS Analysis by End-Use Industry, 2025-2035
  • Figure 85: Latin America Market Y-o-Y Growth (%) Projections by End-Use Industry, 2025-2035
  • Figure 86: Latin America Market Attractiveness by Material, 2025-2035
  • Figure 87: Latin America Market Attractiveness by Capacity, 2025-2035
  • Figure 88: Latin America Market Attractiveness by Application, 2025-2035
  • Figure 89: Latin America Market Attractiveness by End-Use Industry, 2025-2035
  • Figure 90: Latin America Market Attractiveness by Country, 2025-2035
  • Figure 91: East Asia Market Value (USD Billion) by Material, 2025-2035
  • Figure 92: East Asia Market Value (USD Billion) by Capacity, 2025-2035
  • Figure 93: East Asia Market Value (USD Billion) by Application, 2025-2035
  • Figure 94: East Asia Market Value (USD Billion) by End-Use Industry, 2025-2035
  • Figure 95: East Asia Market Value (USD Billion) by Country, 2025-2035
  • Figure 96: East Asia Market Value (USD Billion) Analysis by Country, 2020-2035
  • Figure 97: East Asia Market Volume (Units) Analysis by Country, 2020-2035
  • Figure 98: East Asia Market Value Share (%) and BPS Analysis by Country, 2025-2035
  • Figure 99: East Asia Market Y-o-Y Growth (%) Projections by Country, 2025-2035
  • Figure 100: East Asia Market Value (USD Billion) Analysis by Material, 2020-2035
  • Figure 101: East Asia Market Volume (Units) Analysis by Material, 2020-2035
  • Figure 102: East Asia Market Value Share (%) and BPS Analysis by Material, 2025-2035
  • Figure 103: East Asia Market Y-o-Y Growth (%) Projections by Material, 2025-2035
  • Figure 104: East Asia Market Value (USD Billion) Analysis by Capacity, 2020-2035
  • Figure 105: East Asia Market Volume (Units) Analysis by Capacity, 2020-2035
  • Figure 106: East Asia Market Value Share (%) and BPS Analysis by Capacity, 2025-2035
  • Figure 107: East Asia Market Y-o-Y Growth (%) Projections by Capacity, 2025-2035
  • Figure 108: East Asia Market Value (USD Billion) Analysis by Application, 2020-2035
  • Figure 109: East Asia Market Volume (Units) Analysis by Application, 2020-2035
  • Figure 110: East Asia Market Value Share (%) and BPS Analysis by Application, 2025-2035
  • Figure 111: East Asia Market Y-o-Y Growth (%) Projections by Application, 2025-2035
  • Figure 112: East Asia Market Value (USD Billion) Analysis by End-Use Industry, 2020-2035
  • Figure 113: East Asia Market Volume (Units) Analysis by End-Use Industry, 2020-2035
  • Figure 114: East Asia Market Value Share (%) and BPS Analysis by End-Use Industry, 2025-2035
  • Figure 115: East Asia Market Y-o-Y Growth (%) Projections by End-Use Industry, 2025-2035
  • Figure 116: East Asia Market Attractiveness by Material, 2025-2035
  • Figure 117: East Asia Market Attractiveness by Capacity, 2025-2035
  • Figure 118: East Asia Market Attractiveness by Application, 2025-2035
  • Figure 119: East Asia Market Attractiveness by End-Use Industry, 2025-2035
  • Figure 120: East Asia Market Attractiveness by Country, 2025-2035
  • Figure 121: South Asia & Pacific Market Value (USD Billion) by Material, 2025-2035
  • Figure 122: South Asia & Pacific Market Value (USD Billion) by Capacity, 2025-2035
  • Figure 123: South Asia & Pacific Market Value (USD Billion) by Application, 2025-2035
  • Figure 124: South Asia & Pacific Market Value (USD Billion) by End-Use Industry, 2025-2035
  • Figure 125: South Asia & Pacific Market Value (USD Billion) by Country, 2025-2035
  • Figure 126: South Asia & Pacific Market Value (USD Billion) Analysis by Country, 2020-2035
  • Figure 127: South Asia & Pacific Market Volume (Units) Analysis by Country, 2020-2035
  • Figure 128: South Asia & Pacific Market Value Share (%) and BPS Analysis by Country, 2025-2035
  • Figure 129: South Asia & Pacific Market Y-o-Y Growth (%) Projections by Country, 2025-2035
  • Figure 130: South Asia & Pacific Market Value (USD Billion) Analysis by Material, 2020-2035
  • Figure 131: South Asia & Pacific Market Volume (Units) Analysis by Material, 2020-2035
  • Figure 132: South Asia & Pacific Market Value Share (%) and BPS Analysis by Material, 2025-2035
  • Figure 133: South Asia & Pacific Market Y-o-Y Growth (%) Projections by Material, 2025-2035
  • Figure 134: South Asia & Pacific Market Value (USD Billion) Analysis by Capacity, 2020-2035
  • Figure 135: South Asia & Pacific Market Volume (Units) Analysis by Capacity, 2020-2035
  • Figure 136: South Asia & Pacific Market Value Share (%) and BPS Analysis by Capacity, 2025-2035
  • Figure 137: South Asia & Pacific Market Y-o-Y Growth (%) Projections by Capacity, 2025-2035
  • Figure 138: South Asia & Pacific Market Value (USD Billion) Analysis by Application, 2020-2035
  • Figure 139: South Asia & Pacific Market Volume (Units) Analysis by Application, 2020-2035
  • Figure 140: South Asia & Pacific Market Value Share (%) and BPS Analysis by Application, 2025-2035
  • Figure 141: South Asia & Pacific Market Y-o-Y Growth (%) Projections by Application, 2025-2035
  • Figure 142: South Asia & Pacific Market Value (USD Billion) Analysis by End-Use Industry, 2020-2035
  • Figure 143: South Asia & Pacific Market Volume (Units) Analysis by End-Use Industry, 2020-2035
  • Figure 144: South Asia & Pacific Market Value Share (%) and BPS Analysis by End-Use Industry, 2025-2035
  • Figure 145: South Asia & Pacific Market Y-o-Y Growth (%) Projections by End-Use Industry, 2025-2035
  • Figure 146: South Asia & Pacific Market Attractiveness by Material, 2025-2035
  • Figure 147: South Asia & Pacific Market Attractiveness by Capacity, 2025-2035
  • Figure 148: South Asia & Pacific Market Attractiveness by Application, 2025-2035
  • Figure 149: South Asia & Pacific Market Attractiveness by End-Use Industry, 2025-2035
  • Figure 150: South Asia & Pacific Market Attractiveness by Country, 2025-2035
  • Figure 151: Europe Market Value (USD Billion) by Material, 2025-2035
  • Figure 152: Europe Market Value (USD Billion) by Capacity, 2025-2035
  • Figure 153: Europe Market Value (USD Billion) by Application, 2025-2035
  • Figure 154: Europe Market Value (USD Billion) by End-Use Industry, 2025-2035
  • Figure 155: Europe Market Value (USD Billion) by Country, 2025-2035
  • Figure 156: Europe Market Value (USD Billion) Analysis by Country, 2020-2035
  • Figure 157: Europe Market Volume (Units) Analysis by Country, 2020-2035
  • Figure 158: Europe Market Value Share (%) and BPS Analysis by Country, 2025-2035
  • Figure 159: Europe Market Y-o-Y Growth (%) Projections by Country, 2025-2035
  • Figure 160: Europe Market Value (USD Billion) Analysis by Material, 2020-2035
  • Figure 161: Europe Market Volume (Units) Analysis by Material, 2020-2035
  • Figure 162: Europe Market Value Share (%) and BPS Analysis by Material, 2025-2035
  • Figure 163: Europe Market Y-o-Y Growth (%) Projections by Material, 2025-2035
  • Figure 164: Europe Market Value (USD Billion) Analysis by Capacity, 2020-2035
  • Figure 165: Europe Market Volume (Units) Analysis by Capacity, 2020-2035
  • Figure 166: Europe Market Value Share (%) and BPS Analysis by Capacity, 2025-2035
  • Figure 167: Europe Market Y-o-Y Growth (%) Projections by Capacity, 2025-2035
  • Figure 168: Europe Market Value (USD Billion) Analysis by Application, 2020-2035
  • Figure 169: Europe Market Volume (Units) Analysis by Application, 2020-2035
  • Figure 170: Europe Market Value Share (%) and BPS Analysis by Application, 2025-2035
  • Figure 171: Europe Market Y-o-Y Growth (%) Projections by Application, 2025-2035
  • Figure 172: Europe Market Value (USD Billion) Analysis by End-Use Industry, 2020-2035
  • Figure 173: Europe Market Volume (Units) Analysis by End-Use Industry, 2020-2035
  • Figure 174: Europe Market Value Share (%) and BPS Analysis by End-Use Industry, 2025-2035
  • Figure 175: Europe Market Y-o-Y Growth (%) Projections by End-Use Industry, 2025-2035
  • Figure 176: Europe Market Attractiveness by Material, 2025-2035
  • Figure 177: Europe Market Attractiveness by Capacity, 2025-2035
  • Figure 178: Europe Market Attractiveness by Application, 2025-2035
  • Figure 179: Europe Market Attractiveness by End-Use Industry, 2025-2035
  • Figure 180: Europe Market Attractiveness by Country, 2025-2035
  • Figure 181: Middle East & Africa Market Value (USD Billion) by Material, 2025-2035
  • Figure 182: Middle East & Africa Market Value (USD Billion) by Capacity, 2025-2035
  • Figure 183: Middle East & Africa Market Value (USD Billion) by Application, 2025-2035
  • Figure 184: Middle East & Africa Market Value (USD Billion) by End-Use Industry, 2025-2035
  • Figure 185: Middle East & Africa Market Value (USD Billion) by Country, 2025-2035
  • Figure 186: Middle East & Africa Market Value (USD Billion) Analysis by Country, 2020-2035
  • Figure 187: Middle East & Africa Market Volume (Units) Analysis by Country, 2020-2035
  • Figure 188: Middle East & Africa Market Value Share (%) and BPS Analysis by Country, 2025-2035
  • Figure 189: Middle East & Africa Market Y-o-Y Growth (%) Projections by Country, 2025-2035
  • Figure 190: Middle East & Africa Market Value (USD Billion) Analysis by Material, 2020-2035
  • Figure 191: Middle East & Africa Market Volume (Units) Analysis by Material, 2020-2035
  • Figure 192: Middle East & Africa Market Value Share (%) and BPS Analysis by Material, 2025-2035
  • Figure 193: Middle East & Africa Market Y-o-Y Growth (%) Projections by Material, 2025-2035
  • Figure 194: Middle East & Africa Market Value (USD Billion) Analysis by Capacity, 2020-2035
  • Figure 195: Middle East & Africa Market Volume (Units) Analysis by Capacity, 2020-2035
  • Figure 196: Middle East & Africa Market Value Share (%) and BPS Analysis by Capacity, 2025-2035
  • Figure 197: Middle East & Africa Market Y-o-Y Growth (%) Projections by Capacity, 2025-2035
  • Figure 198: Middle East & Africa Market Value (USD Billion) Analysis by Application, 2020-2035
  • Figure 199: Middle East & Africa Market Volume (Units) Analysis by Application, 2020-2035
  • Figure 200: Middle East & Africa Market Value Share (%) and BPS Analysis by Application, 2025-2035
  • Figure 201: Middle East & Africa Market Y-o-Y Growth (%) Projections by Application, 2025-2035
  • Figure 202: Middle East & Africa Market Value (USD Billion) Analysis by End-Use Industry, 2020-2035
  • Figure 203: Middle East & Africa Market Volume (Units) Analysis by End-Use Industry, 2020-2035
  • Figure 204: Middle East & Africa Market Value Share (%) and BPS Analysis by End-Use Industry, 2025-2035
  • Figure 205: Middle East & Africa Market Y-o-Y Growth (%) Projections by End-Use Industry, 2025-2035
  • Figure 206: Middle East & Africa Market Attractiveness by Material, 2025-2035
  • Figure 207: Middle East & Africa Market Attractiveness by Capacity, 2025-2035
  • Figure 208: Middle East & Africa Market Attractiveness by Application, 2025-2035
  • Figure 209: Middle East & Africa Market Attractiveness by End-Use Industry, 2025-2035
  • Figure 210: Middle East & Africa Market Attractiveness by Country, 2025-2035

Frequently Asked Questions

How big will the Stubby Can Market be in 2025?

The Stubby Can Market will be valued at USD 1.5 billion in 2025.

What is the projected size of the Stubby Can Market by 2035?

The Stubby Can Market will reach USD 3.0 billion by 2035.

What growth rate is expected for the Stubby Can Market between 2025 and 2035?

The Stubby Can Market will expand at a CAGR of 7.2% during 2025-2035.

Which segment will lead the Stubby Can Market in 2025?

The aluminum segment will lead the Stubby Can Market in 2025 with a 48.2% share.

Which region will be the fastest growing in the Stubby Can Market?

The Asia-Pacific region will be the fastest-growing market, led by Japan at 7.9% CAGR.

Explore Similar Insights

Future Market Insights

Stubby Can Market

Chat With

MaRIA

Hi There, I am MaRIA, Your Market Research Intelligence Assistant. How may I help you?