UHT Dairy Products Market Size and Share Forecast Outlook 2025 to 2035

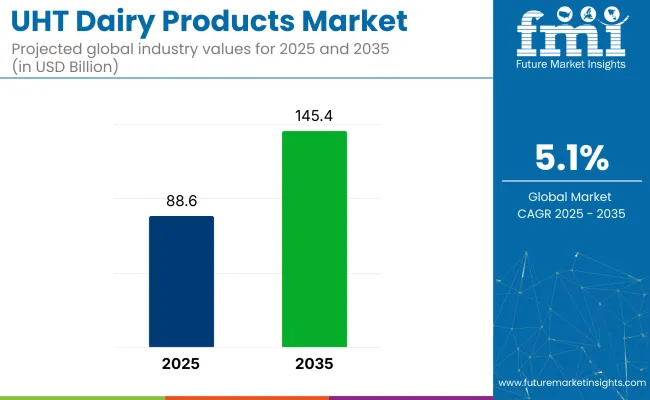
The global UHT dairy products market is valued at USD 88.6 billion in 2025 and is slated to reach USD 145.4 billion by 2035, reflecting a CAGR of 5.1%. The demand is being driven by the rising preference for dairy products with extended shelf life, increasing urbanisation, and limited cold chain infrastructure in developing regions. Additionally, technological advancements in UHT processing and sustainable packaging solutions are supporting market expansion globally.
Quick Stats for UHT Dairy Products Market

  • Market Value (2025): USD 88.6 billion
  • Forecast Value (2035): USD 145.4 billion
  • Forecast CAGR: 5.1%
  • Source Leader in 2025 : Cow Milk (85% Market Share)
  • Top FormSegment: Liquid (74.6% Market Share in 2025)
  • Key Growth Region: Western Europe (USA is the fastest-growing market with 9.2% CAGR)

UHT Dairy Products

Metric Value
2025 Market Size USD 88.6 billion
2035 Market Size USD 145.4 billion
CAGR (2025 to 2035) 5.1%

The USA is expected to grow the fastest in the market, with a CAGR of 9.2% from 2025 to 2035, driven by advanced livestock farming, high meat consumption, and strong investments in animal health. Germany follows with a 7.1% CAGR, supported by its focus on animal welfare and feed efficiency, while the UK grows at 6.8% CAGR due to steady demand for quality meat. Cow milk will dominate the source segment with an 85% market share in 2025.UHT liquid milk will lead the product type segment with a 74.6% market share, driven by its widespread daily consumption and long shelf life.

Government regulations are focusing on ensuring food safety standards and extending shelf life without compromising nutritional quality. Many countries mandate strict microbial safety guidelines and packaging standards for UHT dairy products to protect consumers.

Recent innovations include the development of advanced UHT processing technologies that use ultra-high temperatures for shorter durations, preserving taste and nutrients effectively. Companies like Fonterra and Govind Milk have launched UHT-treated products such as probiotic drinks and traditional desserts like Basundi without chemical preservatives. Sustainable and recyclable Tetra Pak packaging solutions are also being adopted widely, aligning with global environmental regulations and consumer preferences.

The UHT dairy products market forms a significant segment within its parent markets. It accounts for approximately 18-20% of the overall dairy products market, driven by its long shelf life and ease of storage. Within the broader food and beverage market, UHT dairy products hold around 4-5% share, reflecting their niche but growing consumer base.

In the processed food market, their share is estimated at 6-7%, as they align with convenience-driven demand trends. Within the packaged food market, UHT dairy products contribute about 5-6%, supported by advancements in packaging technologies ensuring microbial safety and extended product stability.

Analyzing UHT Dairy Products Market by Top Investment Segments

The UHT dairy products market segments include form, product type, source, sales channel, and region. The market is segmented by form into liquid, semisolid, and solid. By product type, it is categorized into milk, cream, cheese, yogurt, sauces, milk powder, and ice cream mix. By source, it is classified into cow, buffalo, goat, and others (including Camel Milk, Sheep Milk, and Mixed Animal Sources).

By sales channel, the market is divided into B2B and B2C. Regionally, the market is segmented into North America, Latin America, Western Europe, Eastern Europe, Balkans & Baltic, Russia & Belarus, Central Asia, East Asia, South Asia & Pacific, and Middle East & Africa.

Liquid to Lead the Form Segment with 74.6% Market Share in 2025

Liquid is the most lucrative segment, holding 74.6% of the market share in 2025.
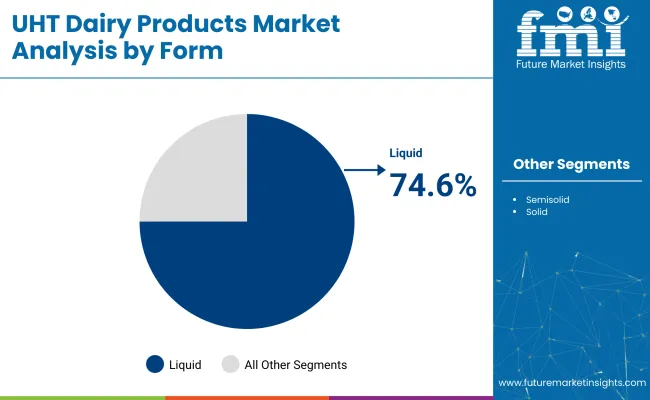
  • Consumers prefer liquid UHT dairy products for daily consumption due to their convenience, safety, and nutritional stability.
  • The segment’s growth is further supported by the rising trend of on-the-go consumption, increasing urbanisation, and limited cold chain infrastructure in many developing countries.

UHT Dairy Products By Form

Milk to Lead the Product Type Segment with 74.6% Market Share in 2025

Milk is the dominant product type segment in the UHT dairy products market, holding the largest share of 74.6% due to its widespread consumption worldwide.

  • UHT milk’s extended shelf life, microbial safety, and maintained nutritional value make it highly preferred among consumers.
  • Cream and cheese follow milk in terms of market share, but UHT milk remains the primary driver for revenue generation as it caters to both household and foodservice applications, supporting consistent market demand and expansion.

Cow Milk to Lead the Source Segment with 85% Market Share in 2025

Cow milk is the most lucrative source segment, accounting for the highest share of 85% due to its availability and widespread consumption.
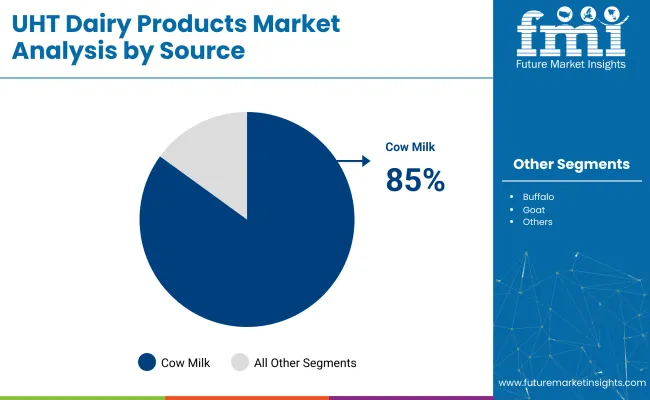
  • The majority of UHT dairy products, such as milk, yogurt, cream, and cheese, are derived from cow milk because of its cost-effectiveness, nutritional profile, and established supply chains globally.
  • Buffalo and goat milk hold smaller shares, catering mainly to regional and niche markets. Cow milk is expected to remain dominant due to its wide acceptance across all age groups and foodservice sectors, ensuring steady market growth.

UHT Dairy Products By Source

B2C to Lead the Sales Channel Segment with 68% Market Share in 2025

B2C is the leading sales channel segment, holding the market share of 68% in the market.

  • Retail outlets, supermarkets, hypermarkets, and online platforms remain primary distribution channels as they ensure wide availability and consumer access to branded UHT products.
  • The growth of this segment is driven by increasing urbanisation, busy lifestyles, and rising e-commerce penetration that provides convenient doorstep delivery.

UHT Dairy Products Market Dynamics

The UHT dairy products market is experiencing steady growth, driven by rising demand for long shelf-life dairy products, increasing urbanisation, and limited cold chain infrastructure. Growing adoption of advanced UHT processing technologies, along with strong demand from the food and beverage industry for safe, convenient, and nutritious dairy products, is further supporting market expansion.

Recent Trends in the UHT Dairy Products Market

  • Rising demand for UHT milk and cream due to limited refrigeration facilities in developing regions.
  • Adoption of advanced UHT processing technologies to enhance microbial safety and shelf life.
  • Increased launch of flavored UHT milk products catering to diverse consumer preferences.
  • Growing use of sustainable and recyclable packaging solutions by major dairy companies.

Challenges in the UHT Dairy Products Market
  • High initial investment costs for setting up UHT processing facilities.
  • Consumer perception issues regarding taste differences compared to fresh milk products.
  • Regulatory complexities and compliance requirements for dairy processing and packaging.
  • Volatility in raw milk supply due to seasonal and environmental factors impacting production.

Analyzing Top Countries Producing and Consuming UHT Dairy Products Market

UHT Dairy Products Country Wise

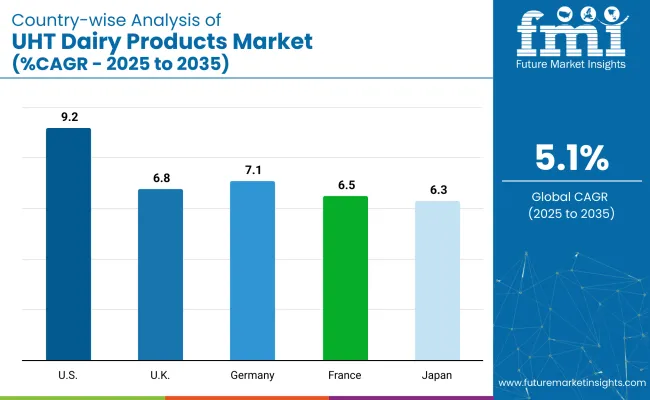
Among the top countries in the UHT dairy products market from 2025 to 2035, the USA shows the highest CAGR at 9.2%, driven by strong demand for UHT milk and lactose-free options. Germany follows with a CAGR of 7.1%, supported by rising flavored UHT milk consumption and foodservice demand.

The UK grows at 6.8% CAGR, driven by urban consumption and private label expansion. France records a CAGR of 6.5%, backed by strong dairy traditions and organic UHT milk demand, while Japan shows steady growth at 6.3% CAGR, supported by premium UHT milk imports and technological advancements in packaging and processing.

This report covers an in-depth analysis of 40+ countries; the five top-performing OECD Countries are highlighted below. 

USA UHT Dairy Products Market Analysis

The USA UHT dairy products market is projected to grow at a CAGR of 9.2% from 2025 to 2035.

  • Growing preference for UHT milk due to limited refrigeration needs.
  • Expansion of fast-food and quick-service restaurant sectors.
  • Increasing consumer demand for lactose-free UHT dairy options.
  • Major players like Schreiber Foods and Nestle are driving market expansion.

UHT Dairy Products Demand Analysis in the UK

Sales of UHT dairy products in the UK are expected to grow at a CAGR of 6.8% from 2025 to 2035.

  • Rising urban consumption of UHT milk and cream.
  • Expansion of private label UHT dairy products in supermarkets.
  • Increasing import of UHT dairy products from EU countries.
  • Companies like Arla Foods are focusing on UHT milk innovation.

Germany Dairy Products Market Analysis

The Germany UHT dairy products revenue is projected to grow at a CAGR of 7.1% from 2025 to 2035.

  • Rising demand for UHT cheese in foodservice and retail sectors.
  • Increased focus on energy-efficient UHT processing equipment.
  • Growing preference for flavored UHT milk among youth.
  • Strong distribution networks ensuring market reach and growth.

UHT Dairy Products Demand Analysis in France

The France UHT dairy products are expected to grow at a CAGR of 6.5% from 2025 to 2035.

  • Strong dairy tradition supporting UHT product growth.
  • Rising demand for organic and additive-free UHT milk.
  • Expansion of UHT milk exports to neighbouring EU countries.
  • Increasing use of sustainable Tetra Pak packaging solutions.

Japan UHT Dairy Products Market Analysis

The UHT dairy products market in Japan is projected to grow at a CAGR of 6.3% from 2025 to 2035.

  • Preference for high-quality UHT milk and cream products.
  • Technological advancements are enhancing product taste and quality.
  • Rising imports of premium UHT dairy products.
  • Growth in the foodservice sector is increasing UHT cream demand.
  • Companies like Meiji focus on UHT milk innovation and packaging.

Leading UHT Dairy Products Manufacturers and Suppliers

The UHT (Ultra-High Temperature) dairy products market is moderately consolidated, with a few multinational corporations holding significant market shares. Leading companies such as Nestlé, Groupe Lactalis, Fonterra, and Danone dominate the landscape, leveraging extensive distribution networks, diverse product portfolios, and strong brand recognition. These industry leaders focus on innovation, sustainability, and strategic partnerships to maintain their competitive edge.

Top companies are competing through various strategies, including pricing, product innovation, partnerships, and expansion into emerging markets. For instance, Nestlé emphasizes sustainable packaging and nutritional product development, while Fonterra focuses on B2B dairy nutrition solutions. Groupe Lactalis has expanded its global footprint through acquisitions, and Danone invests in health-focused dairy products. These strategies aim to cater to evolving consumer preferences and regulatory requirements.

Recent UHT Dairy Products Industry News

In November 2024, Milky Mist, collaborated with SIG and AnaBio Technologies, unveiled the world’s first long-life probiotic buttermilk packaged in aseptic cartons. (Source: Milky Mist)

UHT Dairy Products - Report Scope

Report Attributes Details
Current Total Market Size (2025) USD 88.6 billion
Projected Market Size (2035) USD 145.4 billion
CAGR (2025 to 2035) 5.1%
Base Year for Estimation 2024
Historical Period 2020 to 2024
Projections Period 2025 to 2035
Market Analysis Parameters Revenue in USD billion/Volume in million ton
By Form Liquid, Semisolid, and Solid
By Product Type Milk, Cream, Cheese, Yogurt, Sauces, Milk Powder, and Ice Cream Mix
By Source Cow, Buffalo, Goat, and Others (Camel Milk, Sheep Milk, a nd Mixed Animal Milk Sources)
By Sales Channel B2B, B2C
Regions Covered North America, Latin America, Western Europe, Eastern Europe, East Asia, South Asia & Pacific, Middle East & Africa
Countries Covered United States, Canada, United Kingdom, Germany, France, China, Japan, South Korea, Brazil, Australia
Key Players Nestle, Dana Dairy Group, Anchor, Amul (GCMMF), Grupo Lala, Fonterra, Groupe Lactalis, Yili Group, Dairy Farmers of America, Arla Foods, and Mother Dairy.
Additional Attributes Dollar sales by value, market share analysis by region, and country-wise analysis.

Key Segmentation

By Form:

As per Form, the industry has been categorized into, Liquid, Semisolid and Solid.

By Product Type:

As per Product Type, the industry has been categorized into Milk, Cream, Cheese, Yogurt, Sauces, Milk Powder, and Ice Cream Mix.

By Source:

This segment is further categorized into Cow, Buffalo, Goat, and Others.

By Sales Channel:

As per the sales channel, the industry has been categorized into B2B, and B2C (Distributor, Dairy Shops, Grocery shops, Supermarkets, and Online Platforms).

By Region:

Industry analysis has been carried out in key countries of North America, Latin America, Western Europe Eastern Europe, Balkans & Baltic Countries, Russia & Belarus, Central Asia, East Asia, South Asia & Pacific, and the Middle East & Africa.

Table of Content

  1. Executive Summary
    • Global Market Outlook
    • Demand-side Trends
    • Supply-side Trends
    • Technology Roadmap Analysis
    • Analysis and Recommendations
  2. Market Overview
    • Market Coverage/Taxonomy
    • Market Definition/Scope/Limitations
  3. Market Background
    • Market Dynamics
      • Drivers
      • Restraints
      • Opportunity
      • Trends
    • Scenario Forecast
      • Demand in Optimistic Scenario
      • Demand in Likely Scenario
      • Demand in Conservative Scenario
    • Opportunity Map Analysis
    • Product Life Cycle Analysis
    • Supply Chain Analysis
      • Supply Side Participants and their Roles
        • Producers
        • Mid-Level Participants (Traders/ Agents/ Brokers)
        • Wholesalers and Distributors
      • Value Added and Value Created at Node in the Supply Chain
      • List of Raw Material Suppliers
      • List of Existing and Potential Buyer’s
    • Investment Feasibility Matrix
    • Value Chain Analysis
      • Profit Margin Analysis
      • Wholesalers and Distributors
      • Retailers
    • PESTLE and Porter’s Analysis
    • Regulatory Landscape
      • By Key Regions
      • By Key Countries
    • Regional Parent Market Outlook
    • Production and Consumption Statistics
    • Import and Export Statistics
  4. Global Market Analysis 2020 to 2024 and Forecast, 2025 to 2035
    • Historical Market Size Value (USD Billion) & Volume (Metric Tons) Analysis, 2020 to 2024
    • Current and Future Market Size Value (USD Billion) & Volume (Metric Tons) Projections, 2025 to 2035
      • Y-o-Y Growth Trend Analysis
      • Absolute $ Opportunity Analysis
  5. Global Market Pricing Analysis 2020 to 2024 and Forecast 2025 to 2035
  6. Global Market Analysis 2020 to 2024 and Forecast 2025 to 2035, By Form
    • Introduction / Key Findings
    • Historical Market Size Value (USD Billion) & Volume (Metric Tons) Analysis By Form, 2020 to 2024
    • Current and Future Market Size Value (USD Billion) & Volume (Metric Tons) Analysis and Forecast By Form, 2025 to 2035
      • Liquid
      • Semisolid
      • Solid
    • Y-o-Y Growth Trend Analysis By Form, 2020 to 2024
    • Absolute $ Opportunity Analysis By Form, 2025 to 2035
  7. Global Market Analysis 2020 to 2024 and Forecast 2025 to 2035, By Product Type
    • Introduction / Key Findings
    • Historical Market Size Value (USD Billion) & Volume (Metric Tons) Analysis By Product Type, 2020 to 2024
    • Current and Future Market Size Value (USD Billion) & Volume (Metric Tons) Analysis and Forecast By Product Type, 2025 to 2035
      • Milk
      • Cream
      • Cheese
      • Yogurt
      • Sauces
      • Milk Powder
      • Ice Cream Mix
    • Y-o-Y Growth Trend Analysis By Product Type, 2020 to 2024
    • Absolute $ Opportunity Analysis By Product Type, 2025 to 2035
  8. Global Market Analysis 2020 to 2024 and Forecast 2025 to 2035, By Source
    • Introduction / Key Findings
    • Historical Market Size Value (USD Billion) & Volume (Metric Tons) Analysis By Source, 2020 to 2024
    • Current and Future Market Size Value (USD Billion) & Volume (Metric Tons) Analysis and Forecast By Source, 2025 to 2035
      • Cow
      • Buffalo
      • Goat
      • Others
        • Camel Milk
        • Sheep Milk
        • Mixed Animal Milk Sources
    • Y-o-Y Growth Trend Analysis By Source, 2020 to 2024
    • Absolute $ Opportunity Analysis By Source, 2025 to 2035
  9. Global Market Analysis 2020 to 2024 and Forecast 2025 to 2035, By Sales Channel
    • Introduction / Key Findings
    • Historical Market Size Value (USD Billion) & Volume (Metric Tons) Analysis By Sales Channel, 2020 to 2024
    • Current and Future Market Size Value (USD Billion) & Volume (Metric Tons) Analysis and Forecast By Sales Channel, 2025 to 2035
      • B2B
      • B2C
    • Y-o-Y Growth Trend Analysis By Sales Channel, 2020 to 2024
    • Absolute $ Opportunity Analysis By Sales Channel, 2025 to 2035
  10. Global Market Analysis 2020 to 2024 and Forecast 2025 to 2035, By Region
    • Introduction
    • Historical Market Size Value (USD Billion) & Volume (Metric Tons) Analysis By Region, 2020 to 2024
    • Current Market Size Value (USD Billion) & Volume (Metric Tons) Analysis and Forecast By Region, 2025 to 2035
      • USA
      • Latin America
      • Western Europe
      • Eastern Europe
      • East Asia
      • South Asia & Pacific
      • Middle East and Africa
    • Market Attractiveness Analysis By Region
  11. USA Market Analysis 2020 to 2024 and Forecast 2025 to 2035, By Country
    • Historical Market Size Value (USD Billion) & Volume (Metric Tons) Trend Analysis By Market Taxonomy, 2020 to 2024
    • Market Size Value (USD Billion) & Volume (Metric Tons) Forecast By Market Taxonomy, 2025 to 2035
      • By Country
        • Canada
        • Brazil
        • Mexico
        • Argentina
      • By Form
      • By Product Type
      • By Source
      • By Sales Channel
    • Market Attractiveness Analysis
      • By Country
      • By Form
      • By Product Type
      • By Source
      • By Sales Channel
    • Key Takeaways
  12. Latin America Market Analysis 2020 to 2024 and Forecast 2025 to 2035, By Country
    • Historical Market Size Value (USD Billion) & Volume (Metric Tons) Trend Analysis By Market Taxonomy, 2020 to 2024
    • Market Size Value (USD Billion) & Volume (Metric Tons) Forecast By Market Taxonomy, 2025 to 2035
      • By Country
        • Brazil
        • Argentina
        • Rest of LATAM
      • By Form
      • By Product Type
      • By Source
      • By Sales Channel
    • Market Attractiveness Analysis
      • By Country
      • By Form
      • By Product Type
      • By Source
      • By Sales Channel
    • Key Takeaways
  13. Western Europe Market Analysis 2020 to 2024 and Forecast 2025 to 2035, By Country
    • Historical Market Size Value (USD Billion) & Volume (Metric Tons) Trend Analysis By Market Taxonomy, 2020 to 2024
    • Market Size Value (USD Billion) & Volume (Metric Tons) Forecast By Market Taxonomy, 2025 to 2035
      • By Country
        • Germany
        • Italy
        • France
        • UK
        • Spain
        • BENELUX
        • Nordic
        • Rest of W.Europe
      • By Form
      • By Product Type
      • By Source
      • By Sales Channel
    • Market Attractiveness Analysis
      • By Country
      • By Form
      • By Product Type
      • By Source
      • By Sales Channel
    • Key Takeaways
  14. Eastern Europe Market Analysis 2020 to 2024 and Forecast 2025 to 2035, By Country
    • Historical Market Size Value (USD Billion) & Volume (Metric Tons) Trend Analysis By Market Taxonomy, 2020 to 2024
    • Market Size Value (USD Billion) & Volume (Metric Tons) Forecast By Market Taxonomy, 2025 to 2035
      • By Country
        • Russia
        • Hungary
        • Poland
        • Balkan & Baltics
        • Rest of E. Europe
      • By Form
      • By Product Type
      • By Source
      • By Sales Channel
    • Market Attractiveness Analysis
      • By Country
      • By Form
      • By Product Type
      • By Source
      • By Sales Channel
    • Key Takeaways
  15. East Asia Market Analysis 2020 to 2024 and Forecast 2025 to 2035, By Country
    • Historical Market Size Value (USD Billion) & Volume (Metric Tons) Trend Analysis By Market Taxonomy, 2020 to 2024
    • Market Size Value (USD Billion) & Volume (Metric Tons) Forecast By Market Taxonomy, 2025 to 2035
      • By Country
        • China
        • Japan
        • South Korea
      • By Form
      • By Product Type
      • By Source
      • By Sales Channel
    • Market Attractiveness Analysis
      • By Country
      • By Form
      • By Product Type
      • By Source
      • By Sales Channel
    • Key Takeaways
  16. South Asia & Pacific Market Analysis 2020 to 2024 and Forecast 2025 to 2035, By Country
    • Historical Market Size Value (USD Billion) & Volume (Metric Tons) Trend Analysis By Market Taxonomy, 2020 to 2024
    • Market Size Value (USD Billion) & Volume (Metric Tons) Forecast By Market Taxonomy, 2025 to 2035
      • By Country
        • India
        • Australia & New Zealand
        • ASEAN
        • Rest of SAP
      • By Form
      • By Product Type
      • By Source
      • By Sales Channel
    • Market Attractiveness Analysis
      • By Country
      • By Form
      • By Product Type
      • By Source
      • By Sales Channel
    • Key Takeaways
  17. Middle East and Africa Market Analysis 2020 to 2024 and Forecast 2025 to 2035, By Country
    • Historical Market Size Value (USD Billion) & Volume (Metric Tons) Trend Analysis By Market Taxonomy, 2020 to 2024
    • Market Size Value (USD Billion) & Volume (Metric Tons) Forecast By Market Taxonomy, 2025 to 2035
      • By Country
        • GCC Countries
        • Northern Africa
        • South Africa
        • Turkiye
        • Rest of MEA
      • By Form
      • By Product Type
      • By Source
      • By Sales Channel
    • Market Attractiveness Analysis
      • By Country
      • By Form
      • By Product Type
      • By Source
      • By Sales Channel
    • Key Takeaways
  18. Key Countries Market Analysis
    • USA
      • Pricing Analysis
      • Market Share Analysis, 2024
        • By Form
        • By Product Type
        • By Source
        • By Sales Channel
    • Canada
      • Pricing Analysis
      • Market Share Analysis, 2024
        • By Form
        • By Product Type
        • By Source
        • By Sales Channel
    • Brazil
      • Pricing Analysis
      • Market Share Analysis, 2024
        • By Form
        • By Product Type
        • By Source
        • By Sales Channel
    • Mexico
      • Pricing Analysis
      • Market Share Analysis, 2024
        • By Form
        • By Product Type
        • By Source
        • By Sales Channel
    • Argentina
      • Pricing Analysis
      • Market Share Analysis, 2024
        • By Form
        • By Product Type
        • By Source
        • By Sales Channel
  19. Market Structure Analysis
    • Competition Dashboard
    • Competition Benchmarking
    • Market Share Analysis of Top Players
      • By Regional
      • By Form
      • By Product Type
      • By Source
      • By Sales Channel
  20. Competition Analysis
    • Competition Deep Dive
      • Nestle
        • Overview
        • Product Portfolio
        • Profitability by Market Segments (Product/Age /Sales Channel/Region)
        • Sales Footprint
        • Strategy Overview
          • Marketing Strategy
          • Product Strategy
          • Channel Strategy
      • Dana Dairy Group
        • Overview
        • Product Portfolio
        • Profitability by Market Segments (Product/Age /Sales Channel/Region)
        • Sales Footprint
        • Strategy Overview
          • Marketing Strategy
          • Product Strategy
          • Channel Strategy
      • Anchor
        • Overview
        • Product Portfolio
        • Profitability by Market Segments (Product/Age /Sales Channel/Region)
        • Sales Footprint
        • Strategy Overview
          • Marketing Strategy
          • Product Strategy
          • Channel Strategy
      • Amul (GCMMF)
        • Overview
        • Product Portfolio
        • Profitability by Market Segments (Product/Age /Sales Channel/Region)
        • Sales Footprint
        • Strategy Overview
          • Marketing Strategy
          • Product Strategy
          • Channel Strategy
      • Grupo Lala
        • Overview
        • Product Portfolio
        • Profitability by Market Segments (Product/Age /Sales Channel/Region)
        • Sales Footprint
        • Strategy Overview
          • Marketing Strategy
          • Product Strategy
          • Channel Strategy
      • Fonterra
        • Overview
        • Product Portfolio
        • Profitability by Market Segments (Product/Age /Sales Channel/Region)
        • Sales Footprint
        • Strategy Overview
          • Marketing Strategy
          • Product Strategy
          • Channel Strategy
      • Groupe Lactalis
        • Overview
        • Product Portfolio
        • Profitability by Market Segments (Product/Age /Sales Channel/Region)
        • Sales Footprint
        • Strategy Overview
          • Marketing Strategy
          • Product Strategy
          • Channel Strategy
      • Yili Group
        • Overview
        • Product Portfolio
        • Profitability by Market Segments (Product/Age /Sales Channel/Region)
        • Sales Footprint
        • Strategy Overview
          • Marketing Strategy
          • Product Strategy
          • Channel Strategy
      • Dairy Farmers of America
        • Overview
        • Product Portfolio
        • Profitability by Market Segments (Product/Age /Sales Channel/Region)
        • Sales Footprint
        • Strategy Overview
          • Marketing Strategy
          • Product Strategy
          • Channel Strategy
      • Arla Foods
        • Overview
        • Product Portfolio
        • Profitability by Market Segments (Product/Age /Sales Channel/Region)
        • Sales Footprint
        • Strategy Overview
          • Marketing Strategy
          • Product Strategy
          • Channel Strategy
      • Mother Dairy
        • Overview
        • Product Portfolio
        • Profitability by Market Segments (Product/Age /Sales Channel/Region)
        • Sales Footprint
        • Strategy Overview
          • Marketing Strategy
          • Product Strategy
          • Channel Strategy
  21. Assumptions & Acronyms Used
  22. Research Methodology

List of Tables

  • Table 1: Global Market Value (USD Billion) Forecast by Region, 2020-2035
  • Table 2: Global Market Volume (Metric Tons) Forecast by Region, 2020-2035
  • Table 3: Global Market Value (USD Billion) Forecast by Form, 2020-2035
  • Table 4: Global Market Volume (Metric Tons) Forecast by Form, 2020-2035
  • Table 5: Global Market Value (USD Billion) Forecast by Product Type, 2020-2035
  • Table 6: Global Market Volume (Metric Tons) Forecast by Product Type, 2020-2035
  • Table 7: Global Market Value (USD Billion) Forecast by Source, 2020-2035
  • Table 8: Global Market Volume (Metric Tons) Forecast by Source, 2020-2035
  • Table 9: Global Market Value (USD Billion) Forecast by Sales Channel, 2020-2035
  • Table 10: Global Market Volume (Metric Tons) Forecast by Sales Channel, 2020-2035
  • Table 11: USA Market Value (USD Billion) Forecast by Country, 2020-2035
  • Table 12: USA Market Volume (Metric Tons) Forecast by Country, 2020-2035
  • Table 13: USA Market Value (USD Billion) Forecast by Form, 2020-2035
  • Table 14: USA Market Volume (Metric Tons) Forecast by Form, 2020-2035
  • Table 15: USA Market Value (USD Billion) Forecast by Product Type, 2020-2035
  • Table 16: USA Market Volume (Metric Tons) Forecast by Product Type, 2020-2035
  • Table 17: USA Market Value (USD Billion) Forecast by Source, 2020-2035
  • Table 18: USA Market Volume (Metric Tons) Forecast by Source, 2020-2035
  • Table 19: USA Market Value (USD Billion) Forecast by Sales Channel, 2020-2035
  • Table 20: USA Market Volume (Metric Tons) Forecast by Sales Channel, 2020-2035
  • Table 21: Latin America Market Value (USD Billion) Forecast by Country, 2020-2035
  • Table 22: Latin America Market Volume (Metric Tons) Forecast by Country, 2020-2035
  • Table 23: Latin America Market Value (USD Billion) Forecast by Form, 2020-2035
  • Table 24: Latin America Market Volume (Metric Tons) Forecast by Form, 2020-2035
  • Table 25: Latin America Market Value (USD Billion) Forecast by Product Type, 2020-2035
  • Table 26: Latin America Market Volume (Metric Tons) Forecast by Product Type, 2020-2035
  • Table 27: Latin America Market Value (USD Billion) Forecast by Source, 2020-2035
  • Table 28: Latin America Market Volume (Metric Tons) Forecast by Source, 2020-2035
  • Table 29: Latin America Market Value (USD Billion) Forecast by Sales Channel, 2020-2035
  • Table 30: Latin America Market Volume (Metric Tons) Forecast by Sales Channel, 2020-2035
  • Table 31: Western Europe Market Value (USD Billion) Forecast by Country, 2020-2035
  • Table 32: Western Europe Market Volume (Metric Tons) Forecast by Country, 2020-2035
  • Table 33: Western Europe Market Value (USD Billion) Forecast by Form, 2020-2035
  • Table 34: Western Europe Market Volume (Metric Tons) Forecast by Form, 2020-2035
  • Table 35: Western Europe Market Value (USD Billion) Forecast by Product Type, 2020-2035
  • Table 36: Western Europe Market Volume (Metric Tons) Forecast by Product Type, 2020-2035
  • Table 37: Western Europe Market Value (USD Billion) Forecast by Source, 2020-2035
  • Table 38: Western Europe Market Volume (Metric Tons) Forecast by Source, 2020-2035
  • Table 39: Western Europe Market Value (USD Billion) Forecast by Sales Channel, 2020-2035
  • Table 40: Western Europe Market Volume (Metric Tons) Forecast by Sales Channel, 2020-2035
  • Table 41: Eastern Europe Market Value (USD Billion) Forecast by Country, 2020-2035
  • Table 42: Eastern Europe Market Volume (Metric Tons) Forecast by Country, 2020-2035
  • Table 43: Eastern Europe Market Value (USD Billion) Forecast by Form, 2020-2035
  • Table 44: Eastern Europe Market Volume (Metric Tons) Forecast by Form, 2020-2035
  • Table 45: Eastern Europe Market Value (USD Billion) Forecast by Product Type, 2020-2035
  • Table 46: Eastern Europe Market Volume (Metric Tons) Forecast by Product Type, 2020-2035
  • Table 47: Eastern Europe Market Value (USD Billion) Forecast by Source, 2020-2035
  • Table 48: Eastern Europe Market Volume (Metric Tons) Forecast by Source, 2020-2035
  • Table 49: Eastern Europe Market Value (USD Billion) Forecast by Sales Channel, 2020-2035
  • Table 50: Eastern Europe Market Volume (Metric Tons) Forecast by Sales Channel, 2020-2035
  • Table 51: East Asia Market Value (USD Billion) Forecast by Country, 2020-2035
  • Table 52: East Asia Market Volume (Metric Tons) Forecast by Country, 2020-2035
  • Table 53: East Asia Market Value (USD Billion) Forecast by Form, 2020-2035
  • Table 54: East Asia Market Volume (Metric Tons) Forecast by Form, 2020-2035
  • Table 55: East Asia Market Value (USD Billion) Forecast by Product Type, 2020-2035
  • Table 56: East Asia Market Volume (Metric Tons) Forecast by Product Type, 2020-2035
  • Table 57: East Asia Market Value (USD Billion) Forecast by Source, 2020-2035
  • Table 58: East Asia Market Volume (Metric Tons) Forecast by Source, 2020-2035
  • Table 59: East Asia Market Value (USD Billion) Forecast by Sales Channel, 2020-2035
  • Table 60: East Asia Market Volume (Metric Tons) Forecast by Sales Channel, 2020-2035
  • Table 61: South Asia & Pacific Market Value (USD Billion) Forecast by Country, 2020-2035
  • Table 62: South Asia & Pacific Market Volume (Metric Tons) Forecast by Country, 2020-2035
  • Table 63: South Asia & Pacific Market Value (USD Billion) Forecast by Form, 2020-2035
  • Table 64: South Asia & Pacific Market Volume (Metric Tons) Forecast by Form, 2020-2035
  • Table 65: South Asia & Pacific Market Value (USD Billion) Forecast by Product Type, 2020-2035
  • Table 66: South Asia & Pacific Market Volume (Metric Tons) Forecast by Product Type, 2020-2035
  • Table 67: South Asia & Pacific Market Value (USD Billion) Forecast by Source, 2020-2035
  • Table 68: South Asia & Pacific Market Volume (Metric Tons) Forecast by Source, 2020-2035
  • Table 69: South Asia & Pacific Market Value (USD Billion) Forecast by Sales Channel, 2020-2035
  • Table 70: South Asia & Pacific Market Volume (Metric Tons) Forecast by Sales Channel, 2020-2035
  • Table 71: Middle East and Africa Market Value (USD Billion) Forecast by Country, 2020-2035
  • Table 72: Middle East and Africa Market Volume (Metric Tons) Forecast by Country, 2020-2035
  • Table 73: Middle East and Africa Market Value (USD Billion) Forecast by Form, 2020-2035
  • Table 74: Middle East and Africa Market Volume (Metric Tons) Forecast by Form, 2020-2035
  • Table 75: Middle East and Africa Market Value (USD Billion) Forecast by Product Type, 2020-2035
  • Table 76: Middle East and Africa Market Volume (Metric Tons) Forecast by Product Type, 2020-2035
  • Table 77: Middle East and Africa Market Value (USD Billion) Forecast by Source, 2020-2035
  • Table 78: Middle East and Africa Market Volume (Metric Tons) Forecast by Source, 2020-2035
  • Table 79: Middle East and Africa Market Value (USD Billion) Forecast by Sales Channel, 2020-2035
  • Table 80: Middle East and Africa Market Volume (Metric Tons) Forecast by Sales Channel, 2020-2035

List of Figures

  • Figure 1: Global Market Volume (Metric Tons) Forecast 2020-2035
  • Figure 2: Global Market Pricing Analysis
  • Figure 3: Global Market Value (USD Billion) Forecast 2020-2035
  • Figure 4: Global Market Value Share and BPS Analysis by Form, 2025 and 2035
  • Figure 5: Global Market Y-o-Y Growth Comparison by Form, 2025-2035
  • Figure 6: Global Market Attractiveness Analysis by Form
  • Figure 7: Global Market Value Share and BPS Analysis by Product Type, 2025 and 2035
  • Figure 8: Global Market Y-o-Y Growth Comparison by Product Type, 2025-2035
  • Figure 9: Global Market Attractiveness Analysis by Product Type
  • Figure 10: Global Market Value Share and BPS Analysis by Source, 2025 and 2035
  • Figure 11: Global Market Y-o-Y Growth Comparison by Source, 2025-2035
  • Figure 12: Global Market Attractiveness Analysis by Source
  • Figure 13: Global Market Value Share and BPS Analysis by Sales Channel, 2025 and 2035
  • Figure 14: Global Market Y-o-Y Growth Comparison by Sales Channel, 2025-2035
  • Figure 15: Global Market Attractiveness Analysis by Sales Channel
  • Figure 16: Global Market Value (USD Billion) Share and BPS Analysis by Region, 2025 and 2035
  • Figure 17: Global Market Y-o-Y Growth Comparison by Region, 2025-2035
  • Figure 18: Global Market Attractiveness Analysis by Region
  • Figure 19: USA Market Incremental $ Opportunity, 2025-2035
  • Figure 20: Latin America Market Incremental $ Opportunity, 2025-2035
  • Figure 21: Western Europe Market Incremental $ Opportunity, 2025-2035
  • Figure 22: Eastern Europe Market Incremental $ Opportunity, 2025-2035
  • Figure 23: East Asia Market Incremental $ Opportunity, 2025-2035
  • Figure 24: South Asia & Pacific Market Incremental $ Opportunity, 2025-2035
  • Figure 25: Middle East and Africa Market Incremental $ Opportunity, 2025-2035
  • Figure 26: USA Market Value Share and BPS Analysis by Country, 2025 and 2035
  • Figure 27: USA Market Value Share and BPS Analysis by Form, 2025 and 2035
  • Figure 28: USA Market Y-o-Y Growth Comparison by Form, 2025-2035
  • Figure 29: USA Market Attractiveness Analysis by Form
  • Figure 30: USA Market Value Share and BPS Analysis by Product Type, 2025 and 2035
  • Figure 31: USA Market Y-o-Y Growth Comparison by Product Type, 2025-2035
  • Figure 32: USA Market Attractiveness Analysis by Product Type
  • Figure 33: USA Market Value Share and BPS Analysis by Source, 2025 and 2035
  • Figure 34: USA Market Y-o-Y Growth Comparison by Source, 2025-2035
  • Figure 35: USA Market Attractiveness Analysis by Source
  • Figure 36: USA Market Value Share and BPS Analysis by Sales Channel, 2025 and 2035
  • Figure 37: USA Market Y-o-Y Growth Comparison by Sales Channel, 2025-2035
  • Figure 38: USA Market Attractiveness Analysis by Sales Channel
  • Figure 39: Latin America Market Value Share and BPS Analysis by Country, 2025 and 2035
  • Figure 40: Latin America Market Value Share and BPS Analysis by Form, 2025 and 2035
  • Figure 41: Latin America Market Y-o-Y Growth Comparison by Form, 2025-2035
  • Figure 42: Latin America Market Attractiveness Analysis by Form
  • Figure 43: Latin America Market Value Share and BPS Analysis by Product Type, 2025 and 2035
  • Figure 44: Latin America Market Y-o-Y Growth Comparison by Product Type, 2025-2035
  • Figure 45: Latin America Market Attractiveness Analysis by Product Type
  • Figure 46: Latin America Market Value Share and BPS Analysis by Source, 2025 and 2035
  • Figure 47: Latin America Market Y-o-Y Growth Comparison by Source, 2025-2035
  • Figure 48: Latin America Market Attractiveness Analysis by Source
  • Figure 49: Latin America Market Value Share and BPS Analysis by Sales Channel, 2025 and 2035
  • Figure 50: Latin America Market Y-o-Y Growth Comparison by Sales Channel, 2025-2035
  • Figure 51: Latin America Market Attractiveness Analysis by Sales Channel
  • Figure 52: Western Europe Market Value Share and BPS Analysis by Country, 2025 and 2035
  • Figure 53: Western Europe Market Value Share and BPS Analysis by Form, 2025 and 2035
  • Figure 54: Western Europe Market Y-o-Y Growth Comparison by Form, 2025-2035
  • Figure 55: Western Europe Market Attractiveness Analysis by Form
  • Figure 56: Western Europe Market Value Share and BPS Analysis by Product Type, 2025 and 2035
  • Figure 57: Western Europe Market Y-o-Y Growth Comparison by Product Type, 2025-2035
  • Figure 58: Western Europe Market Attractiveness Analysis by Product Type
  • Figure 59: Western Europe Market Value Share and BPS Analysis by Source, 2025 and 2035
  • Figure 60: Western Europe Market Y-o-Y Growth Comparison by Source, 2025-2035
  • Figure 61: Western Europe Market Attractiveness Analysis by Source
  • Figure 62: Western Europe Market Value Share and BPS Analysis by Sales Channel, 2025 and 2035
  • Figure 63: Western Europe Market Y-o-Y Growth Comparison by Sales Channel, 2025-2035
  • Figure 64: Western Europe Market Attractiveness Analysis by Sales Channel
  • Figure 65: Eastern Europe Market Value Share and BPS Analysis by Country, 2025 and 2035
  • Figure 66: Eastern Europe Market Value Share and BPS Analysis by Form, 2025 and 2035
  • Figure 67: Eastern Europe Market Y-o-Y Growth Comparison by Form, 2025-2035
  • Figure 68: Eastern Europe Market Attractiveness Analysis by Form
  • Figure 69: Eastern Europe Market Value Share and BPS Analysis by Product Type, 2025 and 2035
  • Figure 70: Eastern Europe Market Y-o-Y Growth Comparison by Product Type, 2025-2035
  • Figure 71: Eastern Europe Market Attractiveness Analysis by Product Type
  • Figure 72: Eastern Europe Market Value Share and BPS Analysis by Source, 2025 and 2035
  • Figure 73: Eastern Europe Market Y-o-Y Growth Comparison by Source, 2025-2035
  • Figure 74: Eastern Europe Market Attractiveness Analysis by Source
  • Figure 75: Eastern Europe Market Value Share and BPS Analysis by Sales Channel, 2025 and 2035
  • Figure 76: Eastern Europe Market Y-o-Y Growth Comparison by Sales Channel, 2025-2035
  • Figure 77: Eastern Europe Market Attractiveness Analysis by Sales Channel
  • Figure 78: East Asia Market Value Share and BPS Analysis by Country, 2025 and 2035
  • Figure 79: East Asia Market Value Share and BPS Analysis by Form, 2025 and 2035
  • Figure 80: East Asia Market Y-o-Y Growth Comparison by Form, 2025-2035
  • Figure 81: East Asia Market Attractiveness Analysis by Form
  • Figure 82: East Asia Market Value Share and BPS Analysis by Product Type, 2025 and 2035
  • Figure 83: East Asia Market Y-o-Y Growth Comparison by Product Type, 2025-2035
  • Figure 84: East Asia Market Attractiveness Analysis by Product Type
  • Figure 85: East Asia Market Value Share and BPS Analysis by Source, 2025 and 2035
  • Figure 86: East Asia Market Y-o-Y Growth Comparison by Source, 2025-2035
  • Figure 87: East Asia Market Attractiveness Analysis by Source
  • Figure 88: East Asia Market Value Share and BPS Analysis by Sales Channel, 2025 and 2035
  • Figure 89: East Asia Market Y-o-Y Growth Comparison by Sales Channel, 2025-2035
  • Figure 90: East Asia Market Attractiveness Analysis by Sales Channel
  • Figure 91: South Asia & Pacific Market Value Share and BPS Analysis by Country, 2025 and 2035
  • Figure 92: South Asia & Pacific Market Value Share and BPS Analysis by Form, 2025 and 2035
  • Figure 93: South Asia & Pacific Market Y-o-Y Growth Comparison by Form, 2025-2035
  • Figure 94: South Asia & Pacific Market Attractiveness Analysis by Form
  • Figure 95: South Asia & Pacific Market Value Share and BPS Analysis by Product Type, 2025 and 2035
  • Figure 96: South Asia & Pacific Market Y-o-Y Growth Comparison by Product Type, 2025-2035
  • Figure 97: South Asia & Pacific Market Attractiveness Analysis by Product Type
  • Figure 98: South Asia & Pacific Market Value Share and BPS Analysis by Source, 2025 and 2035
  • Figure 99: South Asia & Pacific Market Y-o-Y Growth Comparison by Source, 2025-2035
  • Figure 100: South Asia & Pacific Market Attractiveness Analysis by Source
  • Figure 101: South Asia & Pacific Market Value Share and BPS Analysis by Sales Channel, 2025 and 2035
  • Figure 102: South Asia & Pacific Market Y-o-Y Growth Comparison by Sales Channel, 2025-2035
  • Figure 103: South Asia & Pacific Market Attractiveness Analysis by Sales Channel
  • Figure 104: Middle East and Africa Market Value Share and BPS Analysis by Country, 2025 and 2035
  • Figure 105: Middle East and Africa Market Value Share and BPS Analysis by Form, 2025 and 2035
  • Figure 106: Middle East and Africa Market Y-o-Y Growth Comparison by Form, 2025-2035
  • Figure 107: Middle East and Africa Market Attractiveness Analysis by Form
  • Figure 108: Middle East and Africa Market Value Share and BPS Analysis by Product Type, 2025 and 2035
  • Figure 109: Middle East and Africa Market Y-o-Y Growth Comparison by Product Type, 2025-2035
  • Figure 110: Middle East and Africa Market Attractiveness Analysis by Product Type
  • Figure 111: Middle East and Africa Market Value Share and BPS Analysis by Source, 2025 and 2035
  • Figure 112: Middle East and Africa Market Y-o-Y Growth Comparison by Source, 2025-2035
  • Figure 113: Middle East and Africa Market Attractiveness Analysis by Source
  • Figure 114: Middle East and Africa Market Value Share and BPS Analysis by Sales Channel, 2025 and 2035
  • Figure 115: Middle East and Africa Market Y-o-Y Growth Comparison by Sales Channel, 2025-2035
  • Figure 116: Middle East and Africa Market Attractiveness Analysis by Sales Channel
  • Figure 117: Global Market - Tier Structure Analysis
  • Figure 118: Global Market - Company Share Analysis

Frequently Asked Questions

What is the projected size of the UHT dairy products market?

The market is valued at USD 88.6 billion in 2025.

What will be the expected size of the UHT dairy products market by 2035?

The market is projected to reach USD 145.4 billion by 2035.

What is the CAGR of the UHT dairy products market from 2025 to 2035?

The market is expected to grow at a CAGR of 5.1% during this period.

Which product type leads the UHT dairy products market?

UHT liquid milk is the leading product type, holding 74.6% market share.

Which country has the highest CAGR in the UHT dairy products market?

The USA has the highest CAGR in the market, projected at 9.2% from 2025 to 2035.

Explore Similar Insights

Future Market Insights

UHT Dairy Products Market