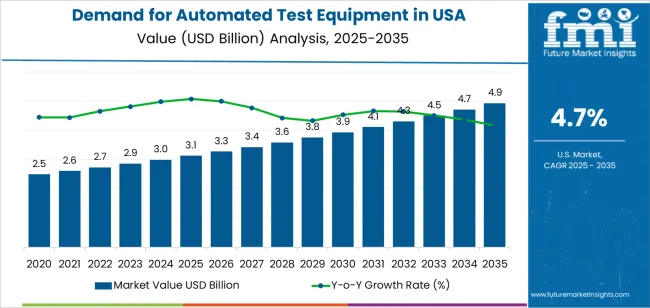
The USA automated test equipment demand is valued at USD 3.1 billion in 2025 and is projected to reach USD 4.9 billion by 2035, advancing at a CAGR of 4.7%. Demand is supported by ongoing semiconductor production, growth in electronics manufacturing, and increasing complexity of integrated circuits that require high-precision, high-throughput testing. Automated test equipment enables functional verification, parametric measurement, and system-level assessment for devices used in computing, communication, automotive electronics, and industrial automation. The rise of advanced node fabrication and heterogeneous chip integration continues to reinforce equipment needs across major USA manufacturing centers.
Semiconductor ATE represents the leading segment due to its essential role in testing processors, memory components, power devices, and RF modules. These systems offer scalable test architectures, high-speed measurement capability, and compatibility with varied chip designs. Advancements in thermal management, parallel test capability, and high-density interfaces are supporting efficient testing of complex system-on-chip and high-performance computing components.
Demand is strongest in the West, South, and Northeast, where semiconductor fabrication, electronics assembly, and R&D programs are concentrated. Key companies include Teradyne, National Instruments, Chroma ATE, Astronics Corporation, and Star Technologies. Their focus areas include precision measurement platforms, automated workflows, and improved reliability for high-volume device testing.
The 10-year growth comparison shows a steady expansion pattern shaped by semiconductor complexity, electronics manufacturing, and regulated testing needs. Between 2025 and 2030, growth will be stronger as chipmakers increase investment in advanced-node production, requiring high-precision test systems for signal integrity, power efficiency, and reliability validation. Additional gains will come from rising test volumes in automotive electronics and aerospace components, where safety and compliance standards drive structured testing cycles.
From 2030 to 2035, the growth profile will remain positive but more measured as automation levels stabilize across major USA production facilities. Procurement will shift toward incremental upgrades in test accuracy, throughput, and equipment integration rather than large-scale system expansion. Demand will continue to rise through replacement cycles and ongoing adoption of automated platforms for mixed-signal, RF, and high-power device testing. The decade-long comparison reflects a transition from capital-intensive expansion in early years to stable, performance-driven modernization supported by consistent semiconductor and electronics manufacturing activity in the United States.
| Metric | Value |
|---|---|
| USA Automated Test Equipment Sales Value (2025) | USD 3.1 billion |
| USA Automated Test Equipment Forecast Value (2035) | USD 4.9 billion |
| USA Automated Test Equipment Forecast CAGR (2025-2035) | 4.7% |
Demand for automated test equipment in the USA is increasing as semiconductor, automotive electronics and consumer-device manufacturers seek higher throughput and reliability in testing processes. The complexity of modern integrated circuits, such as power ICs, memory chips and system-on-chip units, requires advanced test systems to ensure performance and compliance. Rising deployment of 5G, artificial-intelligence hardware and electric-vehicle electronics drives need for dedicated test equipment.
Adoption of automation and digitalisation in manufacturing operations supports use of test-systems that reduce human error and cycle time. stricter quality-control standards and yield-pressure in domestic manufacturing further encourage investment in automated test equipment. The industry faces challenges in high capital cost of test systems, lengthy qualification and integration periods and the need for skilled engineers to operate and maintain equipment. Supply-chain complexity and varying product lifecycles also affect procurement decisions and can slow adoption rates.
Demand for automated test equipment (ATE) in the United States is shaped by semiconductor production requirements, electronics quality standards, and the expansion of connected devices. Industry distribution across type, application, and end-use categories reflects test-accuracy needs, production scale, and integration with digital manufacturing systems. Buyers prioritize reliability, throughput, and compatibility with high-density, high-speed components.
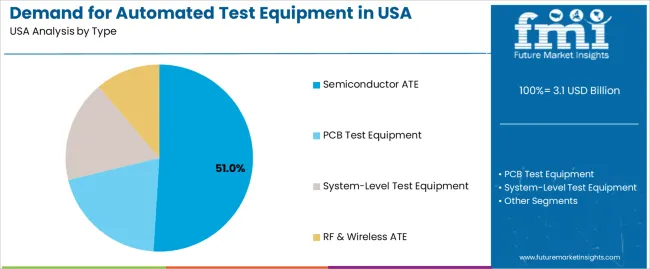
Semiconductor ATE leads the segment with an estimated 51.0% share of USA demand. It supports wafer-level, packaged-chip, and high-performance device testing in fabrication and packaging facilities. As component densities increase and integration requirements tighten, semiconductor ATE remains essential for ensuring defect detection, yield improvement, and compliance with performance specifications. PCB test equipment represents 21.0%, serving printed circuit board validation in industrial electronics, automotive modules, and consumer devices. System-level test equipment holds 18.0%, supporting final-stage product verification under real-world operating conditions. RF and wireless ATE represents 10.0%, reflecting demand for high-frequency testing across telecommunications and IoT devices.
Key drivers and attributes:
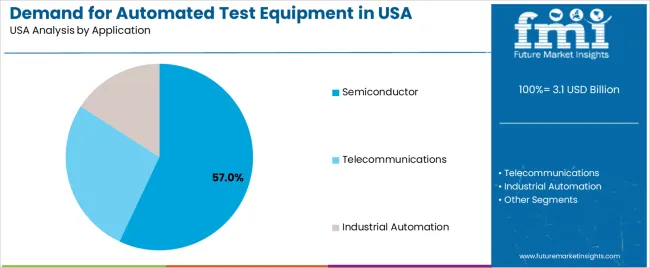
The semiconductor application segment holds an estimated 57.0% share of USA demand. Testing requirements expand as chip architectures adopt smaller geometries, heterogeneous integration, and advanced packaging formats. ATE systems enable electrical, functional, and parametric validation across manufacturing steps, supporting foundries, OSAT facilities, and integrated device manufacturers. Telecommunications applications account for 25.0%, driven by demand for RF validation, network-equipment testing, 5G component accuracy, and base-station hardware reliability. Industrial automation represents 18.0%, reflecting use in motion-control modules, PLC components, and embedded industrial electronics.
Key drivers and attributes:
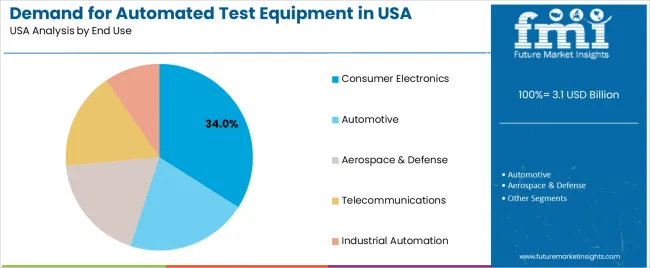
Consumer electronics represents an estimated 34.0% share of USA demand. High-volume production of smartphones, wearables, computing devices, smart home equipment, and accessories drives extensive use of ATE for component and system validation. Automotive electronics holds 27.0%, reflecting rapid electrification, advanced driver-assistance requirements, and integration of high-reliability electronic modules. Aerospace and defense accounts for 15.0%, based on strict performance verification for mission-critical electronics. Telecommunications represents 13.0%, driven by network infrastructure and high-frequency device testing. Industrial automation holds 11.0%, covering embedded controllers, sensors, and machine-equipment electronics.
Key drivers and attributes:
Increasing semiconductor fabrication capacity, rising complexity of electronic devices, and growth in automotive and communications testing are driving demand.
In the United States, demand for automated test equipment is expanding as semiconductor manufacturers expand domestic production capacity and shift to advanced node processes. Devices used in smartphones, IoT systems, 5G infrastructure and electric vehicles feature more integrated components and tighter performance requirements, increasing the need for automated testers. Automotive applications, especially for electric vehicles and autonomous driving systems, require extensive testing of sensors, control units and power electronics, which adds to ATE demand. Manufacturers of consumer electronics and other high-volume products use ATE to improve throughput, reduce defects and lower test cost per unit, which further supports uptake of test equipment.
High capital investment, long lifecycle of test systems, and evolving test requirements that may outpace equipment refresh cycles are restraining growth.
Automated test equipment systems involve substantial initial cost in hardware, software, fixtures and programming, which may limit purchases by smaller manufacturers or those with tight budgets. Many ATE systems remain in use for long production runs, which reduces replacement frequency and slows new unit sales. Rapid shifts in device architectures, packaging technologies or test protocols can render existing test equipment less effective or obsolete if not upgraded, forcing cautious investment behaviour. These factors combine to moderate growth in some segments of the USA industry.
Shift toward modular and flexible ATE platforms, increasing adoption of AI/ML in test analytics, and rising demand from automotive electronics and 5G/6G applications are shaping industry trends.
Manufacturers of automated test equipment are developing modular and flexible systems that can be reconfigured across multiple test types and device families, reducing cost of ownership. Artificial intelligence and machine-learning techniques are being integrated into test equipment for fault detection, predictive maintenance, yield optimisation and adaptive test sequences. The USA industry is seeing growing demand tied to automotive electronics testing (including EV powertrains, ADAS) and next-generation communication systems (5G/6G), which require high throughput and complex test coverage. These trends are positioning ATE as critical infrastructure for advanced manufacturing in the United States.
Demand for automated test equipment (ATE) in the United States is increasing through 2035 as semiconductor production expands, electronics assembly becomes more advanced, and testing requirements rise across automotive, aerospace, telecommunications, and industrial manufacturing. ATE supports high-precision validation, fault detection, and functional testing across integrated circuits, printed-circuit boards, power electronics, and communication modules. Growth reflects regional differences in fabrication facilities, technology clusters, and industrial-automation activity. The West leads with a 5.4% CAGR, followed by the South (4.8%), the Northeast (4.3%), and the Midwest (3.7%). Demand is shaped by R&D intensity, production-line automation, and investments in high-complexity component testing.
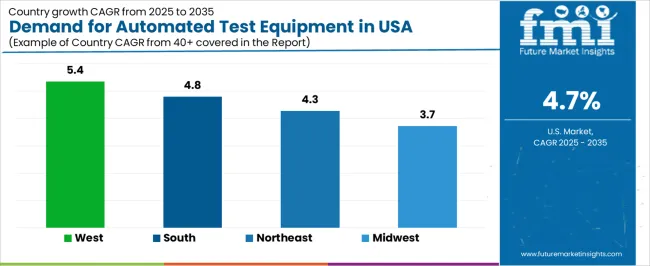
| Region | CAGR (2025-2035) |
|---|---|
| West | 5.4% |
| South | 4.8% |
| Northeast | 4.3% |
| Midwest | 3.7% |
The West grows at 5.4% CAGR, supported by strong semiconductor-fabrication activity, extensive electronics R&D, and high concentration of technology-driven manufacturing clusters. States such as California, Arizona, Oregon, and Washington rely heavily on ATE for wafer-level testing, IC packaging validation, and board-level functional testing in advanced electronics facilities. Semiconductor fabs adopt automated handlers, high-precision testers, and specialized modules for power-device evaluation. Telecommunications and computing industries in Western states also drive the need for ATE aligned with high-frequency, high-speed device testing. Increased investment in cleanroom expansions and engineering-lab facilities reinforces steady procurement of ATE across regional operations.
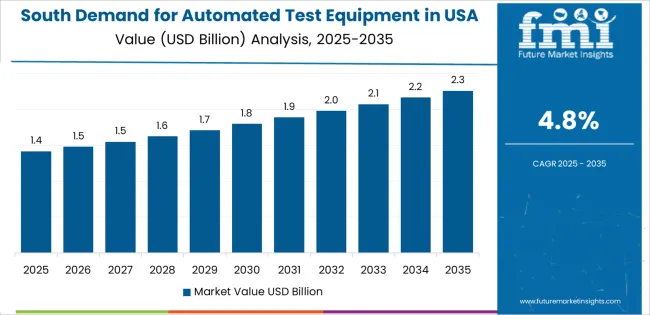
The South grows at 4.8% CAGR, driven by expanding electronics manufacturing, strong growth in automotive and aerospace supply chains, and rising adoption of automated testing in industrial production. States including Texas, Florida, Georgia, and North Carolina invest in new electronics-assembly lines and semiconductor-related facilities requiring functional and end-of-line testing. Automotive suppliers use ATE for power electronics, sensor validation, and control-module testing. Aerospace activity contributes to demand for reliability-oriented electronic-component testing. The region’s logistics and manufacturing infrastructure supports broader deployment of modular and scalable ATE systems suited for diverse production environments.
The Northeast grows at 4.3% CAGR, supported by strong engineering research activity, established telecommunications infrastructure, and greater dependence on test automation in medical-device and electronics production. States including New York, Pennsylvania, and Massachusetts use ATE for device characterization, signal-integrity testing, and component-level diagnostics across mixed-signal, RF, and digital systems. Research laboratories adopt automated testers to support advanced prototyping and reliability evaluation. Medical-device manufacturers rely on automated functional testers for compliance with precision-performance requirements. Higher concentration of engineering talent and laboratory networks sustains steady regional demand.
The Midwest grows at 3.7% CAGR, supported by established automotive, industrial-equipment, and machinery manufacturing sectors. States including Michigan, Ohio, Illinois, and Wisconsin use ATE for power electronics, motor-control systems, in-vehicle electronics, and industrial-automation component testing. Manufacturers rely on automated testers to improve throughput in production lines and maintain test consistency across large volumes of electromechanical assemblies. Industrial supply chains adopt automated fixture-based testing for sensors, controllers, and machine-control electronics. Growth is moderate due to mature manufacturing patterns, yet rising interest in electric-vehicle power-module testing supports long-term equipment use.
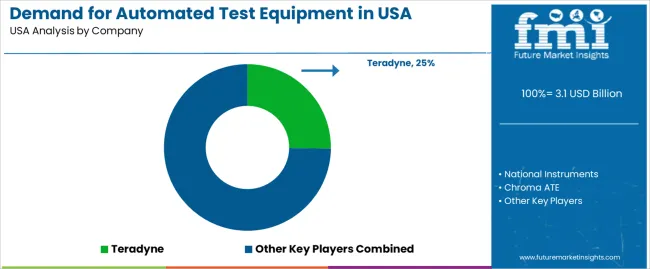
The automated test equipment industry in the United States is moderately concentrated, with major suppliers serving semiconductor fabrication, defense electronics, and advanced manufacturing. Teradyne leads the industry with an estimated 25.2% share, supported by its established semiconductor test platforms, consistent system reliability, and long-term integration with leading chip manufacturers. Its position is reinforced by controlled calibration processes and scalable architectures suited to high-volume device testing.
National Instruments follows as a significant competitor, offering modular test systems built around flexible hardware–software configurations. Its competitiveness relies on stable measurement accuracy, repeatable signal generation, and compatibility with complex mixed-signal test requirements. Chroma ATE maintains a strong presence through precision power electronics test platforms used in automotive, battery, and renewable energy applications, supported by documented performance consistency. Astronics Corporation and Star Technologies expand industry capability through aerospace, defense, and high-reliability electronics testing. Their strengths include ruggedized systems, multi-channel test capability, and integration with specialized mission-critical components.
Competition in the USA automated test equipment industry centers on test coverage, measurement stability, throughput efficiency, and system scalability. Demand is driven by continued growth in semiconductor device complexity, increased adoption of power electronics, and rising test requirements across automotive electrification and high-performance computing. The industry benefits from sustained investment in advanced electronic production and the need for predictable, high-accuracy testing across development and manufacturing workflows.
| Items | Values |
|---|---|
| Quantitative Units | USD billion |
| Type | Semiconductor ATE, PCB Test Equipment, System-Level Test Equipment, RF & Wireless ATE |
| Application | Semiconductor, Telecommunications, Industrial Automation |
| End Use | Consumer Electronics, Automotive, Aerospace & Defense, Telecommunications, Industrial Automation |
| Regions Covered | West, Midwest, South, Northeast |
| Key Companies Profiled | Teradyne, National Instruments, Chroma ATE, Astronics Corporation, Star Technologies |
| Additional Attributes | Dollar sales by type, application, and end-use categories; regional adoption trends across West, Midwest, South, and Northeast; competitive landscape of automated test equipment manufacturers; advancements in semiconductor testing, RF validation, and system-level diagnostics; integration with electronics manufacturing, telecom networks, and industrial automation systems. |
The global demand for automated test equipment in USA is estimated to be valued at USD 3.1 billion in 2025.
The market size for the demand for automated test equipment in USA is projected to reach USD 4.9 billion by 2035.
The demand for automated test equipment in USA is expected to grow at a 4.7% CAGR between 2025 and 2035.
The key product types in demand for automated test equipment in USA are semiconductor ate, pcb test equipment, system-level test equipment and rf & wireless ate.
In terms of application, semiconductor segment to command 57.0% share in the demand for automated test equipment in USA in 2025.


Our Research Products

The "Full Research Suite" delivers actionable market intel, deep dives on markets or technologies, so clients act faster, cut risk, and unlock growth.

The Leaderboard benchmarks and ranks top vendors, classifying them as Established Leaders, Leading Challengers, or Disruptors & Challengers.

Locates where complements amplify value and substitutes erode it, forecasting net impact by horizon

We deliver granular, decision-grade intel: market sizing, 5-year forecasts, pricing, adoption, usage, revenue, and operational KPIs—plus competitor tracking, regulation, and value chains—across 60 countries broadly.

Spot the shifts before they hit your P&L. We track inflection points, adoption curves, pricing moves, and ecosystem plays to show where demand is heading, why it is changing, and what to do next across high-growth markets and disruptive tech

Real-time reads of user behavior. We track shifting priorities, perceptions of today’s and next-gen services, and provider experience, then pace how fast tech moves from trial to adoption, blending buyer, consumer, and channel inputs with social signals (#WhySwitch, #UX).

Partner with our analyst team to build a custom report designed around your business priorities. From analysing market trends to assessing competitors or crafting bespoke datasets, we tailor insights to your needs.
Supplier Intelligence
Discovery & Profiling
Capacity & Footprint
Performance & Risk
Compliance & Governance
Commercial Readiness
Who Supplies Whom
Scorecards & Shortlists
Playbooks & Docs
Category Intelligence
Definition & Scope
Demand & Use Cases
Cost Drivers
Market Structure
Supply Chain Map
Trade & Policy
Operating Norms
Deliverables
Buyer Intelligence
Account Basics
Spend & Scope
Procurement Model
Vendor Requirements
Terms & Policies
Entry Strategy
Pain Points & Triggers
Outputs
Pricing Analysis
Benchmarks
Trends
Should-Cost
Indexation
Landed Cost
Commercial Terms
Deliverables
Brand Analysis
Positioning & Value Prop
Share & Presence
Customer Evidence
Go-to-Market
Digital & Reputation
Compliance & Trust
KPIs & Gaps
Outputs
Full Research Suite comprises of:
Market outlook & trends analysis
Interviews & case studies
Strategic recommendations
Vendor profiles & capabilities analysis
5-year forecasts
8 regions and 60+ country-level data splits
Market segment data splits
12 months of continuous data updates
DELIVERED AS:
PDF EXCEL ONLINE
Demand Signal Repository Solutions Market Size and Share Forecast Outlook 2025 to 2035
Demand Side Management Market Size and Share Forecast Outlook 2025 to 2035
Demand Response Market Analysis - Size, Share, and Forecast Outlook 2025 to 2035
North America Shipping Supplies Market Trends – Innovations & Growth 2024-2034
Demand of Kozani Saffron in Greece Analysis - Size, Share & Forecast 2025 to 2035
Demand of No-acid Whey Strained Dairy Processing Concepts in European Union Size and Share Forecast Outlook 2025 to 2035
Demand for Bronte Pistachio in Italy Analysis - Size, Share & Forecast 2025 to 2035
Demand and Trend Analysis of Gaming Monitor in Western Europe Size and Share Forecast Outlook 2025 to 2035
Demand and Trend Analysis of Gaming Monitor in Japan Size and Share Forecast Outlook 2025 to 2035
Demand and Trend Analysis of Gaming Monitor in Korea Size and Share Forecast Outlook 2025 to 2035
Glycine Soja (Soybean) Seed Extract Market Size and Share Forecast Outlook 2025 to 2035
Demand and Trend Analysis of Yeast in Japan - Size, Share, and Forecast Outlook 2025 to 2035
Demand and Trends Analysis of Stevia in Japan Size and Share Forecast Outlook 2025 to 2035
Demand of Pistachio-based desserts & ingredients in France Analysis - Size, Share & Forecast 2025 to 2035
Japan Women’s Intimate Care Market Trends – Growth & Forecast 2024-2034
Western Europe Men’s Skincare Market Analysis – Forecast 2023-2033
Demand and Trend Analysis of Fabric Stain Remover in Korea Size and Share Forecast Outlook 2025 to 2035
Demand and Sales Analysis of Paper Cup in Japan Size and Share Forecast Outlook 2025 to 2035
Demand and Sales Analysis of Paper Cup in Korea Size and Share Forecast Outlook 2025 to 2035
Demand and Sales Analysis of Paper Cup in Western Europe Size and Share Forecast Outlook 2025 to 2035

Thank you!
You will receive an email from our Business Development Manager. Please be sure to check your SPAM/JUNK folder too.
Chat With
MaRIA