Demand for bag in box packaging in the USA is projected to increase from USD 1.4 billion in 2025 to USD 2.3 billion by 2035, supported by a steady CAGR of 5.3%. Growth is driven by rising adoption across beverage, food service, and industrial liquid applications where lightweight, sanitary, and cost-efficient formats are preferred. As companies shift toward packaging that lowers transportation weight, reduces waste, and maintains product freshness, bag in box solutions continue to gain traction. Wider use in wine, juice, dairy alternatives, sauces, syrups, oils, and cleaning solutions strengthens demand. Advancements in liner durability, oxygen barrier technology, and dispensing valves further enhance product performance, helping replace heavier rigid formats. Increasing emphasis on sustainability, reduced carbon output, and efficient material use also supports continued market expansion.
Additional momentum will come from the rapid growth of bulk dispensing systems in restaurants, cafeterias, institutional kitchens, and contract food manufacturing. At home beverage dispensing systems, cold brew coffee packaging, and meal kit liquid components are also contributing to broader use across the USA. Improvements in fill line automation, leak-resistant design, and long-distance transport compatibility position bag-in-box packaging as an efficient solution for both small brands and large-scale producers. Over the coming decade, evolving consumer preferences for convenience, combined with retailer pressure to adopt sustainable packaging alternatives, will keep demand strong. The format’s versatility, reduced environmental impact, and growing acceptance in multiple product categories will support a consistent upward trajectory through 2035.
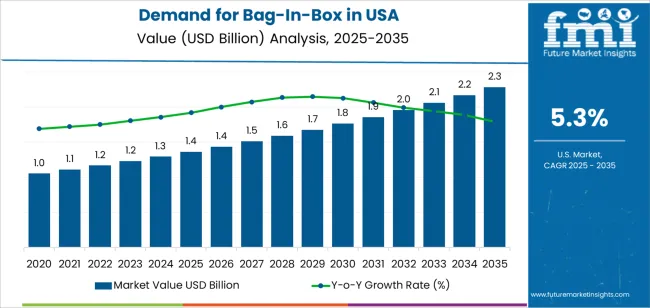
YOY progression within the USA bag-in-box segment reflects steady and predictable growth across the forecast period. From 2025 to 2026, values move from USD 1.4 billion to USD 1.4 billion, signaling a stable base year with minimal upward shift. Between 2026 and 2027, expansion to USD 1.5 billion shows early recovery momentum as adoption increases across food service and beverage distribution. Growth continues through 2028, with values reaching USD 1.6 billion, and then USD 1.7 billion in 2029, driven by higher demand in wine packaging, shelf stable food products, and institutional liquid transport.
From 2030 onward, YOY increases become more pronounced as the segment climbs from USD 1.8 billion to USD 1.9 billion in 2031, then to USD 2.0 billion in 2032, reflecting stronger gains in consumer packaged goods and at home beverage dispensing. Growth progresses to USD 2.1 billion in 2033 and USD 2.2 billion in 2034, before reaching USD 2.3 billion in 2035. This consistent YOY trajectory highlights a stable upward curve supported by sustained adoption in retail, food service, and institutional applications throughout the USA.
| Metric | Value |
|---|---|
| USA Bag-In-Box Packaging Sales Value (2025) | USD 74.1 million |
| USA Bag-In-Box Packaging Forecast Value (2035) | USD 106.7 million |
| USA Bag-In-Box Packaging Forecast CAGR (2025-2035) | 3.5% |
Demand for bag in box packaging in the USA is rising as food and beverage producers adopt formats that support longer shelf life, efficient dispensing and reduced material use. The format is widely used for wine, juices, dairy products and liquid foods where oxygen protection and portion control are important. Retailers and manufacturers value the lighter weight of bag in box packaging because it lowers transport costs and reduces storage needs compared with rigid containers. Growth in bulk formats for food service operators is also contributing, as restaurants and institutional kitchens continue to shift toward packaging that minimizes waste and simplifies handling. Interest in resource-efficient solutions is further supporting demand because the flexible bag and outer carton structure generally uses less plastic per unit than traditional bottles.
Another factor driving demand is the increasing adoption of bag in box formats in household and industrial liquids such as cleaning products, concentrates and automotive fluids. These products benefit from controlled dispensing, reduced spillage risk and longer USAbility once opened. E-commerce growth is playing a role because the protective outer carton improves durability in distribution. At the same time, consumer preferences for packaging that is easy to store, easy to empty and compatible with recycling systems add momentum to the format. While competition from rigid packaging and the need for specialized filling equipment present challenges for some producers, the overall market continues to grow as more industries adopt flexible, cost-efficient liquid packaging options.
Demand for bag-in-box in the USA is segmented by end-use industry and product type. The leading end-use industry is beverages, accounting for 40% of demand, while the leading product type is the flexible bag, holding 60% of the market. These segments shape the overall landscape of bag-in-box use across the country as industries continue to adopt packaging that supports efficiency, product protection, and extended shelf life.
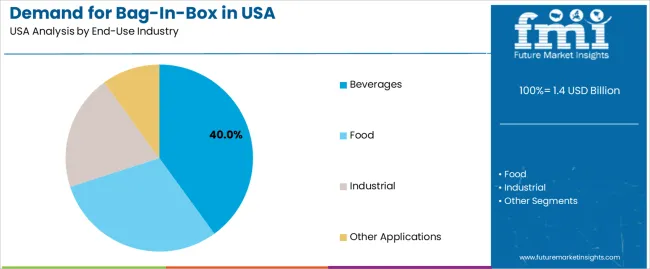
The beverages segment leads the demand for bag-in-box in the USA with a 40% share. Beverages such as wine, juice, post-mix syrups, and cold-brew coffee rely on bag-in-box packaging to maintain freshness and reduce oxygen exposure. This format helps extend shelf life after opening, which is important in both retail and foodservice environments. Bag-in-box packaging also allows for efficient dispensing, reduced product waste, and easier handling in comparison to rigid alternatives.
The segment’s position is also supported by the growing use of bag-in-box solutions in commercial beverage machines and in the expanding ready-to-drink market. Producers benefit from lower shipping weight and improved storage density, while consumers value packaging that is easier to store and transport. As beverage categories continue to diversify across the USA, the demand for bag-in-box formats is expected to remain strong, reinforcing beverages as the leading end-use industry.
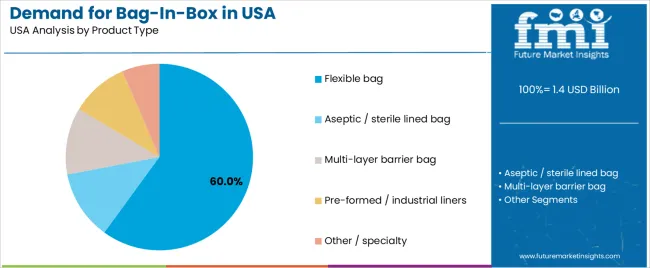
The flexible bag product type holds the largest share at 60%. Flexible bags are widely used because they are lightweight, adaptable, and compatible with a broad range of filling systems. They provide effective product protection through high-barrier films that help preserve quality while reducing the risk of contamination. Their structure allows the bag to collapse as product is dispensed, limiting oxygen ingress and supporting longer shelf life.
Flexible bags are also cost-efficient in both production and transportation, which makes them suitable for high-volume use across beverages, food ingredients, and industrial liquids. Their versatility allows producers to use them for diverse products, from sauces and dairy concentrates to chemicals and cleaners. As industries favor packaging that supports sustainability goals by reducing material use and lowering transport emissions, flexible bags remain the leading product type in the bag-in-box market in the USA.
Demand for bag in box packaging in the United States is shaped by growing use across beverages, liquid foods, household products and selected industrial applications. Producers value the lighter weight and space efficiency that reduce transport and storage costs. Foodservice channels use bag in box for consistent dispensing and reduced spoilage. Interest in sustainable packaging encourages adoption of formats that use less material than rigid containers. Constraints arise from legacy reliance on bottles or rigid formats, capital needs for conversion and mixed consumer perceptions. These dynamics collectively influence adoption speed and segment growth.
What Are The Primary Growth Drivers For Bag In Box Demand In The United States?
Growth is supported by increased use of bag in box in wine, juice, syrups, sauces and other liquid foods, where extended shelf life and controlled dispensing are priorities. Foodservice operators, retailers and beverage producers benefit from reduced waste, easier handling and lower freight cost. Sustainability targets among brands favour lighter packaging that lowers emissions per unit shipped. Advances in barrier films, taps and fitments improve product protection and user convenience, encouraging wider uptake. Expansion of prepared beverage programmes, delivery channels and institutional catering also boosts demand for reliable, cost efficient liquid packaging.
What Are The Key Restraints Affecting Bag In Box Adoption In The United States?
Several restraints influence adoption. Strong consumer preference for glass or rigid plastic in premium beverage categories limits substitution. Some converters face high capital expense to upgrade filling lines or integrate bag in box assembly. Variability in recycling infrastructure and concerns about multi layer film waste temper adoption in sustainability aware segments. Compatibility challenges may arise when switching from rigid to flexible formats, increasing operational risk. In certain categories, established supply chains and packaging norms create inertia that slows experimentation with alternative formats such as bag in box.
What Are The Key Trends Shaping The Bag In Box Market In The United States?
Important trends include improvements in high barrier films that extend product stability and support broader use in liquid foods and beverages. Taps and fitments designed for smoother dispensing reduce waste and enhance user experience. Growth in wine on tap, foodservice dispensing and ready to drink formats expands applications. Manufacturers explore recyclable film structures and lighter bag constructions to align with sustainability goals. Increased demand for efficient e commerce packaging supports interest in durable, space saving liquid containers. Together, these trends indicate a steady shift toward modern, efficient and lower impact packaging solutions.
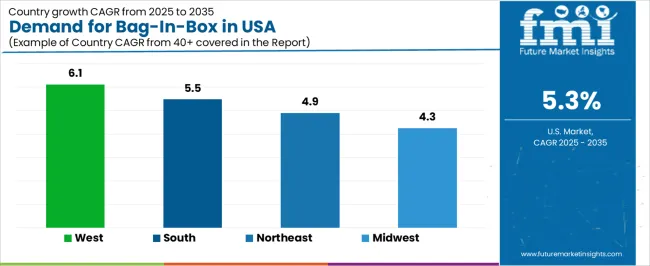
The demand for Bag In Box packaging in the USA is rising as industries increasingly adopt lightweight, cost effective, and sustainable packaging formats. Bag In Box solutions are used widely in food and beverage, household products, pharmaceuticals, and industrial liquids due to their ability to preserve product freshness, reduce contamination risks, and extend shelf life. Businesses across the USA are also prioritizing packaging formats that minimize transportation costs and reduce waste generation, which boosts the adoption of Bag In Box systems. Growth is strongest in regions with active food processing, beverage manufacturing, and e commerce distribution networks. The West and South regions lead due to significant beverage production, strong agricultural output, and consumer preference for convenient packaging formats. The Northeast and Midwest follow with steady demand supported by expanding retail distribution and increased use across commercial and institutional applications. This analysis explores the regional drivers shaping Bag In Box demand across the USA.
| Region | CAGR (2025-2035) |
|---|---|
| West | 6.1% |
| South | 5.5% |
| Northeast | 4.9% |
| Midwest | 4.3% |
The West region leads the USA Bag In Box market with a CAGR of 6.1%. The strong expansion of the beverage sector, especially wine, juice, and plant based drinks, is a major contributor to rising demand. The West is home to significant wine producing states, which increasingly rely on Bag In Box formats due to their cost efficiency, reduced carbon footprint, and ability to maintain product quality for longer periods. The region also has a well developed ecosystem for organic food and sustainable packaging, which aligns with the environmental advantages of Bag In Box systems. Rapid growth in e commerce and direct to consumer distribution channels further boosts demand for durable, space efficient packaging solutions. The rising population and strong presence of hospitality and food service industries also influence market expansion, as Bag In Box is widely used for sauces, oils, syrups, and bulk liquid products. Continued focus on sustainability, combined with innovation in lightweight packaging, will support strong future growth in the West.
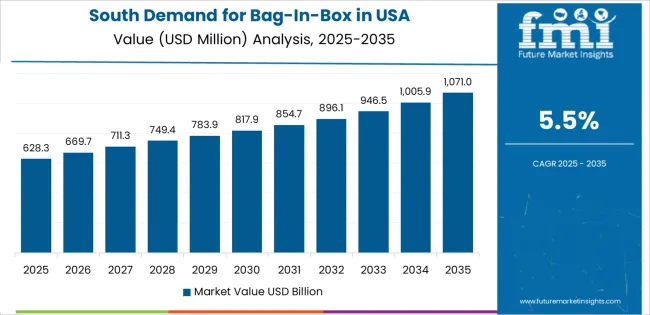
The South region shows strong growth with a CAGR of 5.5%. The expanding food processing and beverage manufacturing sectors across states in the South contribute heavily to market demand. Bag In Box packaging is increasingly preferred for tea concentrates, dairy alternatives, alcoholic beverages, and fountain drink systems. The region has a large commercial and industrial base, including restaurants, hotels, and catering businesses, all of which benefit from the ease of storage, transport, and dispensing provided by Bag In Box systems. Strong population growth and rising consumer spending also support demand for packaged beverages and convenience food products, contributing to higher usage of Bag In Box. The South is also seeing increased adoption within household cleaning and chemical products, where safety, spill reduction, and controlled dispensing are priorities. With continuous expansion in manufacturing, retail, and e commerce logistics, the Bag In Box market in the South is positioned for steady future growth.
The Northeast region demonstrates a steady CAGR of 4.9%. The region has a mature retail environment and strong demand for high quality food and beverage products, supporting the adoption of Bag In Box formats. The Northeast has a large population concentrated in urban centers, which drives consumption of packaged liquids such as juices, cooking ingredients, wine, and cleaning products. Commercial sectors including education, healthcare, and food service operations frequently use Bag In Box packaging due to its hygienic dispensing and reduced waste generation. The Northeast is also characterized by higher awareness of sustainability, which aligns with the environmental benefits of Bag In Box solutions. Growth in premium beverage markets and the rise of eco friendly brands choosing Bag In Box packaging contribute to continued expansion in the region.
The Midwest region shows a solid CAGR of 4.3%. The region is home to a large agricultural and food processing base, which drives steady use of Bag In Box systems for products such as sauces, syrups, oils, and dairy based liquids. Beverage manufacturers in the Midwest are adopting Bag In Box formats to support efficient distribution and longer shelf life. The region’s broad commercial and institutional sectors, including restaurants, cafeterias, and industrial kitchens, also rely on Bag In Box systems for cost effective bulk dispensing. The Midwest benefits from strong logistics infrastructure, which supports large scale distribution of Bag In Box packaged products across the country. As sustainability initiatives expand across manufacturing and retail environments, and as businesses increasingly adopt efficient packaging solutions, demand for Bag In Box in the Midwest is expected to continue growing at a steady pace.
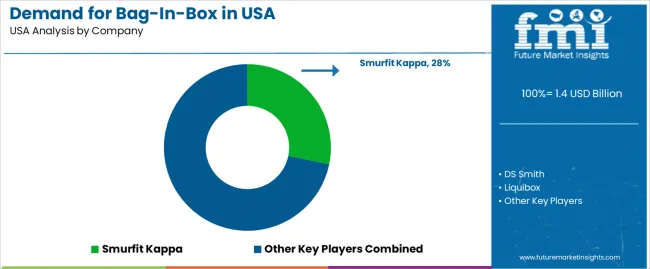
Demand for bag in box packaging in the United States continues to expand as brands in beverages, foodservice, household liquids, and industrial fluids shift toward lighter and more space efficient formats. The market is supported by steady adoption in segments such as wine, juice, coffee concentrate, dairy alternatives, liquid foods, and cleaning products. Growth is linked to ease of storage, reduced material weight, lower transport costs, and controlled dispensing. In the United States, companies such as Smurfit Kappa with an estimated 28.2 percent share, along with DS Smith, Liquibox and Scholle IPN, supply a large portion of BIB systems. These firms focus on barrier film performance, fitment reliability, and carton strength to serve both high volume producers and regional fillers. Demand also benefits from sustainability preferences, since bag in box units use less plastic than rigid containers in equivalent volumes.
Competition revolves around manufacturing scale, product design flexibility and supply chain coverage. One strategic approach centers on improved oxygen barrier materials to protect sensitive liquids such as wine or dairy substitutes. Another approach involves expanding fill line compatibility and offering tap or valve systems designed for foodservice equipment. Companies also invest in regional production to shorten lead times for beverage and food manufacturers. Brochures typically present capacity ranges from one to ten liters, film specifications, fitment options, carton strength ratings and compatibility with automated filling systems. As retail and horeca channels continue to adopt formats that support reduced waste and extended shelf life, suppliers aim to match rising demand with dependable packaging systems suited to high turnover distribution in the United States.
| Items | Details |
|---|---|
| Quantitative Units | USD billion |
| Regions Covered | North America |
| End-Use Industry | Beverages, Food, Industrial, Other Applications |
| Product Type | Flexible bag, Aseptic / sterile lined bag, Multi-layer barrier bag, Pre-formed / industrial liners, Other / specialty |
| Key Companies Profiled | Smurfit Kappa, DS Smith, Liquibox, Scholle IPN, Mondi |
| Additional Attributes | The market analysis includes dollar sales by product type and end-use industry categories. It also assesses demand trends across the United States for Bag-In-Box packaging. The competitive landscape covers major suppliers focusing on packaging innovation, sustainability, and adoption of high barrier materials. Growth in beverages, liquid food, and industrial fluids packaging is highlighted, along with increasing interest in recyclable and lightweight packaging formats. |
The global demand for bag-in-box in USA is estimated to be valued at USD 1.4 billion in 2025.
The market size for the demand for bag-in-box in USA is projected to reach USD 2.3 billion by 2035.
The demand for bag-in-box in USA is expected to grow at a 5.3% CAGR between 2025 and 2035.
The key product types in demand for bag-in-box in USA are beverages, food, industrial and other applications.
In terms of product type, flexible bag segment to command 60.0% share in the demand for bag-in-box in USA in 2025.


Our Research Products

The "Full Research Suite" delivers actionable market intel, deep dives on markets or technologies, so clients act faster, cut risk, and unlock growth.

The Leaderboard benchmarks and ranks top vendors, classifying them as Established Leaders, Leading Challengers, or Disruptors & Challengers.

Locates where complements amplify value and substitutes erode it, forecasting net impact by horizon

We deliver granular, decision-grade intel: market sizing, 5-year forecasts, pricing, adoption, usage, revenue, and operational KPIs—plus competitor tracking, regulation, and value chains—across 60 countries broadly.

Spot the shifts before they hit your P&L. We track inflection points, adoption curves, pricing moves, and ecosystem plays to show where demand is heading, why it is changing, and what to do next across high-growth markets and disruptive tech

Real-time reads of user behavior. We track shifting priorities, perceptions of today’s and next-gen services, and provider experience, then pace how fast tech moves from trial to adoption, blending buyer, consumer, and channel inputs with social signals (#WhySwitch, #UX).

Partner with our analyst team to build a custom report designed around your business priorities. From analysing market trends to assessing competitors or crafting bespoke datasets, we tailor insights to your needs.
Supplier Intelligence
Discovery & Profiling
Capacity & Footprint
Performance & Risk
Compliance & Governance
Commercial Readiness
Who Supplies Whom
Scorecards & Shortlists
Playbooks & Docs
Category Intelligence
Definition & Scope
Demand & Use Cases
Cost Drivers
Market Structure
Supply Chain Map
Trade & Policy
Operating Norms
Deliverables
Buyer Intelligence
Account Basics
Spend & Scope
Procurement Model
Vendor Requirements
Terms & Policies
Entry Strategy
Pain Points & Triggers
Outputs
Pricing Analysis
Benchmarks
Trends
Should-Cost
Indexation
Landed Cost
Commercial Terms
Deliverables
Brand Analysis
Positioning & Value Prop
Share & Presence
Customer Evidence
Go-to-Market
Digital & Reputation
Compliance & Trust
KPIs & Gaps
Outputs
Full Research Suite comprises of:
Market outlook & trends analysis
Interviews & case studies
Strategic recommendations
Vendor profiles & capabilities analysis
5-year forecasts
8 regions and 60+ country-level data splits
Market segment data splits
12 months of continuous data updates
DELIVERED AS:
PDF EXCEL ONLINE
Demand Signal Repository Solutions Market Size and Share Forecast Outlook 2025 to 2035
Demand Side Management Market Size and Share Forecast Outlook 2025 to 2035
Demand Response Market Analysis - Size, Share, and Forecast Outlook 2025 to 2035
North America Shipping Supplies Market Trends – Innovations & Growth 2024-2034
Demand of Kozani Saffron in Greece Analysis - Size, Share & Forecast 2025 to 2035
Demand of No-acid Whey Strained Dairy Processing Concepts in European Union Size and Share Forecast Outlook 2025 to 2035
Demand for Bronte Pistachio in Italy Analysis - Size, Share & Forecast 2025 to 2035
Demand and Trend Analysis of Gaming Monitor in Western Europe Size and Share Forecast Outlook 2025 to 2035
Demand and Trend Analysis of Gaming Monitor in Japan Size and Share Forecast Outlook 2025 to 2035
Demand and Trend Analysis of Gaming Monitor in Korea Size and Share Forecast Outlook 2025 to 2035
Glycine Soja (Soybean) Seed Extract Market Size and Share Forecast Outlook 2025 to 2035
Demand and Trend Analysis of Yeast in Japan - Size, Share, and Forecast Outlook 2025 to 2035
Demand and Trends Analysis of Stevia in Japan Size and Share Forecast Outlook 2025 to 2035
Demand of Pistachio-based desserts & ingredients in France Analysis - Size, Share & Forecast 2025 to 2035
Japan Women’s Intimate Care Market Trends – Growth & Forecast 2024-2034
Western Europe Men’s Skincare Market Analysis – Forecast 2023-2033
Demand and Trend Analysis of Fabric Stain Remover in Korea Size and Share Forecast Outlook 2025 to 2035
Demand and Sales Analysis of Paper Cup in Japan Size and Share Forecast Outlook 2025 to 2035
Demand and Sales Analysis of Paper Cup in Korea Size and Share Forecast Outlook 2025 to 2035
Demand and Sales Analysis of Paper Cup in Western Europe Size and Share Forecast Outlook 2025 to 2035

Thank you!
You will receive an email from our Business Development Manager. Please be sure to check your SPAM/JUNK folder too.
Chat With
MaRIA