The demand for biological indicator vials in the USA is projected to reach USD 91.4 million by 2035, reflecting an absolute increase of USD 31.8 million over the forecast period. Starting at USD 59.6 million in 2025, the demand is expected to grow at a steady CAGR of 4.4%. This growth is driven by the increasing need for sterilization validation in industries such as pharmaceuticals, biotechnology, healthcare, and medical device manufacturing, where product sterility is crucial for safety and regulatory compliance.
Biological indicator vials are used to verify the effectiveness of sterilization processes in high-risk environments like hospitals, laboratories, and pharmaceutical production facilities. These vials contain microbial spores that are resistant to sterilization, allowing them to act as indicators for assessing whether sterilization agents have effectively eliminated harmful microorganisms. As regulations around sterilization become more stringent and industries adopt more advanced sterilization technologies, the demand for biological indicator vials is expected to increase significantly. With a focus on improving safety, compliance, and quality control, these vials play a critical role in ensuring that sterilization processes meet industry standards, further fueling their growing adoption across various sectors.
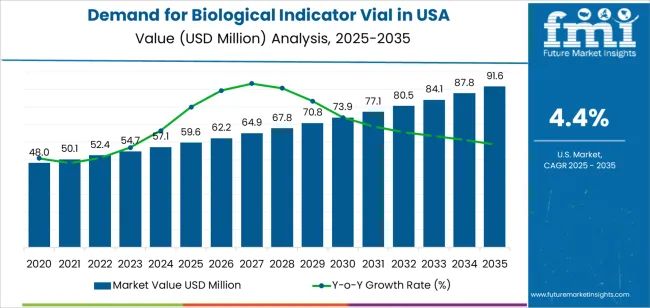
The 5-year growth block analysis for biological indicator vials in the USA shows steady growth from 2025 to 2030, with demand rising from USD 59.6 million to USD 62.2 million, adding USD 2.6 million. This growth is driven by increased adoption in industries like pharmaceuticals, healthcare, and medical device manufacturing, which have stringent sterilization requirements. Continued investments in sterilization technologies will drive the need for reliable sterilization monitoring solutions, supporting steady demand throughout this period.
From 2030 to 2035, the demand will accelerate significantly, growing from USD 62.2 million to USD 91.4 million, adding USD 29.2 million. This represents a CAGR of approximately 10.5%. The acceleration in demand is fueled by growing compliance with sterilization regulations and an increasing number of sterilization procedures in industries dealing with high-risk materials, such as hospitals, laboratories, and pharmaceutical manufacturers. As industries adopt more advanced sterilization technologies and face increasing regulatory pressure, the need for biological indicator vials will sharply rise. This period will see a notable uptick in demand as sterilization validation becomes more critical for ensuring safety and meeting industry standards.
| Metric | Value |
|---|---|
| USA Biological Indicator Vial Sales Value (2025) | USD 59.6 million |
| USA Biological Indicator Vial Forecast Value (2035) | USD 91.4 million |
| USA Biological Indicator Vial Forecast CAGR (2025-2035) | 4.40% |
The demand for biological indicator vials in the USA is growing as healthcare and sterilization industries place stronger emphasis on validating sterilization processes. Biological indicator vials are used to verify the effectiveness of sterilization cycles for items such as surgical instruments, medical devices, and laboratory equipment. Regulatory requirements and accreditation standards for sterilization monitoring are becoming stricter, driving the need for reliable indicators.
Hospitals, pharmaceutical manufacturing facilities, and laboratories are key contributors to this growth. With rising surgical procedure volumes, increased production of sterile medical devices, and expanded biopharmaceutical manufacturing, the requirement to ensure sterility and safety is growing. Biological indicator vials help facilities demonstrate compliance and protect patient safety.
Technological improvements in indicator vials, such as faster read‑out times and higher sensitivity to sterilization parameters, are further encouraging adoption. As facilities aim to optimize workflows and reduce downtime, these indicators provide confidence in sterilization results. With regulatory scrutiny intensifying and the scale of sterile processing expanding, demand for biological indicator vials in the USA is expected to grow steadily over the next decade.
Demand is segmented by sterilization type, incubation time, and end use. By sterilization type, demand is divided into steam sterilization and ethylene oxide sterilization, with steam sterilization holding the largest share. In terms of incubation time, the industry is categorized into 24 to 32 hours, up to 24 hours, 32 to 48 hours, and above 48 hours, with 24 to 32 hours being the most common. The industry is also segmented by end use, including pharmaceutical, food & beverages, and cosmetics, with pharmaceutical holding the largest share. Regionally, demand is divided into West, South, Northeast, and Midwest.
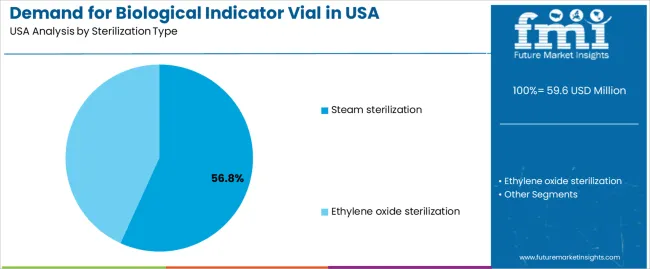
Steam sterilization accounts for 57% of the demand for biological indicator vials in the USA. Steam sterilization is widely used in industries like pharmaceuticals and healthcare due to its efficiency, safety, and ability to provide consistent sterilization results. This method utilizes high-pressure steam to destroy microbial life, making it highly effective for sterilizing equipment, materials, and products. As a result, steam sterilization is the preferred choice in environments that require rigorous decontamination standards, such as pharmaceutical manufacturing facilities.
The widespread use of steam sterilization in industries where sterility is paramount—such as the pharmaceutical and medical sectors drives the demand for biological indicator vials. These vials are crucial for verifying the effectiveness of the sterilization process, ensuring that products are free from microbial contamination. As the need for sterile environments grows in sectors like pharmaceuticals and healthcare, steam sterilization remains a dominant method, continuing to lead demand for biological indicator vials in the USA.
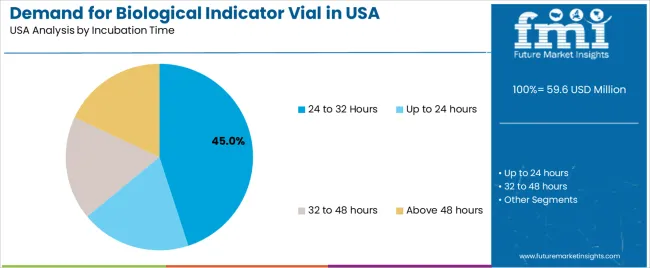
The 24 to 32 hours incubation time category accounts for 45% of the demand for biological indicator vials in the USA. This incubation period strikes a balance between providing enough time for microbial growth and maintaining a fast turnaround for sterilization results. During this incubation period, biological indicators allow manufacturers to ensure that their sterilization processes are thorough and effective.
This time frame is optimal for detecting any microbial life that may survive the sterilization process, making it ideal for use in pharmaceutical and healthcare industries where precision and validation of sterilization are crucial. The relatively short incubation time allows for faster results, which is important in industries that require quick and efficient sterilization cycles. As regulatory standards continue to evolve and industries focus on improving process efficiency, the 24 to 32 hours incubation period is expected to remain a preferred choice for biological indicator vials in the USA.
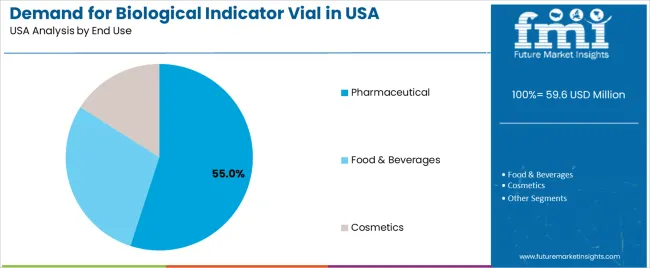
The pharmaceutical industry accounts for 55% of the demand for biological indicator vials in the USA. In pharmaceutical manufacturing, sterility is essential to ensure the safety and efficacy of products, especially those intended for medical use, such as vaccines, injectable drugs, and surgical instruments. Biological indicator vials are used to monitor and validate the effectiveness of sterilization processes, ensuring that no microbial contamination is present in the final product.
The pharmaceutical industry's rigorous quality control standards, combined with the critical nature of sterile products, drive the need for biological indicator vials. With increasing regulations around the production of sterile drugs and the expansion of the pharmaceutical sector to meet growing healthcare demands, the demand for biological indicator vials in the pharmaceutical industry continues to rise. The growing focus on compliance, product safety, and quality assurance in pharmaceutical manufacturing ensures that the industry remains the largest end user of biological indicator vials in the USA.
Biological indicator enable verification of sterilisation cycles (steam, EtO, H₂O₂) and support regulatory compliance, making them essential in quality‑assurance workflows. Key drivers include increasing sterilisation requirements, growth of sterile manufacturing operations (e.g., biologics, cell & gene therapy), and higher infection‑control standards in hospitals and clinics. Restraints stem from high costs of advanced rapid‑read indicators, complexity of validation protocols, and supply‑chain/logistics challenges for specialised consumables.
Why s Demand for Biological Indicator Vials Growing in USA?
Demand is growing in the USA because a combination of regulatory scrutiny, growth in sterile manufacturing and the requirement for validated sterilisation workflows is driving uptake. With more hospitals focused on reducing healthcare‑associated infections, and pharmaceutical/medical‑device firms needing to prove sterilisation efficacy for products and packaging, biological indicator vials become mission‑critical consumables. Also, emerging manufacturing segments such as cell/gene therapies and single‑use systems require rigorous sterilisation assurance, further boosting demand. As clean‑room and aseptic processes expand, the frequency and variety of sterilisation validation tasks increase, supporting consistent vial usage.
How are Technological Innovations Driving Growth of Biological Indicator Vials in USA?
Technological innovations are supporting growth by improving performance, reducing incubation time and enhancing ease‑of‑use for biological indicator vials. Rapid‑readout vials (e.g., visual colour change or instrument detection) shorten validation cycles, making workflows more efficient. Improved spore systems and more robust vial formats enhance reliability across sterilisation types (steam, EtO, H₂O₂). Connectivity and data‑management features (bar‑codes, traceability, integration with laboratory information systems) are increasingly standard, aligning with digital quality‑management demands. These innovations reduce manual workload, accelerate turnaround and support more frequent verification—factors that broaden usage and strengthen demand in USA sterile‑manufacturing and healthcare environments.
What are the Key Challenges Limiting Adoption of Biological Indicator Vials in USA?
Despite strong demand drivers, adoption faces several challenges. One significant obstacle is cost pressure premium rapid‑read or automated vials cost more than conventional indicators, which may limit use especially in smaller or budget‑constrained facilities. Validation complexity is another challenge: sterilisation protocols often require specialised training, documentation and integration with quality systems, which can slow implementation. Supply‑chain reliability and availability of specific vial formats (for new sterilisation gases or temperature ranges) can also hurdle users. While large enterprises adopt faster technologies, smaller operations may stick with older methods due to inertia, limiting penetration of advanced vial types across all segments.
| Region | CAGR (%) |
|---|---|
| West | 5.0% |
| South | 4.5% |
| Northeast | 4.0% |
| Midwest | 3.5% |
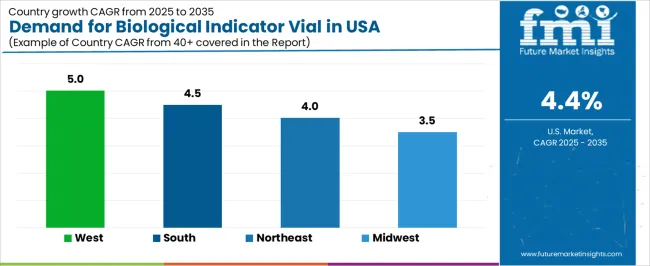
The demand for biological indicator vials in the USA is growing across all regions, with the West leading at a 5.0% CAGR. This growth is driven by the expanding pharmaceutical, biotechnology, and healthcare sectors, all of which rely on biological indicators for sterilization validation. The South follows at 4.5%, supported by ongoing industrial expansion and increasing adoption of sterilization technologies in medical device manufacturing. The Northeast shows a 4.0% CAGR, influenced by its strong presence of research institutions and healthcare facilities. The Midwest experiences slower growth at 3.5%, with steady adoption driven by the expansion of healthcare and manufacturing industries.
The West is experiencing the highest demand for biological indicator vials, with a 5.0% CAGR. This growth is driven by the region’s dominance in industries like biotechnology, pharmaceuticals, and medical device manufacturing, all of which require sterilization processes for ensuring product safety and compliance. States like California and Washington are home to many of the country’s largest pharmaceutical and biotech companies, which are at the forefront of adopting advanced sterilization technologies.
The increasing emphasis on sterilization validation in the production of medical devices, pharmaceuticals, and healthcare products contributes to the strong demand for biological indicator vials in the West. The region’s robust research and development ecosystem is fostering continuous innovation in sterilization techniques, further boosting the need for biological indicators. As regulatory standards for sterilization become more stringent, the West’s demand for biological indicator vials is expected to continue to grow.
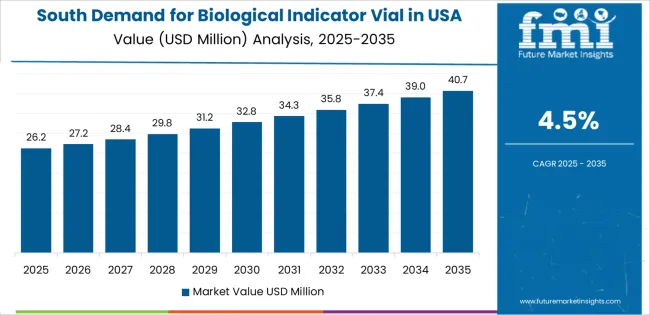
The South is seeing steady growth in demand for biological indicator vials, with a 4.5% CAGR. This growth is primarily driven by the region’s expanding pharmaceutical, biotechnology, and medical device manufacturing sectors, especially in states like Texas, Florida, and Georgia. As these industries grow, the demand for sterilization technologies, including biological indicator vials for sterilization validation, is increasing.
The South’s burgeoning healthcare infrastructure, along with the rise of manufacturing hubs in the medical device and life sciences sectors, is also contributing to this demand. With a focus on maintaining the highest standards of product safety and regulatory compliance, the use of biological indicator vials is becoming more common across manufacturing facilities in the South. As these sectors continue to expand and innovate, the demand for biological indicator vials will remain strong.
The Northeast is witnessing steady demand growth for biological indicator vials, with a 4.0% CAGR. The region is home to numerous pharmaceutical companies, medical research institutions, and healthcare facilities, all of which require sterilization solutions for their products and services. The high concentration of academic and healthcare institutions in cities like New York, Boston, and Philadelphia contributes to the region’s demand for biological indicator vials.
As the need for sterilization validation in pharmaceutical manufacturing, medical device production, and healthcare settings grows, the demand for biological indicators is rising. The Northeast’s emphasis on advanced medical research and product safety standards further accelerates the adoption of biological indicator vials. With the continuous growth of healthcare and pharmaceutical sectors, the demand for biological indicator vials in the Northeast is expected to remain stable and grow steadily.
The Midwest is experiencing moderate growth in demand for biological indicator vials, with a 3.5% CAGR. The region’s growth is driven by the increasing adoption of sterilization technologies in healthcare facilities, medical device manufacturing, and pharmaceutical production. States like Illinois, Michigan, and Ohio have large manufacturing sectors, and as these industries continue to adopt higher standards for product safety and sterilization, the demand for biological indicator vials is increasing.
While the growth rate in the Midwest is slower than in the West or South, the steady adoption of biological indicator vials is supported by the region’s focus on healthcare infrastructure and industrial development. As more facilities in the Midwest prioritize compliance with sterilization regulations, the demand for biological indicator vials will continue to grow, albeit at a slower rate compared to more industrialized regions.
The demand for biological indicator vials in the United States is rising steadily, underpinned by increased emphasis on sterilization validation and contamination control across healthcare, pharmaceutical manufacturing, and food processing sectors. As regulatory requirements become more stringent and the risks of healthcare‑associated infections (HAIs) and equipment contamination gain higher visibility, facilities are investing in reliable indicator systems to verify sterilizer efficacy and ensure product safety.
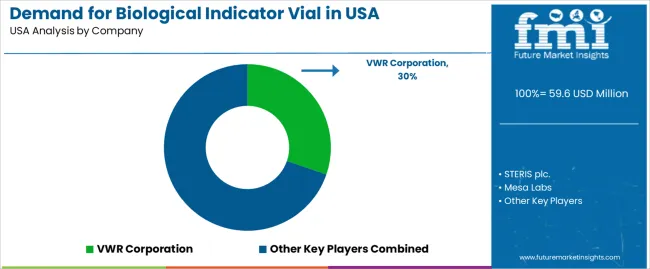
In the USA demand landscape, VWR Corporation holds an approximate share of 30.3%, highlighting its strong position as a major supplier of biological indicator vials and related consumables and services. Other important contributors include STERIS plc., Mesa Labs, 3M Company, and Siltex Australia, which supply key indicator formats, spore‑based vials, and verification systems critical to sterilization workflows in medical device manufacturing and healthcare spaces.
Key drivers of demand include the expansion of medical device production in the USA, increasing surgical and outpatient procedure volumes, elevated expectations for quality control in sterilization workflows, and a growing reliance on validated indicators to meet regulatory audits. Additional factors such as rising interest in rapid‑readout indicators and automation of monitoring systems further support demand growth. Challenges such as supply‑chain constraints, the cost of sophisticated indicator technologies, and the need for ongoing validation training may moderate adoption rates. Overall, the demand outlook for biological indicator vials in the USA remains favorable, as quality assurance and sterilization validation continue to be mission‑critical for healthcare and regulated manufacturing.
| Items | Values |
|---|---|
| Quantitative Unit | USD million |
| Sterilization Type | Steam Sterilization, Ethylene Oxide Sterilization |
| Incubation Time | 24 to 32 Hours, Up to 24 hours, 32 to 48 hours, Above 48 hours |
| End Use | Pharmaceutical, Food & Beverages, Cosmetics |
| Regions Covered | West, South, Northeast, Midwest |
| Key Players Profiled | VWR Corporation, STERIS plc., Mesa Labs, 3M Company, Siltex Australia (c) |
| Additional Attributes | Dollar sales by sterilization type, incubation time, end use, and regional trends |
The global demand for biological indicator vial in USA is estimated to be valued at USD 59.6 million in 2025.
The market size for the demand for biological indicator vial in USA is projected to reach USD 91.6 million by 2035.
The demand for biological indicator vial in USA is expected to grow at a 4.4% CAGR between 2025 and 2035.
The key product types in demand for biological indicator vial in USA are steam sterilization and ethylene oxide sterilization.
In terms of incubation time, 24 to 32 hours segment to command 45.0% share in the demand for biological indicator vial in USA in 2025.


Our Research Products

The "Full Research Suite" delivers actionable market intel, deep dives on markets or technologies, so clients act faster, cut risk, and unlock growth.

The Leaderboard benchmarks and ranks top vendors, classifying them as Established Leaders, Leading Challengers, or Disruptors & Challengers.

Locates where complements amplify value and substitutes erode it, forecasting net impact by horizon

We deliver granular, decision-grade intel: market sizing, 5-year forecasts, pricing, adoption, usage, revenue, and operational KPIs—plus competitor tracking, regulation, and value chains—across 60 countries broadly.

Spot the shifts before they hit your P&L. We track inflection points, adoption curves, pricing moves, and ecosystem plays to show where demand is heading, why it is changing, and what to do next across high-growth markets and disruptive tech

Real-time reads of user behavior. We track shifting priorities, perceptions of today’s and next-gen services, and provider experience, then pace how fast tech moves from trial to adoption, blending buyer, consumer, and channel inputs with social signals (#WhySwitch, #UX).

Partner with our analyst team to build a custom report designed around your business priorities. From analysing market trends to assessing competitors or crafting bespoke datasets, we tailor insights to your needs.
Supplier Intelligence
Discovery & Profiling
Capacity & Footprint
Performance & Risk
Compliance & Governance
Commercial Readiness
Who Supplies Whom
Scorecards & Shortlists
Playbooks & Docs
Category Intelligence
Definition & Scope
Demand & Use Cases
Cost Drivers
Market Structure
Supply Chain Map
Trade & Policy
Operating Norms
Deliverables
Buyer Intelligence
Account Basics
Spend & Scope
Procurement Model
Vendor Requirements
Terms & Policies
Entry Strategy
Pain Points & Triggers
Outputs
Pricing Analysis
Benchmarks
Trends
Should-Cost
Indexation
Landed Cost
Commercial Terms
Deliverables
Brand Analysis
Positioning & Value Prop
Share & Presence
Customer Evidence
Go-to-Market
Digital & Reputation
Compliance & Trust
KPIs & Gaps
Outputs
Full Research Suite comprises of:
Market outlook & trends analysis
Interviews & case studies
Strategic recommendations
Vendor profiles & capabilities analysis
5-year forecasts
8 regions and 60+ country-level data splits
Market segment data splits
12 months of continuous data updates
DELIVERED AS:
PDF EXCEL ONLINE
Demand Signal Repository Solutions Market Size and Share Forecast Outlook 2025 to 2035
Demand Side Management Market Size and Share Forecast Outlook 2025 to 2035
Demand Response Market Analysis - Size, Share, and Forecast Outlook 2025 to 2035
North America Shipping Supplies Market Trends – Innovations & Growth 2024-2034
Demand of Kozani Saffron in Greece Analysis - Size, Share & Forecast 2025 to 2035
Demand of No-acid Whey Strained Dairy Processing Concepts in European Union Size and Share Forecast Outlook 2025 to 2035
Demand for Bronte Pistachio in Italy Analysis - Size, Share & Forecast 2025 to 2035
Demand and Trend Analysis of Gaming Monitor in Western Europe Size and Share Forecast Outlook 2025 to 2035
Demand and Trend Analysis of Gaming Monitor in Japan Size and Share Forecast Outlook 2025 to 2035
Demand and Trend Analysis of Gaming Monitor in Korea Size and Share Forecast Outlook 2025 to 2035
Glycine Soja (Soybean) Seed Extract Market Size and Share Forecast Outlook 2025 to 2035
Demand and Trend Analysis of Yeast in Japan - Size, Share, and Forecast Outlook 2025 to 2035
Demand and Trends Analysis of Stevia in Japan Size and Share Forecast Outlook 2025 to 2035
Demand of Pistachio-based desserts & ingredients in France Analysis - Size, Share & Forecast 2025 to 2035
Japan Women’s Intimate Care Market Trends – Growth & Forecast 2024-2034
Western Europe Men’s Skincare Market Analysis – Forecast 2023-2033
Demand and Trend Analysis of Fabric Stain Remover in Korea Size and Share Forecast Outlook 2025 to 2035
Demand and Sales Analysis of Paper Cup in Japan Size and Share Forecast Outlook 2025 to 2035
Demand and Sales Analysis of Paper Cup in Korea Size and Share Forecast Outlook 2025 to 2035
Demand and Sales Analysis of Paper Cup in Western Europe Size and Share Forecast Outlook 2025 to 2035

Thank you!
You will receive an email from our Business Development Manager. Please be sure to check your SPAM/JUNK folder too.
Chat With
MaRIA