The USA jellies and gummies demand is valued at USD 2.8 billion in 2025 and is expected to reach USD 4.6 billion by 2035, rising at a CAGR of 5.1%. Demand is supported by steady growth in confectionery consumption, expanding product variety, and increased use of gummies in functional and fortified formats. Consumer interest in portable, portion-controlled sweets continues to contribute to stable category performance across retail and e-commerce channels.
Fruit-based formulations represent the leading ingredient type due to their broad appeal, clean flavor profile, and suitability for natural color and flavor integration. These products are widely used across premium and mainstream confectionery lines and support label-friendly positioning through incorporation of fruit concentrates and natural sweeteners. Ongoing development of functional gummies, including vitamin, botanical, and fiber-enriched variants, is further shaping product innovation.
Strongest demand is concentrated in the West, South, and Northeast regions, where higher confectionery consumption and diverse retail distribution support sustained category expansion. Regional growth is reinforced by product innovation, seasonal launches, and broader placement across supermarkets, convenience stores, and online platforms. Major companies include HARIBO GmbH & Co. KG, Jelly Belly Candy Company, Mars Inc., Mondelēz Global LLC, and Perfetti Van Melle Group B.V., focusing on flavor diversification, texture consistency, and portfolio expansion.
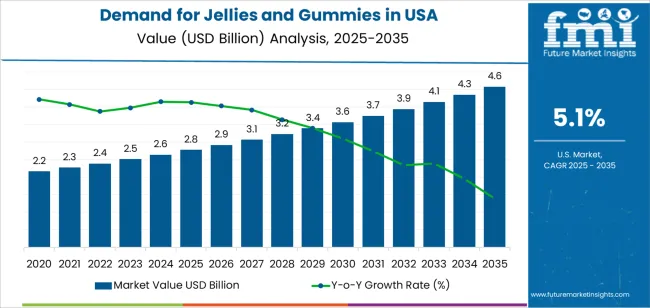
Peak-to-trough analysis shows a moderate cyclical pattern shaped by consumer trends, ingredient costs, and retail-channel dynamics. Between 2025 and 2028, the segment is expected to reach an early growth peak as demand rises for flavor-diverse, texture-focused confectionery and as brands expand sugar-reduced and functional gummy lines. Strong distribution through mass retail, convenience outlets, and online platforms will reinforce this period.
A mild trough is likely between 2029 and 2031 due to pricing pressures from gelatin, pectin, and sweetener inputs and slower category rotation during discretionary-spending adjustments. The moderation will remain limited as stable demand for portion-controlled confectionery and novelty formats supports baseline sales. After 2031, the segment is expected to regain upward momentum as product reformulation, clean-label development, and expanded premium lines strengthen category renewal. The peak-to-trough pattern reflects a resilient consumer category influenced by changing dietary preferences, steady innovation, and consistent retail availability across national sales channels.
| Metric | Value |
|---|---|
| USA Jellies and Gummies Sales Value (2025) | USD 2.8 billion |
| USA Jellies and Gummies Forecast Value (2035) | USD 4.6 billion |
| USA Jellies and Gummies Forecast CAGR (2025-2035) | 5.1% |
Demand for jellies and gummies in the USA is increasing as consumers seek convenient snack options and functional confectionery that combine taste with added benefits. The US industry is characterised by high consumption of confectionery products and a shift toward fortified or wellness-oriented gummies that support immunity, sleep or beauty-from-within. Brands are responding with product innovations such as sugar-reduced formulations, plant-based ingredients and novel flavours, which appeal to health-conscious and younger demographics.
Online retail growth and direct-to-consumer channels simplify distribution and allow niche brands to reach broader audiences. Seasonal gifting occasions, gaming culture and social media trends also stimulate impulsive purchases of gummies and jellies as treats or collectibles. Demand faces constraints including growing scrutiny of sugar content and ingredient transparency, regulatory challenges related to novel functional claims and competition from other snack formats. Price sensitivity and consumer fatigue from flavour proliferation may also moderate future growth.
Demand for jellies and gummies in the United States is shaped by ingredient preferences, formulation complexity, and demographic consumption patterns. Producers balance flavour familiarity, clean-label requirements, and functional attributes to address shifting buyer habits across retail channels. Industry shares across ingredient type, product type, and end-user groups reflect formulation trends and the growing influence of functional confectionery in mainstream consumption.
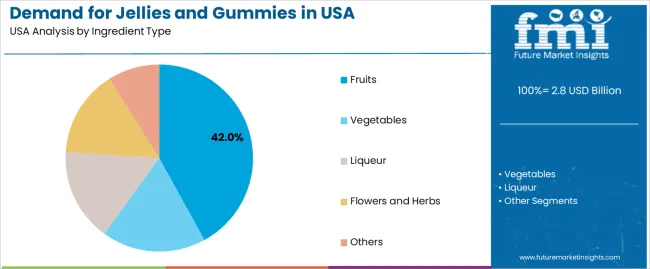
Fruit-based jellies and gummies hold an estimated 42.0% share of USA demand, making them the dominant ingredient category. Their leadership stems from broad flavour acceptance, stable formulation behaviour, and compatibility with natural sweeteners and colourants. Fruit ingredients support consistent texture and predictable processing, which benefits large-scale and craft confectionery manufacturers. Vegetable-based formulations account for 18.0% of demand and appeal to buyers seeking natural pigments and plant-focused innovation. Liqueur-infused variants represent 14.0%, mainly serving adult-oriented offerings and specialty retail. Flower- and herb-derived products hold 12.0%, aligned with rising interest in botanical profiles. The remaining 14.0% includes blended and experimental formulations used for limited-edition releases.
Key drivers and attributes:
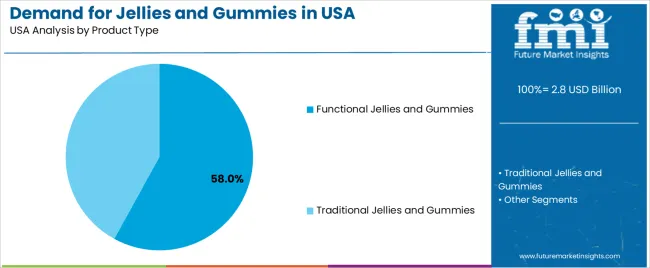
Functional jellies and gummies account for an estimated 58.0% share of USA demand, making them the leading product category. Their rise reflects growing consumer interest in convenient delivery systems for vitamins, minerals, botanical extracts, and wellness ingredients. Functional gummies offer flexible flavouring, controlled dosing, and broad accessibility through grocery, pharmacy, and online channels. Their adoption is strongest among young adults and older consumers who prefer flavour-forward, easy-to-consume nutritional products. Traditional jellies and gummies account for 42.0% of demand, maintaining relevance through family-oriented confectionery, gift assortments, and seasonal products. Their slower growth reflects competition from wellness-positioned offerings that combine confectionery appeal with functional benefits.
Key drivers and attributes:
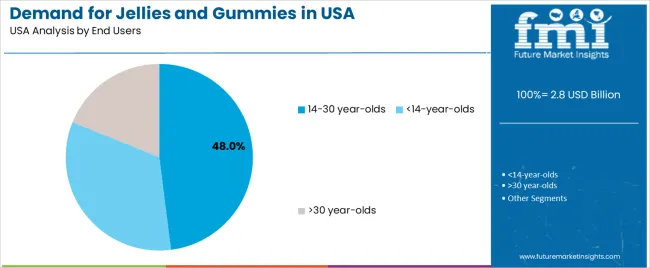
Consumers aged 14-30 years represent the largest end-user segment, holding an estimated 48.0% share of USA demand. This group shows strong interest in flavoured confectionery, novelty formulations, and functional gummies aligned with on-the-go consumption habits. Their purchasing behaviour is shaped by preferences for flavour diversity, convenience, and brand experimentation across retail and online platforms. The <14-year group accounts for 32.0%, driven by consistent demand for fruit-flavoured jellies, fun shapes, and character-branded assortments. The >30-year group holds 20.0%, reflecting growing but measured adoption of functional gummies for sleep support, energy, and general wellness. Traditional confectionery consumption is comparatively lower in this group.
Key drivers and attributes:
Demand for jellies and gummies in the United States is bolstered by consumers seeking quick, easy-to-consume snack options and confectionery products with familiar textures and flavors. Gummies and jellies appeal to children, teens and adults alike and are widely available in retail channels including convenience stores, drugstores and supermarkets. The rise of functional gummy formats, such as vitamin-enriched, probiotic, collagen or beauty-oriented gummies, adds a wellness dimension that extends USAge beyond traditional candy occasions. USA manufacturers and brands are launching innovative flavor profiles, packaging formats and direct-to-consumer subscription offerings, which further support demand across age and income segments.
While the category grows, consumers are increasingly concerned about sugar content, artificial flavors and calorie intake in snack foods. These health considerations limit demand among more health-conscious segments or drive preference for lower-sugar and “clean-label” formats, which may carry higher price points. Gummies compete with other snack formats such as protein bars, nut snacks and fresh fruit, which may erode incremental consumption. Inflation and input cost increases in sugar, gelatin or packaging raise cost pressures that may reduce margins or raise consumer prices, which can dampen demand growth.
The USA demand for jellies and gummies is evolving with launches of sugar-reduced, pectin-based or vegan gummy variants to address health and ethical concerns. E-commerce and subscription-box channels are growing in importance for gummies, enabling brands to offer direct-to-consumer formats, personalized flavor packs and limited-edition collaborations. Adult-oriented gummies, targeting hair, skin, nails, sleep or immunity are gaining traction as consumers view gummy forms not just as candy but as functional snack alternatives. Seasonal and flavor innovation (such as sour, spicy or layered textures) continue to stimulate trial and repeat purchase, supporting steady demand in the USA industry.
Demand for jellies and gummies in the United States is rising through 2035, driven by expanding product varieties, increased retail penetration, and steady growth across mainstream confectionery channels. Consumer preference for portion-controlled formats, fruit-flavored formulations, and gelatin-based or pectin-based alternatives supports category momentum. Regional patterns follow demographic concentration, retail-network strength, and innovation pipelines from confectionery producers. The West leads with a 5.9% CAGR, followed by the South at 5.3%, the Northeast at 4.7%, and the Midwest at 4.1%. Growth is shaped by supermarket placement, e-commerce availability, and ongoing diversification of gummy textures, colors, and flavor profiles.
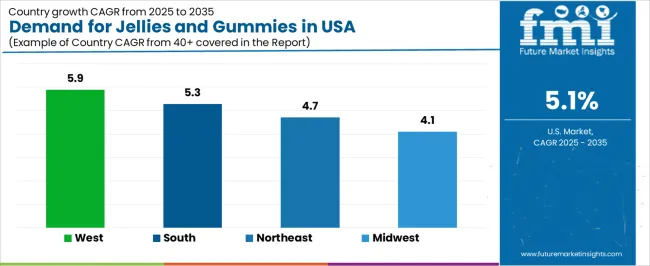
| Region | CAGR (2025-2035) |
|---|---|
| West | 5.9% |
| South | 5.3% |
| Northeast | 4.7% |
| Midwest | 4.1% |
The West grows at 5.9% CAGR, supported by strong retail expansion, a high concentration of confectionery brands, and increasing consumer interest in fruit-flavored and novelty-format gummies. States such as California, Washington, and Colorado exhibit robust demand through supermarkets, warehouse stores, and specialty retailers. Younger consumers and families favor soft-chew formats in varied flavor assortments, reinforcing steady repeat purchases. Producers introduce pectin-based and reduced-sugar options aligned with evolving preferences. Broad e-commerce penetration enhances distribution of premium and seasonal gummy assortments, contributing to sustained category growth across Western industry.

The South grows at 5.3% CAGR, driven by population growth, strong supermarket and convenience-store networks, and rising demand for assorted gummies in both value and premium categories. States including Texas, Florida, Georgia, and North Carolina contribute to higher volumes due to widespread availability and strong family consumption. Confectionery producers supply multi-pack formats suited for frequent household purchases, while retailers expand seasonal assortments tied to holidays and regional festivals. Increased promotional activity and broader placement in discount and club stores also support growth.
The Northeast grows at 4.7% CAGR, supported by established retail channels, strong specialty-candy demand, and higher adoption of premium-format gummies. States such as New York, Pennsylvania, and Massachusetts maintain consistent movement across supermarkets, specialty confectionery shops, and urban retail outlets. Consumers show sustained interest in soft-chew products with varied textures, colors, and fruit blends. Holiday and event-driven sales cycles reinforce repeat purchases, and retailers expand shelf space for pectin-based gummies to address shifting preferences. Distribution strength and dense population centers contribute to steady category activity.
The Midwest grows at 4.1% CAGR, supported by established confectionery consumption patterns, strong supermarket distribution, and steady demand for classic gummy varieties. States including Illinois, Michigan, Ohio, and Wisconsin maintain consistent sales through mainstream retail formats, with purchasing driven by family consumption and price-sensitive shoppers. Loyalty to traditional gummy textures and flavors supports baseline demand, while retailers gradually expand offerings of reduced-sugar and fruit-flavor assortments. Growth is moderate due to stable but mature consumption habits across the region.

The jellies and gummies industry in the United States is moderately concentrated, with established confectionery manufacturers supplying products across mass retail, convenience channels, and specialty stores. HARIBO GmbH & Co. KG leads the industry with an estimated 21.2% share, supported by long-standing brand recognition, consistent product texture, and wide distribution across national retail chains. Its position is reinforced by controlled ingredient standards and stable demand for gelatin-based gummies in core fruit and mixed-flavor segments.
Jelly Belly Candy Company, Mars Inc., and Mondelēz Global LLC follow as major competitors, offering diversified gummy assortments aligned with broader confectionery portfolios. Their competitive strengths include flavor diversity, established merchandising programs, and integration with seasonal and limited-edition product lines. These companies benefit from multi-category brand visibility, enabling jellies and gummies to complement chocolate and sugar-based confectionery offerings. Perfetti Van Melle Group B.V. maintains a notable position through regionally popular gummy brands designed for mainstream consumption, supported by balanced pricing and reliable supply arrangements. Its products target consistent demand across convenience and discount channels.
Competition in this industry centers on texture consistency, flavor accuracy, ingredient transparency, and distribution coverage. Growth is influenced by steady demand for fruit-flavored gummies, increasing acceptance of reduced-sugar and vegetarian formulations, and ongoing expansion of specialty gummies positioned for functional or premium use. Demand remains supported by household consumption, on-the-go snacking patterns, and continued innovation in shapes, packaging formats, and flavor combinations.
| Items | Values |
|---|---|
| Quantitative Units | USD billion |
| Ingredient Type | Fruits, Vegetables, Liqueur, Flowers and Herbs, Others |
| Product Type | Functional Jellies and Gummies, Traditional Jellies and Gummies |
| End Users | <14-year-olds, 14-30 year-olds, >30 year-olds |
| Regions Covered | West, Midwest, South, Northeast |
| Key Companies Profiled | HARIBO GmbH & Co. KG, Jelly Belly Candy Company, Mars Inc., Mondelēz Global LLC, Perfetti Van Melle Group B.V. |
| Additional Attributes | Dollar sales by ingredient type, product type, and end-user categories; regional adoption trends across West, Midwest, South, and Northeast; competitive landscape of confectionery and gummy manufacturers; developments in functional and clean-label gummies; integration with retail distribution, food innovation, and health-oriented product lines. |
The global demand for jellies and gummies in USA is estimated to be valued at USD 2.8 billion in 2025.
The market size for the demand for jellies and gummies in USA is projected to reach USD 4.6 billion by 2035.
The demand for jellies and gummies in USA is expected to grow at a 5.1% CAGR between 2025 and 2035.
The key product types in demand for jellies and gummies in USA are fruits, vegetables, liqueur, flowers and herbs and others.
In terms of product type, functional jellies and gummies segment to command 58.0% share in the demand for jellies and gummies in USA in 2025.


Our Research Products

The "Full Research Suite" delivers actionable market intel, deep dives on markets or technologies, so clients act faster, cut risk, and unlock growth.

The Leaderboard benchmarks and ranks top vendors, classifying them as Established Leaders, Leading Challengers, or Disruptors & Challengers.

Locates where complements amplify value and substitutes erode it, forecasting net impact by horizon

We deliver granular, decision-grade intel: market sizing, 5-year forecasts, pricing, adoption, usage, revenue, and operational KPIs—plus competitor tracking, regulation, and value chains—across 60 countries broadly.

Spot the shifts before they hit your P&L. We track inflection points, adoption curves, pricing moves, and ecosystem plays to show where demand is heading, why it is changing, and what to do next across high-growth markets and disruptive tech

Real-time reads of user behavior. We track shifting priorities, perceptions of today’s and next-gen services, and provider experience, then pace how fast tech moves from trial to adoption, blending buyer, consumer, and channel inputs with social signals (#WhySwitch, #UX).

Partner with our analyst team to build a custom report designed around your business priorities. From analysing market trends to assessing competitors or crafting bespoke datasets, we tailor insights to your needs.
Supplier Intelligence
Discovery & Profiling
Capacity & Footprint
Performance & Risk
Compliance & Governance
Commercial Readiness
Who Supplies Whom
Scorecards & Shortlists
Playbooks & Docs
Category Intelligence
Definition & Scope
Demand & Use Cases
Cost Drivers
Market Structure
Supply Chain Map
Trade & Policy
Operating Norms
Deliverables
Buyer Intelligence
Account Basics
Spend & Scope
Procurement Model
Vendor Requirements
Terms & Policies
Entry Strategy
Pain Points & Triggers
Outputs
Pricing Analysis
Benchmarks
Trends
Should-Cost
Indexation
Landed Cost
Commercial Terms
Deliverables
Brand Analysis
Positioning & Value Prop
Share & Presence
Customer Evidence
Go-to-Market
Digital & Reputation
Compliance & Trust
KPIs & Gaps
Outputs
Full Research Suite comprises of:
Market outlook & trends analysis
Interviews & case studies
Strategic recommendations
Vendor profiles & capabilities analysis
5-year forecasts
8 regions and 60+ country-level data splits
Market segment data splits
12 months of continuous data updates
DELIVERED AS:
PDF EXCEL ONLINE
Demand Signal Repository Solutions Market Size and Share Forecast Outlook 2025 to 2035
Demand Side Management Market Size and Share Forecast Outlook 2025 to 2035
Demand Response Market Analysis - Size, Share, and Forecast Outlook 2025 to 2035
North America Shipping Supplies Market Trends – Innovations & Growth 2024-2034
Demand of Kozani Saffron in Greece Analysis - Size, Share & Forecast 2025 to 2035
Demand of No-acid Whey Strained Dairy Processing Concepts in European Union Size and Share Forecast Outlook 2025 to 2035
Demand for Bronte Pistachio in Italy Analysis - Size, Share & Forecast 2025 to 2035
Demand and Trend Analysis of Gaming Monitor in Western Europe Size and Share Forecast Outlook 2025 to 2035
Demand and Trend Analysis of Gaming Monitor in Japan Size and Share Forecast Outlook 2025 to 2035
Demand and Trend Analysis of Gaming Monitor in Korea Size and Share Forecast Outlook 2025 to 2035
Glycine Soja (Soybean) Seed Extract Market Size and Share Forecast Outlook 2025 to 2035
Demand and Trend Analysis of Yeast in Japan - Size, Share, and Forecast Outlook 2025 to 2035
Demand and Trends Analysis of Stevia in Japan Size and Share Forecast Outlook 2025 to 2035
Demand of Pistachio-based desserts & ingredients in France Analysis - Size, Share & Forecast 2025 to 2035
Japan Women’s Intimate Care Market Trends – Growth & Forecast 2024-2034
Western Europe Men’s Skincare Market Analysis – Forecast 2023-2033
Demand and Trend Analysis of Fabric Stain Remover in Korea Size and Share Forecast Outlook 2025 to 2035
Demand and Sales Analysis of Paper Cup in Japan Size and Share Forecast Outlook 2025 to 2035
Demand and Sales Analysis of Paper Cup in Korea Size and Share Forecast Outlook 2025 to 2035
Demand and Sales Analysis of Paper Cup in Western Europe Size and Share Forecast Outlook 2025 to 2035

Thank you!
You will receive an email from our Business Development Manager. Please be sure to check your SPAM/JUNK folder too.
Chat With
MaRIA