The USA water treatment system demand is valued at USD 105.7 billion in 2025 and is projected to reach USD 202.9 billion by 2035, growing at a CAGR of 6.7%. Rising requirements for safe drinking water, stricter regulatory standards, and continued investment in municipal and industrial treatment infrastructure drive demand. Aging water networks, increasing wastewater volumes, and the need to address contaminants such as PFAS, heavy metals, and microorganisms further reinforce the need for upgrades and new system installations across treatment facilities and commercial applications.
Reverse osmosis remains the leading technology due to its high removal efficiency for dissolved solids, salts, and emerging contaminants. RO systems are widely adopted across residential, industrial, and municipal applications because of their modular design, predictable filtration performance, and compatibility with multi-stage purification processes. Ongoing improvements in membrane durability, energy recovery devices, and fouling-resistant materials continue to enhance operational efficiency and reduce long-term maintenance needs.
The West, South, and Northeast account for the strongest demand, driven by urban population growth, water scarcity concerns, and modernization of legacy treatment systems. Industrial users in these regions also rely on advanced treatment solutions to meet discharge and reuse standards. Key companies include Veolia Water Technologies, SUEZ Water Technologies, Xylem Inc., Pentair PLC, and Evoqua Water Technologies, focusing on membrane innovation, digital monitoring, and high-capacity treatment solutions.
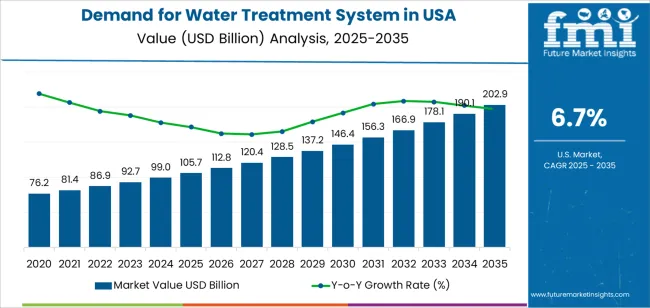
The early growth curve from 2025 to 2029 will show strong acceleration driven by infrastructure upgrades, population-density pressures, and regulatory requirements for municipal and industrial water quality. Investments in membrane filtration, disinfection systems, and advanced treatment for emerging contaminants will support higher early-stage expansion. Rising adoption of decentralized treatment units in residential and commercial settings will also reinforce this period.
From 2030 to 2035, the late growth curve will move toward steadier expansion as large utilities and industrial facilities complete major upgrade cycles. Growth will rely more on replacement installations, system optimization, and integration of digital monitoring tools. Adoption of automated process controls, leak-detection platforms, and predictive maintenance technologies will sustain consistent demand. The comparison between early and late curves shows a shift from infrastructure-driven acceleration to performance-focused maturity supported by long operational lifecycles, compliance needs, and continued emphasis on reliable treatment capacity across U.S. municipal and industrial water systems.
| Metric | Value |
|---|---|
| USA Water Treatment System Sales Value (2025) | USD 105.7 billion |
| USA Water Treatment System Forecast Value (2035) | USD 202.9 billion |
| USA Water Treatment System Forecast CAGR (2025-2035) | 6.7% |
Demand for water treatment systems in the USA is increasing as municipalities, industries and residential users face pressure to improve water quality, manage ageing infrastructure and meet tighter regulatory standards. Contaminants such as lead, PFAS, microplastics and other emerging chemicals raise concern for public health and drive investment in advanced treatment technologies. Industrial sectors including power generation, oil & gas, pharmaceuticals and food processing require robust treatment systems to meet discharge limits, manage process water and support ecofriendly goals.
Infrastructure stimulus programs and higher awareness of water scarcity also support growth in replacement and upgrade of treatment systems. Residential demand rises for point-of-use and point-of-entry systems as consumers seek assurance of safe drinking water in homes and businesses. Constraints to growth include high capital cost of large-scale treatment plants and advanced technologies, long lead-times for design and permitting in municipal projects, and complex regulatory frameworks that vary by state and locality. Some regions with existing sufficient capacity may delay upgrades until service issues or regulation compel action.
Demand for water treatment systems in the United States is shaped by regulatory standards, water-quality requirements, and the need for reliable purification across residential, commercial, and industrial settings. Industry distribution across technology, application, and end-user segments reflects performance expectations, infrastructure age, and regional water-resource challenges.
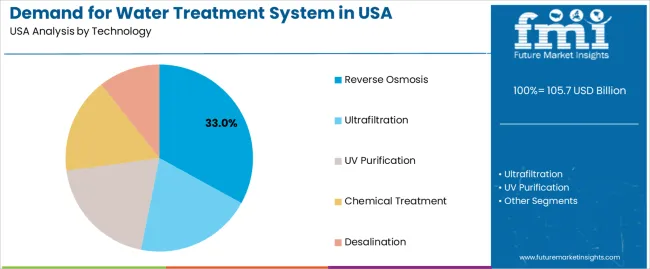
Reverse osmosis (RO) accounts for an estimated 33.0% of U.S. demand and remains the leading water-treatment technology. RO systems support removal of dissolved solids, contaminants, and microorganisms across municipal, residential, and industrial settings. Their dominance reflects high removal efficiency, broad applicability, and increasing use in point-of-use and point-of-entry installations. Ultrafiltration holds 22.0%, supported by applications requiring particulate and pathogen removal without eliminating minerals. UV purification represents 17.0%, used in disinfection-focused systems for residential and commercial facilities. Chemical treatment accounts for 16.0%, supporting municipal systems and industrial process lines requiring scale, corrosion, or microbial control. Desalination holds 12.0%, concentrated in coastal regions and specialized industrial facilities.
Key drivers and attributes:
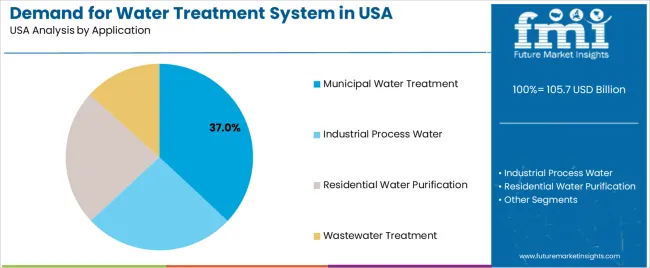
Municipal water treatment represents an estimated 37.0% of U.S. demand due to regulatory oversight, aging infrastructure, and population-driven service requirements. Municipal facilities rely on membrane filtration, chemical treatment, and UV disinfection to maintain compliance with federal and state water-quality standards. Industrial process water accounts for 28.0%, with manufacturing plants and processing facilities requiring consistent water quality for production, cooling, and equipment operation. Residential water purification holds 23.0%, driven by demand for household RO units, activated-carbon systems, and UV purifiers. Wastewater treatment represents 12.0%, involving effluent management, reuse systems, and industrial discharge treatment.
Key drivers and attributes:
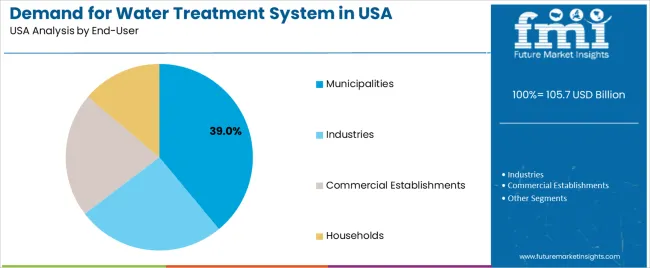
Municipalities hold an estimated 39.0% share of U.S. demand for water treatment systems. Their reliance on large-scale purification, disinfection, and distribution infrastructure creates consistent demand for membrane systems, advanced filtration, and chemical treatment. Industries account for 32.0%, supported by sectors such as manufacturing, chemicals, food processing, and power generation that depend on process-water reliability. Commercial establishments represent 18.0%, including hospitality, healthcare, and office buildings requiring point-of-use purification or centralized treatment. Households hold 11.0%, driven by adoption of domestic RO systems, UV purifiers, and faucet-mounted filters.
Key drivers and attributes:
Growing regulatory standards, ageing infrastructure replacement needs, and rising awareness of water quality are driving demand.
Demand for water treatment systems in the United States is increasing as municipal, industrial, and commercial operators upgrade plants to meet tighter regulatory standards for contaminants including PFAS, nitrates, and emerging organic compounds. Many water-distribution and treatment facilities are decades old and require system replacements or retrofits to maintain reliability and compliance. Concerns over public health, consumer expectations for clean water, and drought/recirculation challenges reinforce investment in treatments such as filtration, advanced oxidation, reverse osmosis, and chemical dosing. Industrial facilities, especially in food & beverage, chemicals and power generation, also seek treatment systems to reduce water use, achieve zero-liquid discharge goals and comply with discharge permits, which supports equipment sales and service contracts across the water-treatment industry.
High capital and operational cost, fragmented decision-making across municipalities, and competition from decentralized or point-of-use systems are restraining further uptake.
Water treatment systems, especially large-scale municipal plants, involve substantial capital expenditures for design, construction, commissioning and long-term operation, which may restrict funding in regions with budget constraints or competing infrastructure priorities. Ownership of water systems is often fragmented across local municipalities, utilities and private entities, which slows decision-making and procurement cycles. Smaller facilities may opt for decentralized or point-of-use treatments that require less capital and provide quicker implementation, which reduces demand for large-scale system upgrades. Operation and maintenance costs, energy, chemical use, staffing, also influence purchase decisions and may lead to deferred upgrades in cost-sensitive jurisdictions.
Adoption of digital monitoring/analytics, growth in water reuse & circular systems, and increased industrial water-treatment investment are shaping industry trends.
Water treatment system providers are integrating sensors, IoT connectivity and real-time data analytics to enable predictive maintenance, process optimisation and remote monitoring. Water reuse and recycling deployment is increasing in industrial facilities, municipal systems and commercial buildings, driving demand for modular reuse treatment units and tertiary systems. Industrial sectors, such as semiconductors, pharmaceuticals and data centres, are investing heavily in ultra-pure water systems, closed-loop recirculation and zero-liquid discharge solutions, which expands niche high-specification treatment industry segments. These trends support broader and more sophisticated demand for water treatment systems across the United States.
Demand for water treatment systems in the United States is increasing through 2035, supported by rising concern over water quality, broader adoption of filtration and purification technologies, and expanding residential, commercial, and industrial requirements. Growth is influenced by infrastructure-aging patterns, regulatory compliance, population density, and shifts in consumer purchasing of point-of-use and point-of-entry systems. The West leads with a 7.8% CAGR, followed by the South (6.9%), the Northeast (6.2%), and the Midwest (5.4%). Demand spans municipal upgrades, industrial pretreatment systems, and residential purification technologies addressing contaminants, hardness, and sediment variation.
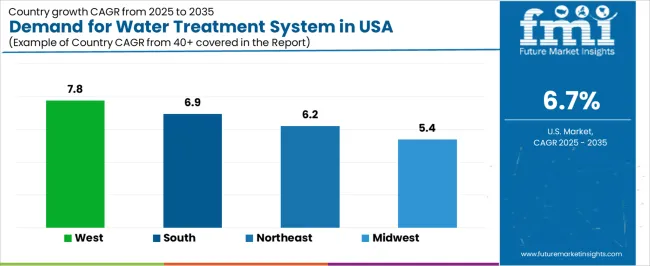
| Region | CAGR (2025-2035) |
|---|---|
| West | 7.8% |
| South | 6.9% |
| Northeast | 6.2% |
| Midwest | 5.4% |
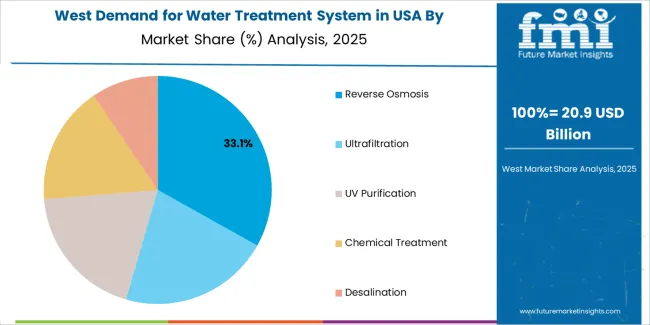
The West grows at 7.8% CAGR, supported by recurring drought conditions, increased reliance on treated surface water, and expanding use of point-of-entry and point-of-use systems in residential and commercial buildings. States such as California, Arizona, Colorado, and Nevada adopt advanced filtration systems to address mineral content, salinity variation, and seasonal contamination levels linked to water scarcity. Municipal utilities upgrade membrane systems and disinfection processes to meet regulatory standards. Industrial facilities deploy pretreatment units to support water reuse and reduce operational strain on local supply. Widespread concern about water reliability reinforces long-term adoption across households and institutions.
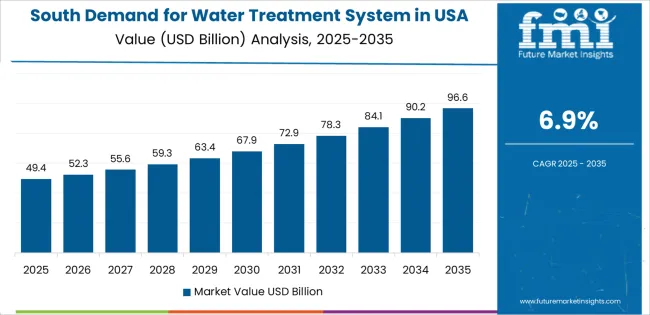
The South grows at 6.9% CAGR, driven by population growth, expanding real-estate development, and increased reliance on groundwater sources requiring treatment for sediment, hardness, and regional contaminants. States including Texas, Florida, Georgia, and North Carolina add significant volumes of residential purification systems due to household water-quality concerns. Industrial facilities use treatment equipment for pretreatment, process-water stabilization, and regulatory compliance in chemical, food-processing, and manufacturing operations. Utilities adopt upgraded filtration systems to support expanding urban populations. Broader interest in whole-home treatment solutions drives stable annual installations.
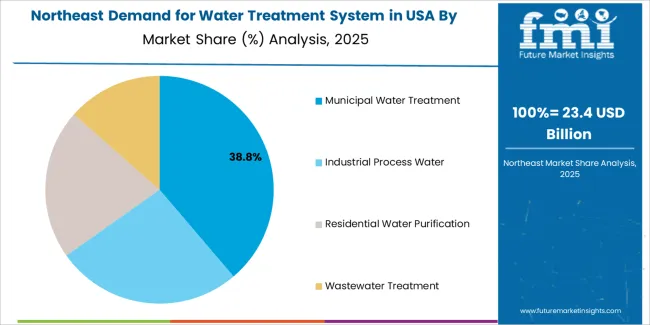
The Northeast grows at 6.2% CAGR, supported by aging water infrastructure, increased detection of legacy contaminants, and steady adoption of point-of-use filtration in densely populated areas. States including New York, Pennsylvania, Massachusetts, and New Jersey maintain strong demand for residential and commercial treatment units addressing lead, sediment, disinfectant by-products, and regional groundwater issues. Municipal utilities undertake phased replacement of outdated treatment components to improve compliance with quality standards. Commercial buildings and institutional facilities use treatment systems for equipment protection and consistency in potable-water delivery.
The Midwest grows at 5.4% CAGR, supported by consistent residential installation activity, widespread hardness issues in groundwater, and increased investment in municipal and industrial water-management systems. States such as Michigan, Wisconsin, Ohio, and Illinois rely heavily on treatment systems to address mineral content, iron presence, and localized contamination concerns. Industrial facilities adopt pretreatment units to reduce scaling and protect process equipment. Municipal utilities upgrade disinfection and filtration technologies to meet evolving regulatory requirements. Growth is steady due to reliable baseline demand across households and commercial properties.
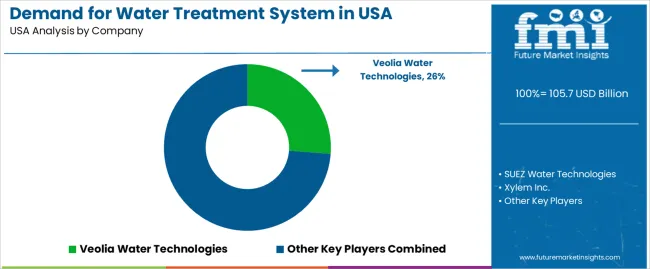
The demand for water treatment systems in the USA is shaped by a concentrated group of engineering and technology providers supplying solutions for municipal utilities, industrial facilities, and commercial installations. Veolia Water Technologies holds the leading position with an estimated 26.2% share, supported by its extensive portfolio covering membrane treatment, clarification, biological processes, and sludge management. Its position is reinforced by long-term contracts, steady project delivery capability, and adherence to federal and state performance standards.
SUEZ Water Technologies and Xylem Inc. follow as prominent participants, offering advanced filtration, UV disinfection, and monitoring technologies suited to surface water, groundwater, and industrial wastewater applications. Their competitive strengths include operational reliability, strong field-service infrastructure, and integration with digital monitoring systems. Pentair PLC maintains a solid position through residential and commercial treatment solutions, supplying filtration and disinfection systems designed for point-of-use and point-of-entry installations.
Evoqua Water Technologies contributes significant capability in high-purity and industrial water treatment, supported by expertise in ion exchange, activated carbon, and membrane systems used in pharmaceuticals, food processing, and electronics. Competition in this segment centers on treatment efficiency, operational resilience, lifecycle cost, and regulatory compliance. Demand is sustained by aging municipal infrastructure, tighter discharge requirements, and broader adoption of membrane filtration, advanced oxidation, and automated quality monitoring across public utilities and industrial facilities.
| Items | Values |
|---|---|
| Quantitative Units | USD billion |
| Technology | Reverse Osmosis, Ultrafiltration, UV Purification, Chemical Treatment, Desalination |
| Application | Municipal Water Treatment, Industrial Process Water, Residential Water Purification, Wastewater Treatment |
| End-User | Municipalities, Industries, Commercial Establishments, Households |
| Regions Covered | West, Midwest, South, Northeast |
| Key Companies Profiled | Veolia Water Technologies, SUEZ Water Technologies, Xylem Inc., Pentair PLC, Evoqua Water Technologies |
| Additional Attributes | Dollar sales by technology, application, and end-user categories; regional adoption trends across West, Midwest, South, and Northeast; competitive landscape of water treatment equipment and service providers; advancements in membrane filtration, UV purification, chemical dosing, and desalination systems; integration with smart water management, industrial water recycling, and municipal infrastructure modernization. |
Wastewater Treatment
The global demand for water treatment system in USA is estimated to be valued at USD 105.7 billion in 2025.
The market size for the demand for water treatment system in USA is projected to reach USD 202.9 billion by 2035.
The demand for water treatment system in USA is expected to grow at a 6.7% CAGR between 2025 and 2035.
The key product types in demand for water treatment system in USA are reverse osmosis, ultrafiltration, uv purification, chemical treatment and desalination.
In terms of application, municipal water treatment segment to command 37.0% share in the demand for water treatment system in USA in 2025.


Our Research Products

The "Full Research Suite" delivers actionable market intel, deep dives on markets or technologies, so clients act faster, cut risk, and unlock growth.

The Leaderboard benchmarks and ranks top vendors, classifying them as Established Leaders, Leading Challengers, or Disruptors & Challengers.

Locates where complements amplify value and substitutes erode it, forecasting net impact by horizon

We deliver granular, decision-grade intel: market sizing, 5-year forecasts, pricing, adoption, usage, revenue, and operational KPIs—plus competitor tracking, regulation, and value chains—across 60 countries broadly.

Spot the shifts before they hit your P&L. We track inflection points, adoption curves, pricing moves, and ecosystem plays to show where demand is heading, why it is changing, and what to do next across high-growth markets and disruptive tech

Real-time reads of user behavior. We track shifting priorities, perceptions of today’s and next-gen services, and provider experience, then pace how fast tech moves from trial to adoption, blending buyer, consumer, and channel inputs with social signals (#WhySwitch, #UX).

Partner with our analyst team to build a custom report designed around your business priorities. From analysing market trends to assessing competitors or crafting bespoke datasets, we tailor insights to your needs.
Supplier Intelligence
Discovery & Profiling
Capacity & Footprint
Performance & Risk
Compliance & Governance
Commercial Readiness
Who Supplies Whom
Scorecards & Shortlists
Playbooks & Docs
Category Intelligence
Definition & Scope
Demand & Use Cases
Cost Drivers
Market Structure
Supply Chain Map
Trade & Policy
Operating Norms
Deliverables
Buyer Intelligence
Account Basics
Spend & Scope
Procurement Model
Vendor Requirements
Terms & Policies
Entry Strategy
Pain Points & Triggers
Outputs
Pricing Analysis
Benchmarks
Trends
Should-Cost
Indexation
Landed Cost
Commercial Terms
Deliverables
Brand Analysis
Positioning & Value Prop
Share & Presence
Customer Evidence
Go-to-Market
Digital & Reputation
Compliance & Trust
KPIs & Gaps
Outputs
Full Research Suite comprises of:
Market outlook & trends analysis
Interviews & case studies
Strategic recommendations
Vendor profiles & capabilities analysis
5-year forecasts
8 regions and 60+ country-level data splits
Market segment data splits
12 months of continuous data updates
DELIVERED AS:
PDF EXCEL ONLINE
Demand Signal Repository Solutions Market Size and Share Forecast Outlook 2025 to 2035
Demand Side Management Market Size and Share Forecast Outlook 2025 to 2035
Demand Response Market Analysis - Size, Share, and Forecast Outlook 2025 to 2035
North America Shipping Supplies Market Trends – Innovations & Growth 2024-2034
Demand of Kozani Saffron in Greece Analysis - Size, Share & Forecast 2025 to 2035
Demand of No-acid Whey Strained Dairy Processing Concepts in European Union Size and Share Forecast Outlook 2025 to 2035
Demand for Bronte Pistachio in Italy Analysis - Size, Share & Forecast 2025 to 2035
Demand and Trend Analysis of Gaming Monitor in Western Europe Size and Share Forecast Outlook 2025 to 2035
Demand and Trend Analysis of Gaming Monitor in Japan Size and Share Forecast Outlook 2025 to 2035
Demand and Trend Analysis of Gaming Monitor in Korea Size and Share Forecast Outlook 2025 to 2035
Glycine Soja (Soybean) Seed Extract Market Size and Share Forecast Outlook 2025 to 2035
Demand and Trend Analysis of Yeast in Japan - Size, Share, and Forecast Outlook 2025 to 2035
Demand and Trends Analysis of Stevia in Japan Size and Share Forecast Outlook 2025 to 2035
Demand of Pistachio-based desserts & ingredients in France Analysis - Size, Share & Forecast 2025 to 2035
Japan Women’s Intimate Care Market Trends – Growth & Forecast 2024-2034
Western Europe Men’s Skincare Market Analysis – Forecast 2023-2033
Demand and Trend Analysis of Fabric Stain Remover in Korea Size and Share Forecast Outlook 2025 to 2035
Demand and Sales Analysis of Paper Cup in Japan Size and Share Forecast Outlook 2025 to 2035
Demand and Sales Analysis of Paper Cup in Korea Size and Share Forecast Outlook 2025 to 2035
Demand and Sales Analysis of Paper Cup in Western Europe Size and Share Forecast Outlook 2025 to 2035

Thank you!
You will receive an email from our Business Development Manager. Please be sure to check your SPAM/JUNK folder too.
Chat With
MaRIA