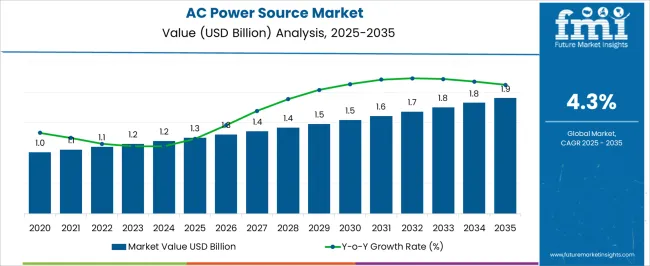
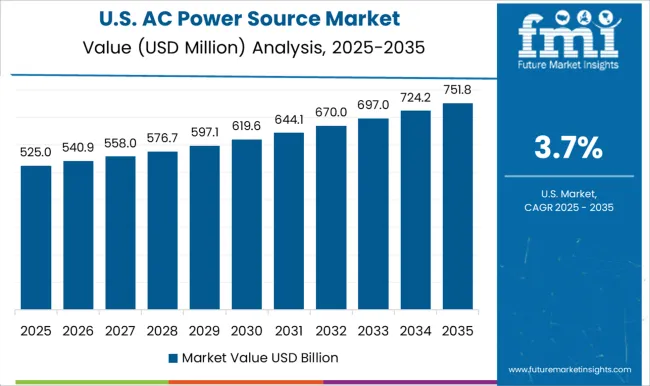
The AC power source market is expected to expand at a CAGR of 4.30% through 2034. The market value is projected to increase from US$ 1.2 billion in 2024 to US$ 1.8 billion by 2034. The AC power source industry was valued at US$ 1.1 billion in 2023.
The demand for AC power sources is projected to rise consistently due to significant technological breakthroughs. As energy consumption is becoming a serious global matter due to non-stop residential, commercial, and industrial activities, the demand for energy-efficient devices is increasing with the rising use of renewable energy sources. Both of these factors are anticipated to fuel the market’s growth.
After realizing their potential in developed markets, players within the AC power source market are likely to find lucrative opportunities within emerging economies as these countries increase their use of electric vehicles and develop smart grids. Intensifying focus on smart city infrastructure in these countries is projected to increase the consumption of AC power sources.
Attributes | Details |
---|---|
Market Size, 2023 | US$ 1.1 billion |
Market Size, 2024 | US$ 1.2 billion |
AC Power Source Market Size, 2034 | US$ 1.8 billion |
Value-based CAGR (2024 to 2034) | 4.30% |
Don't pay for what you don't need
Customize your report by selecting specific countries or regions and save 30%!
Attributes | Details |
---|---|
AC Power Source Market Value (2019) | US$ 0.87 billion |
Market Value (2023) | US$ 1.1 billion |
Historical CAGR (2019 to 2023) | 6.00% |
The AC power source market registered a CAGR of 6.00% from 2019 to 2023. The market reached US$ 1.1 billion in 2023, from US$ 0.87 billion in 2019. The increasing global population and rapid urbanization indirectly contributed to the market during the historical period.
A noticeable shift toward renewable energy sources like wind and solar power is stimulating market growth. Other factors that are fueling the market are as follows:
In upcoming years, investments in renewable energy sources are projected to increase, thus creating demand for reliable and efficient AC power sources for energy storage and conversion. Regionally, Asia Pacific is predicted to witness an influx of top players who wish to capitalize on the significant economic growth of the region.
The market is expected to increase from US$ 1.2 billion in 2024 to US$ 1.8 billion by 2034. The market is expected to expand at a consistent CAGR of 4.30% over the forecast period.
Country | CAGR (2024 to 2034) |
---|---|
United States | 4.50% |
United Kingdom | 5.60% |
China | 4.70% |
Japan | 5.10% |
South Korea | 6.10% |
The consumption of AC power sources in the United States in different application sectors is increasing at a pace of 4.50% through 2034. The factors responsible for this growth are as follows:
The use of AC power sources is projected to increase in the United Kingdom at a CAGR of 5.60% through 2034. The factors driving the market growth are as follows:
The demand for AC power sources is increasing in China, with a projected CAGR of 4.70% through 2034. Emerging patterns in the China market are as follows:
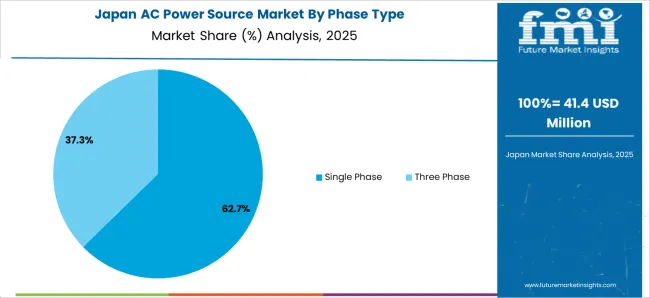
The Japan AC power source market is assessed to register a CAGR of 5.10% through 2034. The deployment of AC power sources is increasing on account of the following:
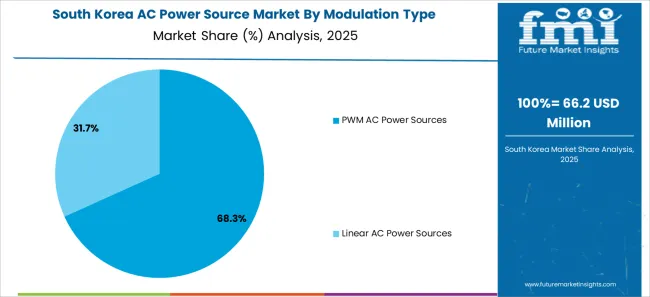
Key players are significantly investing in South Korea, as the country is offering greater growth opportunities than its counterparts. Through 2034, South Korea is projected to expand at a CAGR of 6.10%, driven by the following factors:
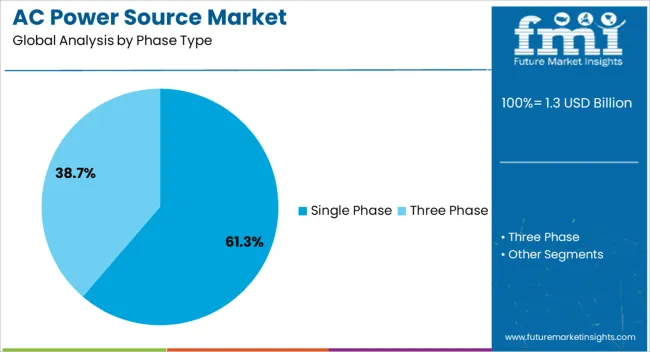
Leading Phase Type | Single Phase |
---|---|
CAGR (2024 to 2034) | 4.1% |
The single phase segment is a substantially preferred phase type. The following factors back the adoption of single phase AC power sources:
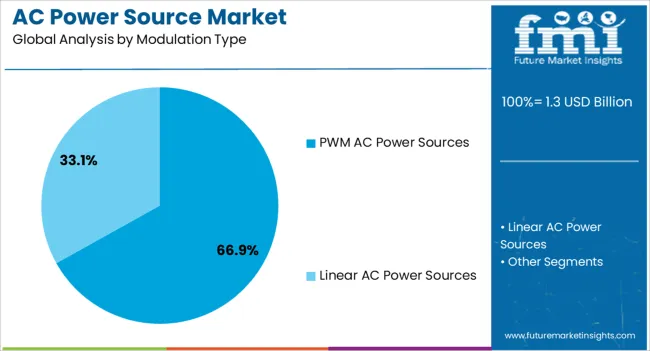
Leading Modulation Type | Linear AC Power Sources |
---|---|
CAGR (2024 to 2034) | 3.9% |
The linear AC power sources segment is anticipated to find significant adoption based on the modulation type. Top factors that are spurring the segment growth are:
Get the data you need at a Fraction of the cost
Personalize your report by choosing insights you need
and save 40%!
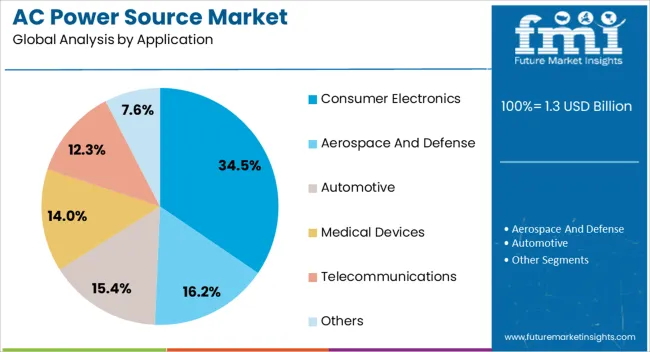
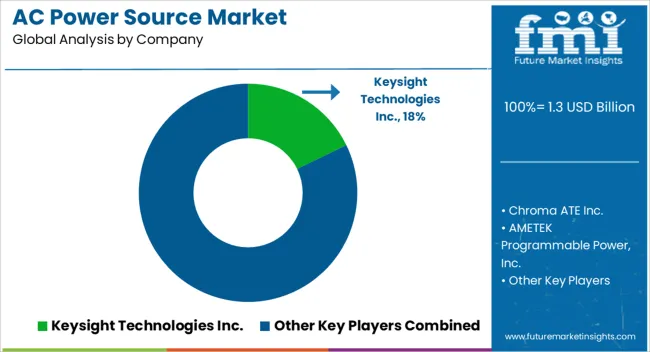
Key players are adding advanced features to their AC power sources to increase their appeal among end users. Additionally, industry leaders are concentrating on certain niche applications like aerospace testing, renewable energy integration, or electric vehicle charging to serve unique market needs effectively.
Market contenders also provide customizable power source solutions as they take a customer-centric approach and develop stronger relationships.
Leading vendors are collaborating with complementary companies from the power industry to increase their reach and gain access to new customer segments. Market players are expanding geographically via partnerships, acquisitions, or by establishing local production to increase brand visibility and customer base.
Key players are further focusing on targeted marketing campaigns to raise awareness about the brands’ unique selling propositions.
Recent Developments
The AC power source market is projected to be worth US$ 1.2 billion in 2024.
The market is predicted to expand at a CAGR of 4.3% through 2034.
The market is anticipated to account for US$ 1.8 billion by 2034.
South Korea is predicted to provide significant growth opportunities.
The single phase segment holds a significant share of the market.
1. Executive Summary 1.1. Global Market Outlook 1.2. Demand-side Trends 1.3. Supply-side Trends 1.4. Technology Roadmap Analysis 1.5. Analysis and Recommendations 2. Market Overview 2.1. Market Coverage / Taxonomy 2.2. Market Definition / Scope / Limitations 3. Market Background 3.1. Market Dynamics 3.1.1. Drivers 3.1.2. Restraints 3.1.3. Opportunity 3.1.4. Trends 3.2. Scenario Forecast 3.2.1. Demand in Optimistic Scenario 3.2.2. Demand in Likely Scenario 3.2.3. Demand in Conservative Scenario 3.3. Opportunity Map Analysis 3.4. Product Life Cycle Analysis 3.5. Supply Chain Analysis 3.5.1. Supply Side Participants and their Roles 3.5.1.1. Producers 3.5.1.2. Mid-Level Participants (Traders/ Agents/ Brokers) 3.5.1.3. Wholesalers and Distributors 3.5.2. Value Added and Value Created at Node in the Supply Chain 3.5.3. List of Raw Material Suppliers 3.5.4. List of Existing and Potential Buyer’s 3.6. Investment Feasibility Matrix 3.7. Value Chain Analysis 3.7.1. Profit Margin Analysis 3.7.2. Wholesalers and Distributors 3.7.3. Retailers 3.8. PESTLE and Porter’s Analysis 3.9. Regulatory Landscape 3.9.1. By Key Regions 3.9.2. By Key Countries 3.10. Regional Parent Market Outlook 3.11. Production and Consumption Statistics 3.12. Import and Export Statistics 4. Global Market Analysis 2019 to 2023 and Forecast, 2024 to 2034 4.1. Historical Market Size Value (US$ Million) & Volume (Units) Analysis, 2019 to 2023 4.2. Current and Future Market Size Value (US$ Million) & Volume (Units) Projections, 2024 to 2034 4.2.1. Y-o-Y Growth Trend Analysis 4.2.2. Absolute $ Opportunity Analysis 5. Global Market Analysis 2019 to 2023 and Forecast 2024 to 2034, By Phase Type 5.1. Introduction / Key Findings 5.2. Historical Market Size Value (US$ Million) & Volume (Units) Analysis By Phase Type, 2019 to 2023 5.3. Current and Future Market Size Value (US$ Million) & Volume (Units) Analysis and Forecast By Phase Type, 2024 to 2034 5.3.1. Single Phase 5.3.2. Three Phase 5.4. Y-o-Y Growth Trend Analysis By Phase Type, 2019 to 2023 5.5. Absolute $ Opportunity Analysis By Phase Type, 2024 to 2034 6. Global Market Analysis 2019 to 2023 and Forecast 2024 to 2034, By Modulation Type 6.1. Introduction / Key Findings 6.2. Historical Market Size Value (US$ Million) & Volume (Units) Analysis By Modulation Type, 2019 to 2023 6.3. Current and Future Market Size Value (US$ Million) & Volume (Units) Analysis and Forecast By Modulation Type, 2024 to 2034 6.3.1. Linear AC Power Sources 6.3.2. PWM AC Power Sources 6.4. Y-o-Y Growth Trend Analysis By Modulation Type, 2019 to 2023 6.5. Absolute $ Opportunity Analysis By Modulation Type, 2024 to 2034 7. Global Market Analysis 2019 to 2023 and Forecast 2024 to 2034, By Application 7.1. Introduction / Key Findings 7.2. Historical Market Size Value (US$ Million) & Volume (Units) Analysis By Application, 2019 to 2023 7.3. Current and Future Market Size Value (US$ Million) & Volume (Units) Analysis and Forecast By Application, 2024 to 2034 7.3.1. Aerospace and Defense 7.3.2. Automotive 7.3.3. Consumer Electronics 7.3.4. Medical Devices 7.3.5. Telecommunications 7.3.6. Others 7.4. Y-o-Y Growth Trend Analysis By Application, 2019 to 2023 7.5. Absolute $ Opportunity Analysis By Application, 2024 to 2034 8. Global Market Analysis 2019 to 2023 and Forecast 2024 to 2034, By Region 8.1. Introduction 8.2. Historical Market Size Value (US$ Million) & Volume (Units) Analysis By Region, 2019 to 2023 8.3. Current Market Size Value (US$ Million) & Volume (Units) Analysis and Forecast By Region, 2024 to 2034 8.3.1. North America 8.3.2. Latin America 8.3.3. Western Europe 8.3.4. Eastern Europe 8.3.5. South Asia and Pacific 8.3.6. East Asia 8.3.7. Middle East and Africa 8.4. Market Attractiveness Analysis By Region 9. North America Market Analysis 2019 to 2023 and Forecast 2024 to 2034, By Country 9.1. Historical Market Size Value (US$ Million) & Volume (Units) Trend Analysis By Market Taxonomy, 2019 to 2023 9.2. Market Size Value (US$ Million) & Volume (Units) Forecast By Market Taxonomy, 2024 to 2034 9.2.1. By Country 9.2.1.1. USA 9.2.1.2. Canada 9.2.2. By Phase Type 9.2.3. By Modulation Type 9.2.4. By Application 9.3. Market Attractiveness Analysis 9.3.1. By Country 9.3.2. By Phase Type 9.3.3. By Modulation Type 9.3.4. By Application 9.4. Key Takeaways 10. Latin America Market Analysis 2019 to 2023 and Forecast 2024 to 2034, By Country 10.1. Historical Market Size Value (US$ Million) & Volume (Units) Trend Analysis By Market Taxonomy, 2019 to 2023 10.2. Market Size Value (US$ Million) & Volume (Units) Forecast By Market Taxonomy, 2024 to 2034 10.2.1. By Country 10.2.1.1. Brazil 10.2.1.2. Mexico 10.2.1.3. Rest of Latin America 10.2.2. By Phase Type 10.2.3. By Modulation Type 10.2.4. By Application 10.3. Market Attractiveness Analysis 10.3.1. By Country 10.3.2. By Phase Type 10.3.3. By Modulation Type 10.3.4. By Application 10.4. Key Takeaways 11. Western Europe Market Analysis 2019 to 2023 and Forecast 2024 to 2034, By Country 11.1. Historical Market Size Value (US$ Million) & Volume (Units) Trend Analysis By Market Taxonomy, 2019 to 2023 11.2. Market Size Value (US$ Million) & Volume (Units) Forecast By Market Taxonomy, 2024 to 2034 11.2.1. By Country 11.2.1.1. Germany 11.2.1.2. UK 11.2.1.3. France 11.2.1.4. Spain 11.2.1.5. Italy 11.2.1.6. Rest of Western Europe 11.2.2. By Phase Type 11.2.3. By Modulation Type 11.2.4. By Application 11.3. Market Attractiveness Analysis 11.3.1. By Country 11.3.2. By Phase Type 11.3.3. By Modulation Type 11.3.4. By Application 11.4. Key Takeaways 12. Eastern Europe Market Analysis 2019 to 2023 and Forecast 2024 to 2034, By Country 12.1. Historical Market Size Value (US$ Million) & Volume (Units) Trend Analysis By Market Taxonomy, 2019 to 2023 12.2. Market Size Value (US$ Million) & Volume (Units) Forecast By Market Taxonomy, 2024 to 2034 12.2.1. By Country 12.2.1.1. Poland 12.2.1.2. Russia 12.2.1.3. Czech Republic 12.2.1.4. Romania 12.2.1.5. Rest of Eastern Europe 12.2.2. By Phase Type 12.2.3. By Modulation Type 12.2.4. By Application 12.3. Market Attractiveness Analysis 12.3.1. By Country 12.3.2. By Phase Type 12.3.3. By Modulation Type 12.3.4. By Application 12.4. Key Takeaways 13. South Asia and Pacific Market Analysis 2019 to 2023 and Forecast 2024 to 2034, By Country 13.1. Historical Market Size Value (US$ Million) & Volume (Units) Trend Analysis By Market Taxonomy, 2019 to 2023 13.2. Market Size Value (US$ Million) & Volume (Units) Forecast By Market Taxonomy, 2024 to 2034 13.2.1. By Country 13.2.1.1. India 13.2.1.2. Bangladesh 13.2.1.3. Australia 13.2.1.4. New Zealand 13.2.1.5. Rest of South Asia and Pacific 13.2.2. By Phase Type 13.2.3. By Modulation Type 13.2.4. By Application 13.3. Market Attractiveness Analysis 13.3.1. By Country 13.3.2. By Phase Type 13.3.3. By Modulation Type 13.3.4. By Application 13.4. Key Takeaways 14. East Asia Market Analysis 2019 to 2023 and Forecast 2024 to 2034, By Country 14.1. Historical Market Size Value (US$ Million) & Volume (Units) Trend Analysis By Market Taxonomy, 2019 to 2023 14.2. Market Size Value (US$ Million) & Volume (Units) Forecast By Market Taxonomy, 2024 to 2034 14.2.1. By Country 14.2.1.1. China 14.2.1.2. Japan 14.2.1.3. South Korea 14.2.2. By Phase Type 14.2.3. By Modulation Type 14.2.4. By Application 14.3. Market Attractiveness Analysis 14.3.1. By Country 14.3.2. By Phase Type 14.3.3. By Modulation Type 14.3.4. By Application 14.4. Key Takeaways 15. Middle East and Africa Market Analysis 2019 to 2023 and Forecast 2024 to 2034, By Country 15.1. Historical Market Size Value (US$ Million) & Volume (Units) Trend Analysis By Market Taxonomy, 2019 to 2023 15.2. Market Size Value (US$ Million) & Volume (Units) Forecast By Market Taxonomy, 2024 to 2034 15.2.1. By Country 15.2.1.1. GCC Countries 15.2.1.2. South Africa 15.2.1.3. Israel 15.2.1.4. Rest of MEA 15.2.2. By Phase Type 15.2.3. By Modulation Type 15.2.4. By Application 15.3. Market Attractiveness Analysis 15.3.1. By Country 15.3.2. By Phase Type 15.3.3. By Modulation Type 15.3.4. By Application 15.4. Key Takeaways 16. Key Countries Market Analysis 16.1. USA 16.1.1. Pricing Analysis 16.1.2. Market Share Analysis, 2023 16.1.2.1. By Phase Type 16.1.2.2. By Modulation Type 16.1.2.3. By Application 16.2. Canada 16.2.1. Pricing Analysis 16.2.2. Market Share Analysis, 2023 16.2.2.1. By Phase Type 16.2.2.2. By Modulation Type 16.2.2.3. By Application 16.3. Brazil 16.3.1. Pricing Analysis 16.3.2. Market Share Analysis, 2023 16.3.2.1. By Phase Type 16.3.2.2. By Modulation Type 16.3.2.3. By Application 16.4. Mexico 16.4.1. Pricing Analysis 16.4.2. Market Share Analysis, 2023 16.4.2.1. By Phase Type 16.4.2.2. By Modulation Type 16.4.2.3. By Application 16.5. Germany 16.5.1. Pricing Analysis 16.5.2. Market Share Analysis, 2023 16.5.2.1. By Phase Type 16.5.2.2. By Modulation Type 16.5.2.3. By Application 16.6. UK 16.6.1. Pricing Analysis 16.6.2. Market Share Analysis, 2023 16.6.2.1. By Phase Type 16.6.2.2. By Modulation Type 16.6.2.3. By Application 16.7. France 16.7.1. Pricing Analysis 16.7.2. Market Share Analysis, 2023 16.7.2.1. By Phase Type 16.7.2.2. By Modulation Type 16.7.2.3. By Application 16.8. Spain 16.8.1. Pricing Analysis 16.8.2. Market Share Analysis, 2023 16.8.2.1. By Phase Type 16.8.2.2. By Modulation Type 16.8.2.3. By Application 16.9. Italy 16.9.1. Pricing Analysis 16.9.2. Market Share Analysis, 2023 16.9.2.1. By Phase Type 16.9.2.2. By Modulation Type 16.9.2.3. By Application 16.10. Poland 16.10.1. Pricing Analysis 16.10.2. Market Share Analysis, 2023 16.10.2.1. By Phase Type 16.10.2.2. By Modulation Type 16.10.2.3. By Application 16.11. Russia 16.11.1. Pricing Analysis 16.11.2. Market Share Analysis, 2023 16.11.2.1. By Phase Type 16.11.2.2. By Modulation Type 16.11.2.3. By Application 16.12. Czech Republic 16.12.1. Pricing Analysis 16.12.2. Market Share Analysis, 2023 16.12.2.1. By Phase Type 16.12.2.2. By Modulation Type 16.12.2.3. By Application 16.13. Romania 16.13.1. Pricing Analysis 16.13.2. Market Share Analysis, 2023 16.13.2.1. By Phase Type 16.13.2.2. By Modulation Type 16.13.2.3. By Application 16.14. India 16.14.1. Pricing Analysis 16.14.2. Market Share Analysis, 2023 16.14.2.1. By Phase Type 16.14.2.2. By Modulation Type 16.14.2.3. By Application 16.15. Bangladesh 16.15.1. Pricing Analysis 16.15.2. Market Share Analysis, 2023 16.15.2.1. By Phase Type 16.15.2.2. By Modulation Type 16.15.2.3. By Application 16.16. Australia 16.16.1. Pricing Analysis 16.16.2. Market Share Analysis, 2023 16.16.2.1. By Phase Type 16.16.2.2. By Modulation Type 16.16.2.3. By Application 16.17. New Zealand 16.17.1. Pricing Analysis 16.17.2. Market Share Analysis, 2023 16.17.2.1. By Phase Type 16.17.2.2. By Modulation Type 16.17.2.3. By Application 16.18. China 16.18.1. Pricing Analysis 16.18.2. Market Share Analysis, 2023 16.18.2.1. By Phase Type 16.18.2.2. By Modulation Type 16.18.2.3. By Application 16.19. Japan 16.19.1. Pricing Analysis 16.19.2. Market Share Analysis, 2023 16.19.2.1. By Phase Type 16.19.2.2. By Modulation Type 16.19.2.3. By Application 16.20. South Korea 16.20.1. Pricing Analysis 16.20.2. Market Share Analysis, 2023 16.20.2.1. By Phase Type 16.20.2.2. By Modulation Type 16.20.2.3. By Application 16.21. GCC Countries 16.21.1. Pricing Analysis 16.21.2. Market Share Analysis, 2023 16.21.2.1. By Phase Type 16.21.2.2. By Modulation Type 16.21.2.3. By Application 16.22. South Africa 16.22.1. Pricing Analysis 16.22.2. Market Share Analysis, 2023 16.22.2.1. By Phase Type 16.22.2.2. By Modulation Type 16.22.2.3. By Application 16.23. Israel 16.23.1. Pricing Analysis 16.23.2. Market Share Analysis, 2023 16.23.2.1. By Phase Type 16.23.2.2. By Modulation Type 16.23.2.3. By Application 17. Market Structure Analysis 17.1. Competition Dashboard 17.2. Competition Benchmarking 17.3. Market Share Analysis of Top Players 17.3.1. By Regional 17.3.2. By Phase Type 17.3.3. By Modulation Type 17.3.4. By Application 18. Competition Analysis 18.1. Competition Deep Dive 18.1.1. Keysight Technologies Inc. 18.1.1.1. Overview 18.1.1.2. Product Portfolio 18.1.1.3. Profitability by Market Segments 18.1.1.4. Sales Footprint 18.1.1.5. Strategy Overview 18.1.1.5.1. Marketing Strategy 18.1.1.5.2. Product Strategy 18.1.1.5.3. Channel Strategy 18.1.2. Chroma ATE Inc. 18.1.2.1. Overview 18.1.2.2. Product Portfolio 18.1.2.3. Profitability by Market Segments 18.1.2.4. Sales Footprint 18.1.2.5. Strategy Overview 18.1.2.5.1. Marketing Strategy 18.1.2.5.2. Product Strategy 18.1.2.5.3. Channel Strategy 18.1.3. AMETEK Programmable Power Inc. 18.1.3.1. Overview 18.1.3.2. Product Portfolio 18.1.3.3. Profitability by Market Segments 18.1.3.4. Sales Footprint 18.1.3.5. Strategy Overview 18.1.3.5.1. Marketing Strategy 18.1.3.5.2. Product Strategy 18.1.3.5.3. Channel Strategy 18.1.4. B&K Precision Corporation 18.1.4.1. Overview 18.1.4.2. Product Portfolio 18.1.4.3. Profitability by Market Segments 18.1.4.4. Sales Footprint 18.1.4.5. Strategy Overview 18.1.4.5.1. Marketing Strategy 18.1.4.5.2. Product Strategy 18.1.4.5.3. Channel Strategy 18.1.5. National Instruments Corporation 18.1.5.1. Overview 18.1.5.2. Product Portfolio 18.1.5.3. Profitability by Market Segments 18.1.5.4. Sales Footprint 18.1.5.5. Strategy Overview 18.1.5.5.1. Marketing Strategy 18.1.5.5.2. Product Strategy 18.1.5.5.3. Channel Strategy 18.1.6. Tektronix Inc. 18.1.6.1. Overview 18.1.6.2. Product Portfolio 18.1.6.3. Profitability by Market Segments 18.1.6.4. Sales Footprint 18.1.6.5. Strategy Overview 18.1.6.5.1. Marketing Strategy 18.1.6.5.2. Product Strategy 18.1.6.5.3. Channel Strategy 18.1.7. California Instruments Corporation 18.1.7.1. Overview 18.1.7.2. Product Portfolio 18.1.7.3. Profitability by Market Segments 18.1.7.4. Sales Footprint 18.1.7.5. Strategy Overview 18.1.7.5.1. Marketing Strategy 18.1.7.5.2. Product Strategy 18.1.7.5.3. Channel Strategy 18.1.8. Kikusui Electronics Corporation 18.1.8.1. Overview 18.1.8.2. Product Portfolio 18.1.8.3. Profitability by Market Segments 18.1.8.4. Sales Footprint 18.1.8.5. Strategy Overview 18.1.8.5.1. Marketing Strategy 18.1.8.5.2. Product Strategy 18.1.8.5.3. Channel Strategy 18.1.9. Matsusada Precision Inc. 18.1.9.1. Overview 18.1.9.2. Product Portfolio 18.1.9.3. Profitability by Market Segments 18.1.9.4. Sales Footprint 18.1.9.5. Strategy Overview 18.1.9.5.1. Marketing Strategy 18.1.9.5.2. Product Strategy 18.1.9.5.3. Channel Strategy 18.1.10. NF Corporation 18.1.10.1. Overview 18.1.10.2. Product Portfolio 18.1.10.3. Profitability by Market Segments 18.1.10.4. Sales Footprint 18.1.10.5. Strategy Overview 18.1.10.5.1. Marketing Strategy 18.1.10.5.2. Product Strategy 18.1.10.5.3. Channel Strategy 18.1.11. Preen (AC Power Corp.) 18.1.11.1. Overview 18.1.11.2. Product Portfolio 18.1.11.3. Profitability by Market Segments 18.1.11.4. Sales Footprint 18.1.11.5. Strategy Overview 18.1.11.5.1. Marketing Strategy 18.1.11.5.2. Product Strategy 18.1.11.5.3. Channel Strategy 19. Assumptions & Acronyms Used 20. Research Methodology
Explore Technology Insights
View Reports