Aerospace Engineering Services Outsourcing (ESO) Market Size, Share, and Forecast Outlook 2025 to 2035

The aerospace engineering services outsourcing (ESO) market stands at USD 188 billion in 2025 and will reach USD 1,754 billion by 2035, expanding at a CAGR of 25%, which equates to a multiplying factor of around 9.3x over the decade.

Breakpoint analysis highlights distinct phases where growth accelerates due to structural shifts in demand, technological advancement, and cost optimization strategies by aerospace manufacturers. The first breakpoint occurs in the late 2020s as OEMs and Tier 1 suppliers increase outsourcing to reduce costs and focus on core competencies, particularly in design, simulation, and testing services.

A second breakpoint emerges in the early 2030s, when digital engineering, model-based systems, and artificial intelligence integration create new outsourcing opportunities. This stage accelerates adoption as companies seek partners with advanced capabilities in digital twin development, avionics software, and next-generation propulsion systems.

By 2035, with the market reaching 1,754 billion, a critical breakpoint is crossed where outsourcing becomes not only a cost-reduction strategy but a central enabler of innovation and speed-to-market. The trajectory underscores how the ESO market evolves from tactical support to strategic collaboration, positioning service providers as integral contributors to aerospace innovation, lifecycle management, and global competitiveness.
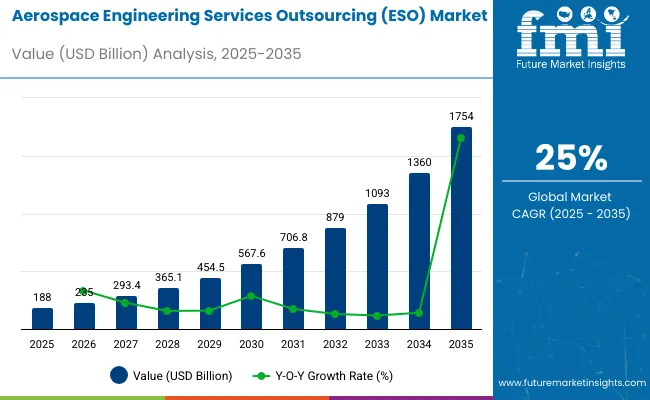
Quick Stats of Aerospace Engineering Services Outsourcing (ESO) Market

  • Aerospace Engineering Services Outsourcing (ESO) Market Size (2025):USD 188 billion
  • Projected Aerospace Engineering Services Outsourcing (ESO) Market Size (2035): USD 1,754 billion
  • Forecast CAGR of Aerospace Engineering Services Outsourcing (ESO) Market (2025-2035): 25%
  • Leading Service Type of Aerospace Engineering Services Outsourcing (ESO) Market (2025): Design and prototyping
  • Key Growth Regions of Aerospace Engineering Services Outsourcing (ESO) Market: North America, Europe, Asia Pacific
  • Top Key Players of Aerospace Engineering Services Outsourcing (ESO) Market: Infosys, Tata Technologies, Tech Mahindra, HCLTech, Wipro

Aerospace Engineering Services Outsourcing Eso Market

The aerospace ESO market draws support from multiple upstream industries. Aircraft and spacecraft manufacturing contributes about 39%, as OEMs rely heavily on outsourced design, simulation, and certification services. Engineering and IT services providers account for approximately 28%, delivering specialized expertise in CAD modeling, product lifecycle management, and digital twin technologies.

Avionics and systems integration represents nearly 17%, where outsourcing facilitates complex software development and hardware validation. Research and development institutions and testing services hold close to 10%, ensuring innovation, structural validation, and compliance. Aftermarket engineering and maintenance support contributes the remaining 6%, addressing retrofitting, upgrades, and technical documentation.

The market is advancing with greater reliance on digital engineering, automation, and global collaboration. Companies are adopting model-based system engineering and simulation-driven design to accelerate time-to-market. Cloud-enabled collaboration platforms are enabling cross-border outsourcing partnerships, ensuring seamless integration between design centers and manufacturers.

Key service providers are expanding their capabilities in artificial intelligence, cybersecurity, and digital twin development to address the growing complexity of aerospace programs. Outsourcing strategies are increasingly centered on long-term partnerships with OEMs and tier-one suppliers, allowing for cost optimization, access to specialized talent, and alignment with strict aerospace quality standards.

Top Aerospace Engineering Services Outsourcing Market Dynamics

Growth is strongly tied to rising aircraft production, digital engineering adoption, and cost optimization initiatives. Service providers are increasingly engaged in design, structural analysis, system integration, and digital twin development. Outsourcing penetration already exceeds 35% in commercial aviation engineering functions, and defense programs are steadily adopting ESO to manage development cycles. North America and Europe together account for more than 60% of outsourcing demand, while Asia Pacific is expanding at a faster pace, driven by engineering hubs in India and China that provide scalable and cost-efficient services for global aerospace OEMs and tier-1 suppliers.

Growth Opportunity Expansion of Digital and Simulation Services

Aerospace OEMs and tier-1 suppliers are increasingly outsourcing digital engineering, simulation, and virtual prototyping to reduce development costs. Simulation-based design is estimated to cut physical testing requirements by 25-30%, directly lowering program expenses. Engineering firms with capabilities in digital twin technologies are securing long-term contracts to support predictive maintenance solutions for fleets.

Outsourcing partners are also focusing on artificial intelligence and machine learning integration, enabling faster structural analysis and system validation. By 2035, digital and simulation outsourcing is projected to account for nearly 40% of total ESO revenues, creating strong opportunities for service providers specializing in high-end virtual engineering platforms.

Driving Force Cost Optimization and Capacity Expansion

The rising complexity of aircraft programs is driving OEMs and suppliers to outsource engineering to manage costs and expand design capacity. Outsourcing enables aerospace companies to save 20-25% in development expenditure by leveraging offshore engineering hubs. Labor cost differentials, combined with scalability, allow companies to manage peak workloads more efficiently.

ESO also supports shorter development cycles, particularly for new-generation aircraft that require continuous design modifications. With aircraft deliveries projected to double over the next decade, outsourcing engineering services provides OEMs a flexible model to meet rising demand without significantly increasing in-house engineering resources.

Emerging Trend Shift Toward High-Value Engineering Work

Earlier outsourcing contracts were focused mainly on drafting and documentation, but the industry is moving toward complex engineering services such as system integration, avionics software development, and advanced materials research. High-value engineering outsourcing already represents around 45% of current ESO contracts, with expectations of surpassing 60% by 2035.

Service providers are building domain-specific expertise in propulsion systems, structural composites, and unmanned aircraft design. The integration of cloud-based collaborative platforms allows real-time engineering development across multiple geographies. This shift positions outsourcing partners not just as cost-saving vendors but as strategic engineering collaborators for aerospace OEMs.

Market Challenge Compliance, Security, and IP Protection

Compliance with aerospace certification standards such as DO-178C for software and AS9100 for quality management adds cost and time to outsourced projects. Data security and intellectual property protection remain major concerns, with aerospace companies requiring multi-layered cybersecurity systems before engaging in outsourcing contracts.

Certification processes and security compliance can add 12-18% to outsourcing costs, affecting profitability for service providers. Additionally, defense programs impose strict restrictions on cross-border outsourcing, limiting global participation. Dependence on a few large outsourcing hubs also creates concentration risks. Balancing cost benefits with compliance and security challenges remains a critical restraint for the ESO market.

Analyzing Aerospace Engineering Services Outsourcing Market by Top Investment Segments

The Aerospace Engineering Services Outsourcing (ESO) market in 2025 shows consistent demand from OEMs, Tier 1 suppliers, airlines, and space agencies. Design engineering, structural development, and 3D modeling account for the largest service contributions, while aerostructures and avionics lead application-related outsourcing.

Narrow-body aircraft dominate by platform demand, with offshore outsourcing serving as the preferred delivery approach. OEMs remain the primary clients, driving partnerships with global engineering service providers. The market demonstrates how outsourcing has become integral in managing aerospace design, certification, and production efficiency across multiple programs.
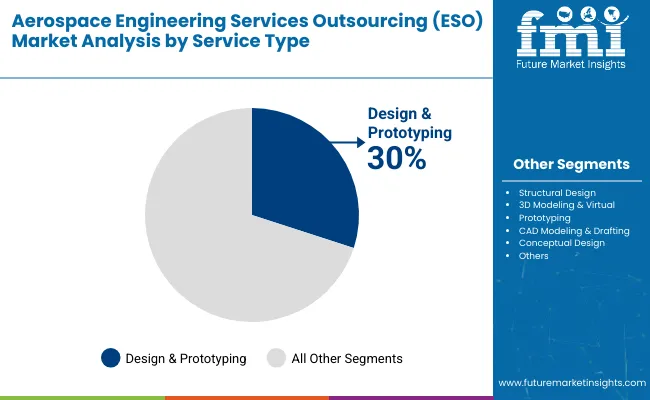
Design and Prototyping Drives ESO Services at 30% Share in 2025

Aerospace Engineering Services Outsourcing Eso Market By Service Type

Design and prototyping leads ESO services with a 30% share in 2025. OEMs such as Airbus and Boeing outsource this function to global partners like Alten, HCLTech, and Capgemini Engineering. Outsourced design ensures faster validation of new aircraft programs including the Airbus A320neo and Boeing 737 MAX.

Prototyping services help reduce testing costs and accelerate time-to-market by applying simulation and digital mock-ups. Service providers manage component-level prototyping, virtual modeling, and design validation, which enables OEMs to improve operational efficiency. The growing reliance on digital engineering workflows makes this segment the foundation of aerospace outsourcing, particularly for commercial aviation programs requiring rapid adaptability.
  • Airbus collaborates with Alten for A320 family digital design tasks
  • Boeing works with Capgemini for outsourced prototyping and structural validation
  • HCLTech supports component-level design outsourcing for composite aircraft parts

Aerostructures Lead ESO Applications with 28% Market Share in 2025

Aerospace Engineering Services Outsourcing Eso Market By Application

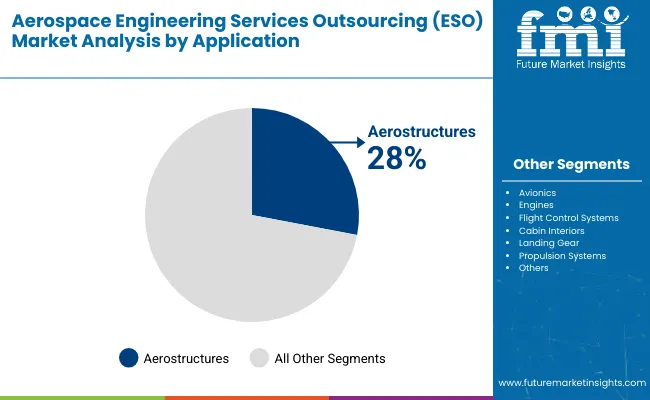
Aerostructures dominate ESO applications with 28% share, highlighting the complexity of fuselage, wings, and structural assemblies in aerospace programs. Leading firms such as Safran, Collins Aerospace, and Leonardo rely on outsourcing partners including Quest Global, Tata Technologies, and Tech Mahindra. Service providers deliver engineering support for composite aerostructures, lifecycle management, and certification requirements.

Outsourced aerostructure engineering reduces design cycle bottlenecks and enables suppliers to handle large production volumes for both commercial and defense platforms. The increasing use of lightweight composites and demand for fuel-efficient designs reinforce outsourcing in aerostructures as a long-term growth segment in ESO.
  • Safran collaborates with Tata Technologies on fuselage and wing design outsourcing
  • Quest Global supports Leonardo with lifecycle aerostructure engineering services
  • Tech Mahindra delivers composite design engineering for Collins Aerospace programs

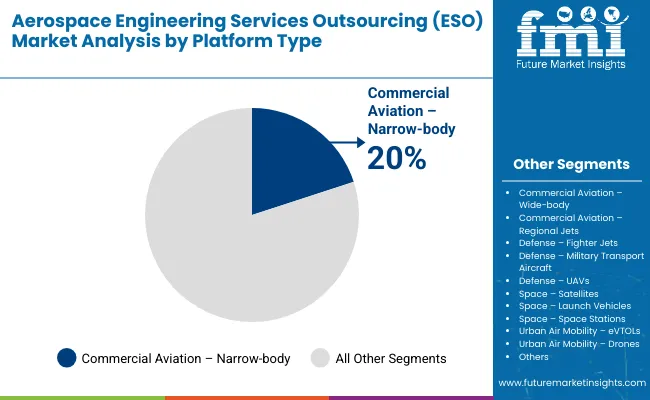
Narrow-Body Aircraft Dominate ESO Platforms with 20% Share in 2025

Aerospace Engineering Services Outsourcing Eso Market By Platform Type

Narrow-body aircraft outsourcing holds the largest share by platform at 20%. Aircraft such as Airbus A320neo and Boeing 737 MAX drive demand for outsourced design validation, avionics integration, and digital modeling. Outsourcing providers including Alten, Wipro Engineering, and Capgemini assist OEMs in managing engineering workloads for high-volume production programs.

Airlines’ preference for single-aisle aircraft in both developed and emerging markets supports outsourcing activity. Narrow-body platforms remain the focus of aerospace ESO due to their role in fleet modernization, high passenger capacity efficiency, and global airline orders. The segment’s importance continues to expand as OEMs prioritize timely delivery and certification compliance.
  • Airbus engages Alten for structural engineering on A320neo aircraft
  • Boeing partners with Capgemini Engineering for outsourced avionics integration
  • Wipro Engineering provides testing services for narrow-body aircraft suppliers

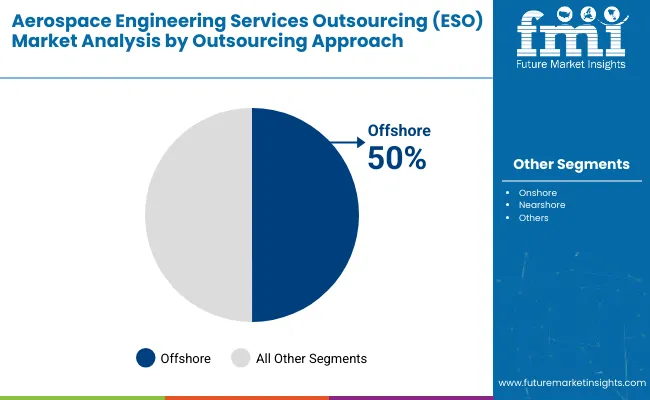
Offshore Outsourcing Dominates ESO Approach with 50% Share in 2025

Aerospace Engineering Services Outsourcing Eso Market By Outsourcing Approach

Offshore outsourcing represents 50% of the ESO market, reflecting its importance as the preferred approach for aerospace engineering services. Service hubs in India and Eastern Europe provide OEMs and Tier 1 suppliers with cost-efficient solutions, large engineering talent pools, and scalable operations. Infosys operates aerospace offshore centers in India and Poland, supporting digital prototyping.

Tata Technologies collaborates with Airbus and Rolls Royce on offshore structural and design engineering. Tech Mahindra contributes offshore CAD modeling and avionics support. Offshore delivery centers help reduce program delays, control costs, and ensure access to specialized engineering expertise. Their dominance underlines the long-term role of offshore outsourcing in aerospace development cycles.
  • Infosys operates offshore aerospace engineering delivery hubs in India and Poland
  • Tata Technologies delivers offshore support to Airbus and Rolls Royce programs
  • Tech Mahindra manages offshore avionics and CAD modeling outsourcing projects

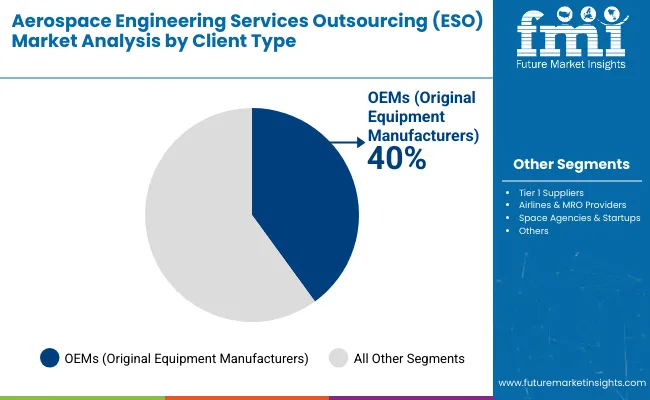
OEMs Dominate ESO Client Base with 40% Share in 2025

Aerospace Engineering Services Outsourcing Eso Market By Client Type

OEMs account for the highest share of ESO clients with 40% in 2025. Global manufacturers including Airbus, Boeing, and Embraer outsource engineering tasks to partners such as Alten, Capgemini, and Quest Global. Outsourcing enables OEMs to focus on final assembly and certification while delegating design, validation, and systems integration tasks.

Airbus collaborates with Alten for 3D modeling and product development, Boeing engages Capgemini for avionics and system engineering, while Embraer partners with Quest Global for cabin design. Outsourced ESO partnerships improve OEMs’ ability to manage production backlogs, accelerate program launches, and optimize engineering throughput across multiple aircraft platforms.
  • Airbus collaborates with Alten for outsourced product design and validation
  • Boeing engages Capgemini for integrated avionics and systems engineering
  • Embraer partners with Quest Global for outsourced cabin and systems design

Top Countries Driving Growth, Expansion, and Innovation in the Aerospace Engineering Services Outsourcing Market

Country Wise Analysis Aerospace Engineering Services Outsourcing Eso Market

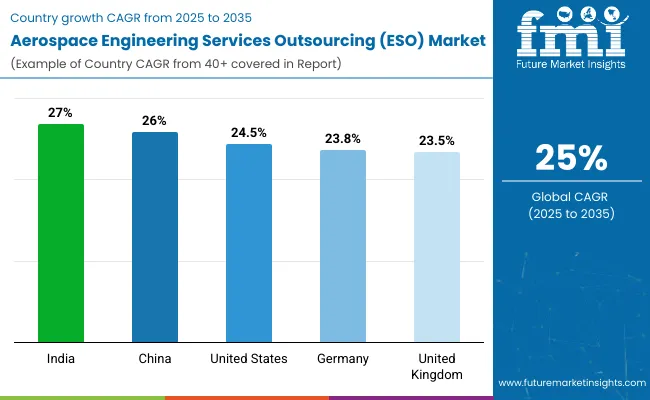
The global aerospace engineering services outsourcing (ESO) market is forecast to grow at a CAGR of 25.0% from 2025 to 2035. India leads at 27.0%, +8% above the global average, supported by BRICS-led cost competitiveness, a strong engineering workforce, and expanding collaborations with international aerospace manufacturers. China follows at 26.0%, +4% higher than the global benchmark, fueled by large-scale investments in aerospace design, component manufacturing, and increasing demand for outsourcing solutions.

The United States records 24.5%, −2% below the global average, where growth is influenced by OECD-backed innovation but tempered by higher labor costs that reduce outsourcing volumes. Germany posts 23.8% and the United Kingdom 23.5%, both slightly below the global rate, with demand shaped by premium aerospace manufacturing and outsourcing directed toward cost-efficient hubs. Growth patterns reflect BRICS strength in scalability and affordability, while OECD markets sustain demand through high-value engineering expertise and advanced technological frameworks.

Analysis of Aerospace ESO Market in India

The aerospace engineering services outsourcing market in India is projected to record a CAGR of 27.0%, outperforming the global CAGR of 25% with a multiplication factor of 1.08. This trend is viewed as a clear indication of the country’s competitive edge in engineering delivery for aerospace programs. It is believed that India’s large pool of aerospace engineers, combined with cost efficiency, provides unmatched scalability. The sector is driven by projects in avionics design, structural analysis, and simulation modeling.

Large outsourcing contracts have been awarded to Indian providers by leading aerospace OEMs. By 2035, the opinion is strong that India will dominate as one of the largest hubs for ESO delivery in aerospace, supported by increasing collaboration across global supply chains.

  • Engineering workforce surpasses 1.2 million professionals in aerospace services
  • Avionics outsourcing demand accounts for 36% of contracts
  • Simulation modeling projects contribute 27% of ESO delivery

Demand Forecast for Aerospace ESO Market in China

The aerospace ESO market in China is expanding at a CAGR of 26.0%, above the global average of 25%, producing a multiplication factor of 1.04. The view is that this performance demonstrates the strength of China’s aerospace ambitions and its growing reliance on ESO to meet aggressive production goals. Local service providers are delivering CAD modeling, propulsion analysis, and digital engineering to both civil and defense projects.

The market is also supported by growing partnerships between Chinese outsourcing firms and global aerospace companies, boosting competitiveness. It is believed that China’s focus on new material adoption and autonomous aviation programs is further accelerating outsourced engineering. Market observers suggest that China will remain a dominant player in the global ESO industry by 2035.

  • CAD engineering projects represent 41% of outsourcing demand
  • Propulsion analysis contracts contribute 23% of ESO activity
  • Digital engineering services account for 19% of contracts

Growth Analysis of Aerospace ESO Market in the United States

The United States is anticipated to witness an aerospace ESO CAGR of 24.5%, slightly below the global CAGR of 25%, reflecting a multiplication factor of 0.98. The opinion is that outsourcing in the US aerospace sector is adopted to optimize costs while focusing domestic resources on high-value design. Services such as systems integration, advanced avionics development, and predictive maintenance are commonly outsourced.

It is believed that outsourcing also shortens design cycles and supports a shift toward digital twins and model-based engineering. By 2035, the US is projected to outsource a notable portion of its aerospace engineering activities, while still maintaining strong in-house R&D. The country’s ESO market is likely to sustain demand by balancing cost efficiency and technical expertise.

  • Systems integration represents 26% of outsourcing contracts
  • Digital twin adoption drives 29% of outsourced projects
  • Predictive maintenance services account for 18% of activity

Future Outlook for Aerospace ESO Market in Germany

Germany is expected to see its aerospace ESO market grow at a CAGR of 23.8%, slightly below the global 25%, equating to a multiplication factor of 0.95. Observers believe that outsourcing is increasingly relied upon for avionics testing, lightweight structure design, and composite materials development.

The country is recognized for strong aerospace engineering standards, and outsourcing complements its innovation programs in both civil and defense aviation. It is thought that collaborations with eastern European service providers are helping reduce engineering cycle times. Growth is also linked to higher adoption of model-based testing frameworks in aerospace R&D. By 2035, Germany’s ESO share is forecast to remain resilient, ensuring the country’s aerospace competitiveness remains intact.

  • Composite design outsourcing accounts for 33% of demand
  • Avionics testing services comprise 27% of ESO activity
  • Model-based testing projects contribute 14% of contracts

Premium Growth Trajectory of Aerospace ESO Market in the United Kingdom

The United Kingdom is forecasted to grow at a CAGR of 23.5% in aerospace ESO, below the global 25%, resulting in a multiplication factor of 0.94. It is widely considered that ESO growth in the UK is shaped by rising demand for propulsion system development, digital modeling, and systems testing.

The market is supported by outsourcing strategies aimed at cost competitiveness in both commercial and defense projects. Service providers are increasingly active in offering advanced visualization and 3D simulation to aerospace manufacturers. It is believed that the UK ESO market will remain essential in supporting core aerospace innovation while outsourcing drives scalability. By 2035, the country is anticipated to account for a stable share of global ESO activity.
  • Propulsion design outsourcing contributes 28% of ESO demand
  • 3D visualization and digital modeling projects represent 24% of contracts
  • Systems testing services account for 16% of outsourced engineering

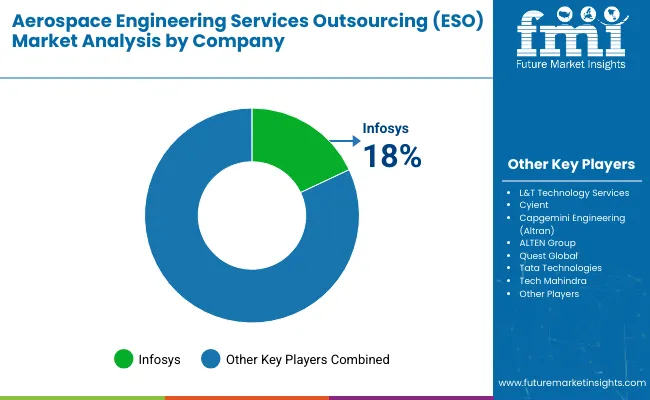
Leading Aerospace Engineering Services Outsourcing (ESO) Market Manufacturers, Suppliers, DistributorsInfosys - 18 % (Leading player)

Aerospace Engineering Services Outsourcing Eso Market By Company

The aerospace engineering services outsourcing (ESO) market is shaped by global engineering firms and IT service providers offering design, testing, simulation, and lifecycle management for aircraft programs. Infosys is often regarded as the leading company in this space, supported by its strong aerospace partnerships, digital engineering capabilities, and dedicated centers of excellence for aviation clients.

L&T Technology Services continues to expand its presence through specialized engineering support for avionics and structural analysis, while Cyient focuses on digital design and aftermarket support solutions. Capgemini Engineering (formerly Altran) strengthens its market position through extensive collaborations with OEMs and tier-1 suppliers, providing end-to-end engineering outsourcing solutions across multiple aerospace platforms.

Other companies are driving growth with targeted investments and strategic alliances. ALTEN Group and AKKA Technologies (now Akkodis) expand their global engineering networks by supporting aircraft manufacturers in Europe and North America, while Quest Global and Tata Technologies focus on cost-efficient design and manufacturing support.

Tech Mahindra, HCLTech, and Wipro integrate advanced engineering with IT services to enhance efficiency in aerospace development. Emerging players such as Assystem, Segula Technologies, and Expleo Group are strengthening their positions with specialized offerings in testing, certification, and simulation. These collective efforts highlight a competitive ecosystem where R&D investments, OEM partnerships, and global delivery centers remain central to market success.

Leading Players

  • Infosys
  • L&T Technology Services
  • Cyient
  • Capgemini Engineering (Altran)
  • ALTEN Group
  • Quest Global
  • Tata Technologies
  • Tech Mahindra
  • HCLTech
  • Wipro
  • Others (Assystem, Segula, Expleo, Safran Engineering Services, EPAM, Accenture, etc.)

Report Scope

Report Attributes Details
Market Size (2025) USD 188 billion
Projected Market Size (2035) USD 1,754 billion
CAGR (2025 to 2035) 25%
Base Year for Estimation 2024
Historical Period 2020 to 2024
Projection Period 2025 to 2035
Quantitative Units USD billion for value
Service Types Analyzed Design & Prototyping (CAD modeling & drafting, conceptual design, structural design, 3D modeling & prototyping), Testing & Simulation (CFD, FEA, wind tunnel testing, material testing), Manufacturing Support (tooling design, jigs & fixtures, CNC programming, process automation), Embedded Systems & Avionics (control systems, flight software, avionics integration, IoT integration), MRO Engineering Services (maintenance procedures, retrofit & modifications, technical publications), Systems Engineering & Integration (payload, electrical and mechanical integration), Others (reverse engineering, analytics, compliance consulting)
Application Segments Aerostructures , Avionics, Engines, Cabin Interiors, Landing Gear, Propulsion Systems, Flight Control Systems
Platform Types Commercial Aviation (narrow-body, wide-body, regional jets), Defense (fighter jets, military transport, UAVs), Space (satellites, launch vehicles, space stations), Urban Air Mobility ( eVTOLs , drones)
Outsourcing Approach Onshore, Nearshore, Offshore
Client Types OEMs, Tier 1 Suppliers, Airlines & MRO Providers, Space Agencies & Startups
Regions Covered North America, Latin America, Western Europe, Eastern Europe, Asia Pacific, Middle East & Africa
Countries Covered United States, Canada, Brazil, Mexico, Germany, United Kingdom, France, Italy, Spain, China, Japan, India, South Korea, Australia, UAE, Saudi Arabia, South Africa
Leading Players Infosys, Tata Technologies, Tech Mahindra, HCLTech , Wipro, L&T Technology Services, Cyient , Capgemini Engineering, Bertrandt , Alten Calsoft Labs, EPAM Systems, Accenture, Altrimetrik , Assystem , Segula Technologies, Safran Engineering Services, Expleo Group, Alten Group, AKKA Technologies ( Akkodis ), Quest Global
Additional Attributes Dollar sales by service type and aircraft program, demand dynamics across commercial, defense, and space sectors, regional adoption trends across North America, Europe, and Asia-Pacific, innovation in digital engineering, simulation, and AI-driven modeling, environmental impact of optimized resource efficiency, emerging use cases in electric aircraft, UAV design, and next-generation space missions

Key Segments

By Application:

  • Aerostructures
  • Avionics
  • Engines
  • Cabin Interiors
  • Landing Gear
  • Propulsion Systems
  • Flight Control Systems

By Platform Type:

Commercial Aviation

    • Narrow-body
    • Wide-body
    • Regional jets

Defense

    • Fighter jets
    • Military transport aircraft
    • UAVs

Space

    • Satellites
    • Launch vehicles
    • Space stations

Urban Air Mobility (UAM)

    • eVTOLs

By Outsourcing Approach:

  • Onshore
  • Nearshore
  • Offshore

By Client Type:

  • OEMs (Original Equipment Manufacturers)
  • Tier 1 Suppliers
  • Airlines & MRO Providers
  • Space Agencies & Startups

By Region:

  • North America
  • Latin America
  • Western Europe
  • Eastern Europe
  • Asia Pacific
  • The Middle East and Africa

Table of Content

  1. Executive Summary
    • Global Market Outlook
    • Demand-side Trends
    • Supply-side Trends
    • Technology Roadmap Analysis
    • Analysis and Recommendations
  2. Market Overview
    • Market Coverage / Taxonomy
    • Market Definition / Scope / Limitations
  3. Market Background
    • Market Dynamics
      • Drivers
      • Restraints
      • Opportunity
      • Trends
    • Scenario Forecast
      • Demand in Optimistic Scenario
      • Demand in Likely Scenario
      • Demand in Conservative Scenario
    • Opportunity Map Analysis
    • Product Life Cycle Analysis
    • Supply Chain Analysis
      • Supply Side Participants and their Roles
        • Producers
        • Mid-Level Participants (Traders/ Agents/ Brokers)
        • Wholesalers and Distributors
      • Value Added and Value Created at Node in the Supply Chain
      • List of Raw Material Suppliers
      • List of Existing and Potential Buyer’s
    • Investment Feasibility Matrix
    • Value Chain Analysis
      • Profit Margin Analysis
      • Wholesalers and Distributors
      • Retailers
    • PESTLE and Porter’s Analysis
    • Regulatory Landscape
      • By Key Regions
      • By Key Countries
    • Regional Parent Market Outlook
    • Production and Consumption Statistics
    • Import and Export Statistics
  4. Global Market Analysis 2020-2024 and Forecast, 2025-2035
    • Historical Market Size Value (USD Billion) & Volume (Thousand Units) Analysis, 2020-2024
    • Current and Future Market Size Value (USD Billion) & Volume (Thousand Units) Projections, 2025-2035
      • Y-o-Y Growth Trend Analysis
      • Absolute $ Opportunity Analysis
  5. Global Market Pricing Analysis 2020-2024 and Forecast 2025-2035
  6. Global Market Analysis 2020-2024 and Forecast 2025-2035, By Service Type
    • Introduction / Key Findings
    • Historical Market Size Value (USD Billion) & Volume (Thousand Units) Analysis By Service Type, 2020-2024
    • Current and Future Market Size Value (USD Billion) & Volume (Thousand Units) Analysis and Forecast By Service Type, 2025-2035
      • Design & Prototyping
        • CAD modeling & drafting
        • 3D modeling & virtual prototyping
        • Conceptual design
        • Structural design
      • Testing & Simulation
        • CFD (Computational Fluid Dynamics)
        • CFD (Computational Fluid Dynamics)
        • FEA (Finite Element Analysis)
      • Manufacturing Support
        • Tooling design
        • Jigs & fixtures
        • CNC programming
        • Process automatio
      • Embedded Systems & Avionics
        • Control system development
        • Avionics integration
        • Flight software engineering
      • MRO Engineering Services
        • Maintenance procedure development
        • Retrofit & modification engineering
        • Technical publications
      • Systems Engineering & Integration
        • Mechanical integration
        • Payload integration
        • Electrical system integration
      • Others
        • Compliance & regulatory consulting
        • Reverse engineering
        • Engineering analytics
    • Y-o-Y Growth Trend Analysis By Service Type, 2020-2024
    • Absolute $ Opportunity Analysis By Service Type, 2025-2035
  7. Global Market Analysis 2020-2024 and Forecast 2025-2035, By Application
    • Introduction / Key Findings
    • Historical Market Size Value (USD Billion) & Volume (Thousand Units) Analysis By Application, 2020-2024
    • Current and Future Market Size Value (USD Billion) & Volume (Thousand Units) Analysis and Forecast By Application, 2025-2035
      • Aerostructures
      • Avionics
      • Engines
      • Flight Control Systems
      • Cabin Interiors
      • Landing Gear
      • Propulsion Systems
    • Y-o-Y Growth Trend Analysis By Application, 2020-2024
    • Absolute $ Opportunity Analysis By Application, 2025-2035
  8. Global Market Analysis 2020-2024 and Forecast 2025-2035, By Platform Type
    • Introduction / Key Findings
    • Historical Market Size Value (USD Billion) & Volume (Thousand Units) Analysis By Platform Type, 2020-2024
    • Current and Future Market Size Value (USD Billion) & Volume (Thousand Units) Analysis and Forecast By Platform Type, 2025-2035
      • Commercial Aviation
        • Narrow-body
        • Wide-body
        • Regional jets
      • Defense
        • Fighter jets
        • UAVs
        • Military transport aircraft
      • Space
        • Space Station
        • Satellites
        • Launch vehicles
      • Urban Air Mobility (UAM)
        • eVTOLs
      • Drones
    • Y-o-Y Growth Trend Analysis By Platform Type, 2020-2024
    • Absolute $ Opportunity Analysis By Platform Type, 2025-2035
  9. Global Market Analysis 2020-2024 and Forecast 2025-2035, By Outsourcing Approach
    • Introduction / Key Findings
    • Historical Market Size Value (USD Billion) & Volume (Thousand Units) Analysis By Outsourcing Approach, 2020-2024
    • Current and Future Market Size Value (USD Billion) & Volume (Thousand Units) Analysis and Forecast By Outsourcing Approach, 2025-2035
      • Onshore
      • Nearshore
      • Offshore
    • Y-o-Y Growth Trend Analysis By Outsourcing Approach, 2020-2024
    • Absolute $ Opportunity Analysis By Outsourcing Approach, 2025-2035
  10. Global Market Analysis 2020-2024 and Forecast 2025-2035, By Client Type
    • Introduction / Key Findings
    • Historical Market Size Value (USD Billion) & Volume (Thousand Units) Analysis By Client Type, 2020-2024
    • Current and Future Market Size Value (USD Billion) & Volume (Thousand Units) Analysis and Forecast By Client Type, 2025-2035
      • OEMs (Original Equipment Manufacturers)
      • Tier 1 Suppliers
      • Airlines & MRO Providers
      • Space Agencies & Startups
    • Y-o-Y Growth Trend Analysis By Client Type, 2020-2024
    • Absolute $ Opportunity Analysis By Client Type, 2025-2035
  11. Global Market Analysis 2020-2024 and Forecast 2025-2035, By Region
    • Introduction
    • Historical Market Size Value (USD Billion) & Volume (Thousand Units) Analysis By Region, 2020-2024
    • Current Market Size Value (USD Billion) & Volume (Thousand Units) Analysis and Forecast By Region, 2025-2035
      • North America
      • Latin America
      • Western Europe
      • Eastern Europe
      • East Asia
      • South Asia & Pacific
      • Middle East and Africa
    • Market Attractiveness Analysis By Region
  12. North America Market Analysis 2020-2024 and Forecast 2025-2035, By Country
    • Historical Market Size Value (USD Billion) & Volume (Thousand Units) Trend Analysis By Market Taxonomy, 2020-2024
    • Market Size Value (USD Billion) & Volume (Thousand Units) Forecast By Market Taxonomy, 2025-2035
      • By Country
        • USA
        • Canada
        • Mexico
      • By Service Type
      • By Application
      • By Platform Type
      • By Outsourcing Approach
      • By Client Type
    • Market Attractiveness Analysis
      • By Country
      • By Service Type
      • By Application
      • By Platform Type
      • By Outsourcing Approach
      • By Client Type
    • Key Takeaways
  13. Latin America Market Analysis 2020-2024 and Forecast 2025-2035, By Country
    • Historical Market Size Value (USD Billion) & Volume (Thousand Units) Trend Analysis By Market Taxonomy, 2020-2024
    • Market Size Value (USD Billion) & Volume (Thousand Units) Forecast By Market Taxonomy, 2025-2035
      • By Country
        • Brazil
        • Argentina
        • Rest of LATAM
      • By Service Type
      • By Application
      • By Platform Type
      • By Outsourcing Approach
      • By Client Type
    • Market Attractiveness Analysis
      • By Country
      • By Service Type
      • By Application
      • By Platform Type
      • By Outsourcing Approach
      • By Client Type
    • Key Takeaways
  14. Western Europe Market Analysis 2020-2024 and Forecast 2025-2035, By Country
    • Historical Market Size Value (USD Billion) & Volume (Thousand Units) Trend Analysis By Market Taxonomy, 2020-2024
    • Market Size Value (USD Billion) & Volume (Thousand Units) Forecast By Market Taxonomy, 2025-2035
      • By Country
        • Germany
        • Italy
        • France
        • UK
        • Spain
        • BENELUX
        • Nordic
        • Rest of W.Europe
      • By Service Type
      • By Application
      • By Platform Type
      • By Outsourcing Approach
      • By Client Type
    • Market Attractiveness Analysis
      • By Country
      • By Service Type
      • By Application
      • By Platform Type
      • By Outsourcing Approach
      • By Client Type
    • Key Takeaways
  15. Eastern Europe Market Analysis 2020-2024 and Forecast 2025-2035, By Country
    • Historical Market Size Value (USD Billion) & Volume (Thousand Units) Trend Analysis By Market Taxonomy, 2020-2024
    • Market Size Value (USD Billion) & Volume (Thousand Units) Forecast By Market Taxonomy, 2025-2035
      • By Country
        • Russia
        • Hungary
        • Poland
        • Balkan & Baltics
        • Rest of E. Europe
      • By Service Type
      • By Application
      • By Platform Type
      • By Outsourcing Approach
      • By Client Type
    • Market Attractiveness Analysis
      • By Country
      • By Service Type
      • By Application
      • By Platform Type
      • By Outsourcing Approach
      • By Client Type
    • Key Takeaways
  16. East Asia Market Analysis 2020-2024 and Forecast 2025-2035, By Country
    • Historical Market Size Value (USD Billion) & Volume (Thousand Units) Trend Analysis By Market Taxonomy, 2020-2024
    • Market Size Value (USD Billion) & Volume (Thousand Units) Forecast By Market Taxonomy, 2025-2035
      • By Country
        • China
        • Japan
        • South Korea
      • By Service Type
      • By Application
      • By Platform Type
      • By Outsourcing Approach
      • By Client Type
    • Market Attractiveness Analysis
      • By Country
      • By Service Type
      • By Application
      • By Platform Type
      • By Outsourcing Approach
      • By Client Type
    • Key Takeaways
  17. South Asia & Pacific Market Analysis 2020-2024 and Forecast 2025-2035, By Country
    • Historical Market Size Value (USD Billion) & Volume (Thousand Units) Trend Analysis By Market Taxonomy, 2020-2024
    • Market Size Value (USD Billion) & Volume (Thousand Units) Forecast By Market Taxonomy, 2025-2035
      • By Country
        • India
        • Australia & New Zealand
        • ASEAN
        • Rest of SAP
      • By Service Type
      • By Application
      • By Platform Type
      • By Outsourcing Approach
      • By Client Type
    • Market Attractiveness Analysis
      • By Country
      • By Service Type
      • By Application
      • By Platform Type
      • By Outsourcing Approach
      • By Client Type
    • Key Takeaways
  18. Middle East and Africa Market Analysis 2020-2024 and Forecast 2025-2035, By Country
    • Historical Market Size Value (USD Billion) & Volume (Thousand Units) Trend Analysis By Market Taxonomy, 2020-2024
    • Market Size Value (USD Billion) & Volume (Thousand Units) Forecast By Market Taxonomy, 2025-2035
      • By Country
        • GCC Countries
        • Northern Africa
        • South Africa
        • Turkiye
        • Rest of MEA
      • By Service Type
      • By Application
      • By Platform Type
      • By Outsourcing Approach
      • By Client Type
    • Market Attractiveness Analysis
      • By Country
      • By Service Type
      • By Application
      • By Platform Type
      • By Outsourcing Approach
      • By Client Type
    • Key Takeaways
  19. Key Countries Market Analysis
    • USA
      • Pricing Analysis
      • Market Share Analysis, 2024
        • By Service Type
        • By Application
        • By Platform Type
        • By Outsourcing Approach
        • By Client Type
    • Canada
      • Pricing Analysis
      • Market Share Analysis, 2024
        • By Service Type
        • By Application
        • By Platform Type
        • By Outsourcing Approach
        • By Client Type
    • Brazil
      • Pricing Analysis
      • Market Share Analysis, 2024
        • By Service Type
        • By Application
        • By Platform Type
        • By Outsourcing Approach
        • By Client Type
    • Mexico
      • Pricing Analysis
      • Market Share Analysis, 2024
        • By Service Type
        • By Application
        • By Platform Type
        • By Outsourcing Approach
        • By Client Type
    • Argentina
      • Pricing Analysis
      • Market Share Analysis, 2024
        • By Service Type
        • By Application
        • By Platform Type
        • By Outsourcing Approach
        • By Client Type
  20. Market Structure Analysis
    • Competition Dashboard
    • Competition Benchmarking
    • Market Share Analysis of Top Players
      • By Regional
      • By Service Type
      • By Application
      • By Platform Type
      • By Outsourcing Approach
      • By Client Type
  21. Competition Analysis
    • Competition Deep Dive
      • Infosys
        • Overview
        • Product Portfolio
        • Profitability by Market Segments (Product/Age /Sales Channel/Region)
        • Sales Footprint
        • Strategy Overview
          • Marketing Strategy
          • Product Strategy
          • Channel Strategy
      • L&T Technology Services
        • Overview
        • Product Portfolio
        • Profitability by Market Segments (Product/Age /Sales Channel/Region)
        • Sales Footprint
        • Strategy Overview
          • Marketing Strategy
          • Product Strategy
          • Channel Strategy
      • Cyient
        • Overview
        • Product Portfolio
        • Profitability by Market Segments (Product/Age /Sales Channel/Region)
        • Sales Footprint
        • Strategy Overview
          • Marketing Strategy
          • Product Strategy
          • Channel Strategy
      • Capgemini Engineering (Altran)
        • Overview
        • Product Portfolio
        • Profitability by Market Segments (Product/Age /Sales Channel/Region)
        • Sales Footprint
        • Strategy Overview
          • Marketing Strategy
          • Product Strategy
          • Channel Strategy
      • ALTEN Group
        • Overview
        • Product Portfolio
        • Profitability by Market Segments (Product/Age /Sales Channel/Region)
        • Sales Footprint
        • Strategy Overview
          • Marketing Strategy
          • Product Strategy
          • Channel Strategy
      • Quest Global
        • Overview
        • Product Portfolio
        • Profitability by Market Segments (Product/Age /Sales Channel/Region)
        • Sales Footprint
        • Strategy Overview
          • Marketing Strategy
          • Product Strategy
          • Channel Strategy
      • Tata Technologies
        • Overview
        • Product Portfolio
        • Profitability by Market Segments (Product/Age /Sales Channel/Region)
        • Sales Footprint
        • Strategy Overview
          • Marketing Strategy
          • Product Strategy
          • Channel Strategy
      • Tech Mahindra
        • Overview
        • Product Portfolio
        • Profitability by Market Segments (Product/Age /Sales Channel/Region)
        • Sales Footprint
        • Strategy Overview
          • Marketing Strategy
          • Product Strategy
          • Channel Strategy
      • HCLTech
        • Overview
        • Product Portfolio
        • Profitability by Market Segments (Product/Age /Sales Channel/Region)
        • Sales Footprint
        • Strategy Overview
          • Marketing Strategy
          • Product Strategy
          • Channel Strategy
      • Wipro
        • Overview
        • Product Portfolio
        • Profitability by Market Segments (Product/Age /Sales Channel/Region)
        • Sales Footprint
        • Strategy Overview
          • Marketing Strategy
          • Product Strategy
          • Channel Strategy
  22. Assumptions & Acronyms Used
  23. Research Methodology

List of Tables

  • Table 1: Global Market Value (USD Billion) Forecast by Region, 2020-2035
  • Table 2: Global Market Volume (Thousand Units) Forecast by Region, 2020-2035
  • Table 3: Global Market Value (USD Billion) Forecast by Service Type, 2020-2035
  • Table 4: Global Market Volume (Thousand Units) Forecast by Service Type, 2020-2035
  • Table 5: Global Market Value (USD Billion) Forecast by Application, 2020-2035
  • Table 6: Global Market Volume (Thousand Units) Forecast by Application, 2020-2035
  • Table 7: Global Market Value (USD Billion) Forecast by Platform Type, 2020-2035
  • Table 8: Global Market Volume (Thousand Units) Forecast by Platform Type, 2020-2035
  • Table 9: Global Market Value (USD Billion) Forecast by Outsourcing Approach, 2020-2035
  • Table 10: Global Market Volume (Thousand Units) Forecast by Outsourcing Approach, 2020-2035
  • Table 11: Global Market Value (USD Billion) Forecast by Client Type, 2020-2035
  • Table 12: Global Market Volume (Thousand Units) Forecast by Client Type, 2020-2035
  • Table 13: North America Market Value (USD Billion) Forecast by Country, 2020-2035
  • Table 14: North America Market Volume (Thousand Units) Forecast by Country, 2020-2035
  • Table 15: North America Market Value (USD Billion) Forecast by Service Type, 2020-2035
  • Table 16: North America Market Volume (Thousand Units) Forecast by Service Type, 2020-2035
  • Table 17: North America Market Value (USD Billion) Forecast by Application, 2020-2035
  • Table 18: North America Market Volume (Thousand Units) Forecast by Application, 2020-2035
  • Table 19: North America Market Value (USD Billion) Forecast by Platform Type, 2020-2035
  • Table 20: North America Market Volume (Thousand Units) Forecast by Platform Type, 2020-2035
  • Table 21: North America Market Value (USD Billion) Forecast by Outsourcing Approach, 2020-2035
  • Table 22: North America Market Volume (Thousand Units) Forecast by Outsourcing Approach, 2020-2035
  • Table 23: North America Market Value (USD Billion) Forecast by Client Type, 2020-2035
  • Table 24: North America Market Volume (Thousand Units) Forecast by Client Type, 2020-2035
  • Table 25: Latin America Market Value (USD Billion) Forecast by Country, 2020-2035
  • Table 26: Latin America Market Volume (Thousand Units) Forecast by Country, 2020-2035
  • Table 27: Latin America Market Value (USD Billion) Forecast by Service Type, 2020-2035
  • Table 28: Latin America Market Volume (Thousand Units) Forecast by Service Type, 2020-2035
  • Table 29: Latin America Market Value (USD Billion) Forecast by Application, 2020-2035
  • Table 30: Latin America Market Volume (Thousand Units) Forecast by Application, 2020-2035
  • Table 31: Latin America Market Value (USD Billion) Forecast by Platform Type, 2020-2035
  • Table 32: Latin America Market Volume (Thousand Units) Forecast by Platform Type, 2020-2035
  • Table 33: Latin America Market Value (USD Billion) Forecast by Outsourcing Approach, 2020-2035
  • Table 34: Latin America Market Volume (Thousand Units) Forecast by Outsourcing Approach, 2020-2035
  • Table 35: Latin America Market Value (USD Billion) Forecast by Client Type, 2020-2035
  • Table 36: Latin America Market Volume (Thousand Units) Forecast by Client Type, 2020-2035
  • Table 37: Western Europe Market Value (USD Billion) Forecast by Country, 2020-2035
  • Table 38: Western Europe Market Volume (Thousand Units) Forecast by Country, 2020-2035
  • Table 39: Western Europe Market Value (USD Billion) Forecast by Service Type, 2020-2035
  • Table 40: Western Europe Market Volume (Thousand Units) Forecast by Service Type, 2020-2035
  • Table 41: Western Europe Market Value (USD Billion) Forecast by Application, 2020-2035
  • Table 42: Western Europe Market Volume (Thousand Units) Forecast by Application, 2020-2035
  • Table 43: Western Europe Market Value (USD Billion) Forecast by Platform Type, 2020-2035
  • Table 44: Western Europe Market Volume (Thousand Units) Forecast by Platform Type, 2020-2035
  • Table 45: Western Europe Market Value (USD Billion) Forecast by Outsourcing Approach, 2020-2035
  • Table 46: Western Europe Market Volume (Thousand Units) Forecast by Outsourcing Approach, 2020-2035
  • Table 47: Western Europe Market Value (USD Billion) Forecast by Client Type, 2020-2035
  • Table 48: Western Europe Market Volume (Thousand Units) Forecast by Client Type, 2020-2035
  • Table 49: Eastern Europe Market Value (USD Billion) Forecast by Country, 2020-2035
  • Table 50: Eastern Europe Market Volume (Thousand Units) Forecast by Country, 2020-2035
  • Table 51: Eastern Europe Market Value (USD Billion) Forecast by Service Type, 2020-2035
  • Table 52: Eastern Europe Market Volume (Thousand Units) Forecast by Service Type, 2020-2035
  • Table 53: Eastern Europe Market Value (USD Billion) Forecast by Application, 2020-2035
  • Table 54: Eastern Europe Market Volume (Thousand Units) Forecast by Application, 2020-2035
  • Table 55: Eastern Europe Market Value (USD Billion) Forecast by Platform Type, 2020-2035
  • Table 56: Eastern Europe Market Volume (Thousand Units) Forecast by Platform Type, 2020-2035
  • Table 57: Eastern Europe Market Value (USD Billion) Forecast by Outsourcing Approach, 2020-2035
  • Table 58: Eastern Europe Market Volume (Thousand Units) Forecast by Outsourcing Approach, 2020-2035
  • Table 59: Eastern Europe Market Value (USD Billion) Forecast by Client Type, 2020-2035
  • Table 60: Eastern Europe Market Volume (Thousand Units) Forecast by Client Type, 2020-2035
  • Table 61: East Asia Market Value (USD Billion) Forecast by Country, 2020-2035
  • Table 62: East Asia Market Volume (Thousand Units) Forecast by Country, 2020-2035
  • Table 63: East Asia Market Value (USD Billion) Forecast by Service Type, 2020-2035
  • Table 64: East Asia Market Volume (Thousand Units) Forecast by Service Type, 2020-2035
  • Table 65: East Asia Market Value (USD Billion) Forecast by Application, 2020-2035
  • Table 66: East Asia Market Volume (Thousand Units) Forecast by Application, 2020-2035
  • Table 67: East Asia Market Value (USD Billion) Forecast by Platform Type, 2020-2035
  • Table 68: East Asia Market Volume (Thousand Units) Forecast by Platform Type, 2020-2035
  • Table 69: East Asia Market Value (USD Billion) Forecast by Outsourcing Approach, 2020-2035
  • Table 70: East Asia Market Volume (Thousand Units) Forecast by Outsourcing Approach, 2020-2035
  • Table 71: East Asia Market Value (USD Billion) Forecast by Client Type, 2020-2035
  • Table 72: East Asia Market Volume (Thousand Units) Forecast by Client Type, 2020-2035
  • Table 73: South Asia & Pacific Market Value (USD Billion) Forecast by Country, 2020-2035
  • Table 74: South Asia & Pacific Market Volume (Thousand Units) Forecast by Country, 2020-2035
  • Table 75: South Asia & Pacific Market Value (USD Billion) Forecast by Service Type, 2020-2035
  • Table 76: South Asia & Pacific Market Volume (Thousand Units) Forecast by Service Type, 2020-2035
  • Table 77: South Asia & Pacific Market Value (USD Billion) Forecast by Application, 2020-2035
  • Table 78: South Asia & Pacific Market Volume (Thousand Units) Forecast by Application, 2020-2035
  • Table 79: South Asia & Pacific Market Value (USD Billion) Forecast by Platform Type, 2020-2035
  • Table 80: South Asia & Pacific Market Volume (Thousand Units) Forecast by Platform Type, 2020-2035
  • Table 81: South Asia & Pacific Market Value (USD Billion) Forecast by Outsourcing Approach, 2020-2035
  • Table 82: South Asia & Pacific Market Volume (Thousand Units) Forecast by Outsourcing Approach, 2020-2035
  • Table 83: South Asia & Pacific Market Value (USD Billion) Forecast by Client Type, 2020-2035
  • Table 84: South Asia & Pacific Market Volume (Thousand Units) Forecast by Client Type, 2020-2035
  • Table 85: Middle East and Africa Market Value (USD Billion) Forecast by Country, 2020-2035
  • Table 86: Middle East and Africa Market Volume (Thousand Units) Forecast by Country, 2020-2035
  • Table 87: Middle East and Africa Market Value (USD Billion) Forecast by Service Type, 2020-2035
  • Table 88: Middle East and Africa Market Volume (Thousand Units) Forecast by Service Type, 2020-2035
  • Table 89: Middle East and Africa Market Value (USD Billion) Forecast by Application, 2020-2035
  • Table 90: Middle East and Africa Market Volume (Thousand Units) Forecast by Application, 2020-2035
  • Table 91: Middle East and Africa Market Value (USD Billion) Forecast by Platform Type, 2020-2035
  • Table 92: Middle East and Africa Market Volume (Thousand Units) Forecast by Platform Type, 2020-2035
  • Table 93: Middle East and Africa Market Value (USD Billion) Forecast by Outsourcing Approach, 2020-2035
  • Table 94: Middle East and Africa Market Volume (Thousand Units) Forecast by Outsourcing Approach, 2020-2035
  • Table 95: Middle East and Africa Market Value (USD Billion) Forecast by Client Type, 2020-2035
  • Table 96: Middle East and Africa Market Volume (Thousand Units) Forecast by Client Type, 2020-2035

List of Figures

  • Figure 1: Global Market; Volume (Thousand Units) Forecast 2020-2035
  • Figure 2: Global Market; Pricing Analysis
  • Figure 3: Global Market; Value (USD Billion) Forecast 2020-2035
  • Figure 4: Global Market; Value Share and BPS Analysis by Service Type, 2025 and 2035
  • Figure 5: Global Market; Y-o-Y Growth Comparison by Service Type, 2025-2035
  • Figure 6: Global Market; Attractiveness Analysis by Service Type
  • Figure 7: Global Market; Value Share and BPS Analysis by Application, 2025 and 2035
  • Figure 8: Global Market; Y-o-Y Growth Comparison by Application, 2025-2035
  • Figure 9: Global Market; Attractiveness Analysis by Application
  • Figure 10: Global Market; Value Share and BPS Analysis by Platform Type, 2025 and 2035
  • Figure 11: Global Market; Y-o-Y Growth Comparison by Platform Type, 2025-2035
  • Figure 12: Global Market; Attractiveness Analysis by Platform Type
  • Figure 13: Global Market; Value Share and BPS Analysis by Outsourcing Approach, 2025 and 2035
  • Figure 14: Global Market; Y-o-Y Growth Comparison by Outsourcing Approach, 2025-2035
  • Figure 15: Global Market; Attractiveness Analysis by Outsourcing Approach
  • Figure 16: Global Market; Value Share and BPS Analysis by Client Type, 2025 and 2035
  • Figure 17: Global Market; Y-o-Y Growth Comparison by Client Type, 2025-2035
  • Figure 18: Global Market; Attractiveness Analysis by Client Type
  • Figure 19: Global Market; Value (USD Billion) Share and BPS Analysis by Region, 2025 and 2035
  • Figure 20: Global Market; Y-o-Y Growth Comparison by Region, 2025-2035
  • Figure 21: Global Market; Attractiveness Analysis by Region
  • Figure 22: North America Market; Incremental $ Opportunity, 2025-2035
  • Figure 23: Latin America Market; Incremental $ Opportunity, 2025-2035
  • Figure 24: Western Europe Market; Incremental $ Opportunity, 2025-2035
  • Figure 25: Eastern Europe Market; Incremental $ Opportunity, 2025-2035
  • Figure 26: East Asia Market; Incremental $ Opportunity, 2025-2035
  • Figure 27: South Asia & Pacific Market; Incremental $ Opportunity, 2025-2035
  • Figure 28: Middle East and Africa Market; Incremental $ Opportunity, 2025-2035
  • Figure 29: North America Market; Value Share and BPS Analysis by Country, 2025 and 2035
  • Figure 30: North America Market; Value Share and BPS Analysis by Service Type, 2025 and 2035
  • Figure 31: North America Market; Y-o-Y Growth Comparison by Service Type, 2025-2035
  • Figure 32: North America Market; Attractiveness Analysis by Service Type
  • Figure 33: North America Market; Value Share and BPS Analysis by Application, 2025 and 2035
  • Figure 34: North America Market; Y-o-Y Growth Comparison by Application, 2025-2035
  • Figure 35: North America Market; Attractiveness Analysis by Application
  • Figure 36: North America Market; Value Share and BPS Analysis by Platform Type, 2025 and 2035
  • Figure 37: North America Market; Y-o-Y Growth Comparison by Platform Type, 2025-2035
  • Figure 38: North America Market; Attractiveness Analysis by Platform Type
  • Figure 39: North America Market; Value Share and BPS Analysis by Outsourcing Approach, 2025 and 2035
  • Figure 40: North America Market; Y-o-Y Growth Comparison by Outsourcing Approach, 2025-2035
  • Figure 41: North America Market; Attractiveness Analysis by Outsourcing Approach
  • Figure 42: North America Market; Value Share and BPS Analysis by Client Type, 2025 and 2035
  • Figure 43: North America Market; Y-o-Y Growth Comparison by Client Type, 2025-2035
  • Figure 44: North America Market; Attractiveness Analysis by Client Type
  • Figure 45: Latin America Market; Value Share and BPS Analysis by Country, 2025 and 2035
  • Figure 46: Latin America Market; Value Share and BPS Analysis by Service Type, 2025 and 2035
  • Figure 47: Latin America Market; Y-o-Y Growth Comparison by Service Type, 2025-2035
  • Figure 48: Latin America Market; Attractiveness Analysis by Service Type
  • Figure 49: Latin America Market; Value Share and BPS Analysis by Application, 2025 and 2035
  • Figure 50: Latin America Market; Y-o-Y Growth Comparison by Application, 2025-2035
  • Figure 51: Latin America Market; Attractiveness Analysis by Application
  • Figure 52: Latin America Market; Value Share and BPS Analysis by Platform Type, 2025 and 2035
  • Figure 53: Latin America Market; Y-o-Y Growth Comparison by Platform Type, 2025-2035
  • Figure 54: Latin America Market; Attractiveness Analysis by Platform Type
  • Figure 55: Latin America Market; Value Share and BPS Analysis by Outsourcing Approach, 2025 and 2035
  • Figure 56: Latin America Market; Y-o-Y Growth Comparison by Outsourcing Approach, 2025-2035
  • Figure 57: Latin America Market; Attractiveness Analysis by Outsourcing Approach
  • Figure 58: Latin America Market; Value Share and BPS Analysis by Client Type, 2025 and 2035
  • Figure 59: Latin America Market; Y-o-Y Growth Comparison by Client Type, 2025-2035
  • Figure 60: Latin America Market; Attractiveness Analysis by Client Type
  • Figure 61: Western Europe Market; Value Share and BPS Analysis by Country, 2025 and 2035
  • Figure 62: Western Europe Market; Value Share and BPS Analysis by Service Type, 2025 and 2035
  • Figure 63: Western Europe Market; Y-o-Y Growth Comparison by Service Type, 2025-2035
  • Figure 64: Western Europe Market; Attractiveness Analysis by Service Type
  • Figure 65: Western Europe Market; Value Share and BPS Analysis by Application, 2025 and 2035
  • Figure 66: Western Europe Market; Y-o-Y Growth Comparison by Application, 2025-2035
  • Figure 67: Western Europe Market; Attractiveness Analysis by Application
  • Figure 68: Western Europe Market; Value Share and BPS Analysis by Platform Type, 2025 and 2035
  • Figure 69: Western Europe Market; Y-o-Y Growth Comparison by Platform Type, 2025-2035
  • Figure 70: Western Europe Market; Attractiveness Analysis by Platform Type
  • Figure 71: Western Europe Market; Value Share and BPS Analysis by Outsourcing Approach, 2025 and 2035
  • Figure 72: Western Europe Market; Y-o-Y Growth Comparison by Outsourcing Approach, 2025-2035
  • Figure 73: Western Europe Market; Attractiveness Analysis by Outsourcing Approach
  • Figure 74: Western Europe Market; Value Share and BPS Analysis by Client Type, 2025 and 2035
  • Figure 75: Western Europe Market; Y-o-Y Growth Comparison by Client Type, 2025-2035
  • Figure 76: Western Europe Market; Attractiveness Analysis by Client Type
  • Figure 77: Eastern Europe Market; Value Share and BPS Analysis by Country, 2025 and 2035
  • Figure 78: Eastern Europe Market; Value Share and BPS Analysis by Service Type, 2025 and 2035
  • Figure 79: Eastern Europe Market; Y-o-Y Growth Comparison by Service Type, 2025-2035
  • Figure 80: Eastern Europe Market; Attractiveness Analysis by Service Type
  • Figure 81: Eastern Europe Market; Value Share and BPS Analysis by Application, 2025 and 2035
  • Figure 82: Eastern Europe Market; Y-o-Y Growth Comparison by Application, 2025-2035
  • Figure 83: Eastern Europe Market; Attractiveness Analysis by Application
  • Figure 84: Eastern Europe Market; Value Share and BPS Analysis by Platform Type, 2025 and 2035
  • Figure 85: Eastern Europe Market; Y-o-Y Growth Comparison by Platform Type, 2025-2035
  • Figure 86: Eastern Europe Market; Attractiveness Analysis by Platform Type
  • Figure 87: Eastern Europe Market; Value Share and BPS Analysis by Outsourcing Approach, 2025 and 2035
  • Figure 88: Eastern Europe Market; Y-o-Y Growth Comparison by Outsourcing Approach, 2025-2035
  • Figure 89: Eastern Europe Market; Attractiveness Analysis by Outsourcing Approach
  • Figure 90: Eastern Europe Market; Value Share and BPS Analysis by Client Type, 2025 and 2035
  • Figure 91: Eastern Europe Market; Y-o-Y Growth Comparison by Client Type, 2025-2035
  • Figure 92: Eastern Europe Market; Attractiveness Analysis by Client Type
  • Figure 93: East Asia Market; Value Share and BPS Analysis by Country, 2025 and 2035
  • Figure 94: East Asia Market; Value Share and BPS Analysis by Service Type, 2025 and 2035
  • Figure 95: East Asia Market; Y-o-Y Growth Comparison by Service Type, 2025-2035
  • Figure 96: East Asia Market; Attractiveness Analysis by Service Type
  • Figure 97: East Asia Market; Value Share and BPS Analysis by Application, 2025 and 2035
  • Figure 98: East Asia Market; Y-o-Y Growth Comparison by Application, 2025-2035
  • Figure 99: East Asia Market; Attractiveness Analysis by Application
  • Figure 100: East Asia Market; Value Share and BPS Analysis by Platform Type, 2025 and 2035
  • Figure 101: East Asia Market; Y-o-Y Growth Comparison by Platform Type, 2025-2035
  • Figure 102: East Asia Market; Attractiveness Analysis by Platform Type
  • Figure 103: East Asia Market; Value Share and BPS Analysis by Outsourcing Approach, 2025 and 2035
  • Figure 104: East Asia Market; Y-o-Y Growth Comparison by Outsourcing Approach, 2025-2035
  • Figure 105: East Asia Market; Attractiveness Analysis by Outsourcing Approach
  • Figure 106: East Asia Market; Value Share and BPS Analysis by Client Type, 2025 and 2035
  • Figure 107: East Asia Market; Y-o-Y Growth Comparison by Client Type, 2025-2035
  • Figure 108: East Asia Market; Attractiveness Analysis by Client Type
  • Figure 109: South Asia & Pacific Market; Value Share and BPS Analysis by Country, 2025 and 2035
  • Figure 110: South Asia & Pacific Market; Value Share and BPS Analysis by Service Type, 2025 and 2035
  • Figure 111: South Asia & Pacific Market; Y-o-Y Growth Comparison by Service Type, 2025-2035
  • Figure 112: South Asia & Pacific Market; Attractiveness Analysis by Service Type
  • Figure 113: South Asia & Pacific Market; Value Share and BPS Analysis by Application, 2025 and 2035
  • Figure 114: South Asia & Pacific Market; Y-o-Y Growth Comparison by Application, 2025-2035
  • Figure 115: South Asia & Pacific Market; Attractiveness Analysis by Application
  • Figure 116: South Asia & Pacific Market; Value Share and BPS Analysis by Platform Type, 2025 and 2035
  • Figure 117: South Asia & Pacific Market; Y-o-Y Growth Comparison by Platform Type, 2025-2035
  • Figure 118: South Asia & Pacific Market; Attractiveness Analysis by Platform Type
  • Figure 119: South Asia & Pacific Market; Value Share and BPS Analysis by Outsourcing Approach, 2025 and 2035
  • Figure 120: South Asia & Pacific Market; Y-o-Y Growth Comparison by Outsourcing Approach, 2025-2035
  • Figure 121: South Asia & Pacific Market; Attractiveness Analysis by Outsourcing Approach
  • Figure 122: South Asia & Pacific Market; Value Share and BPS Analysis by Client Type, 2025 and 2035
  • Figure 123: South Asia & Pacific Market; Y-o-Y Growth Comparison by Client Type, 2025-2035
  • Figure 124: South Asia & Pacific Market; Attractiveness Analysis by Client Type
  • Figure 125: Middle East and Africa Market; Value Share and BPS Analysis by Country, 2025 and 2035
  • Figure 126: Middle East and Africa Market; Value Share and BPS Analysis by Service Type, 2025 and 2035
  • Figure 127: Middle East and Africa Market; Y-o-Y Growth Comparison by Service Type, 2025-2035
  • Figure 128: Middle East and Africa Market; Attractiveness Analysis by Service Type
  • Figure 129: Middle East and Africa Market; Value Share and BPS Analysis by Application, 2025 and 2035
  • Figure 130: Middle East and Africa Market; Y-o-Y Growth Comparison by Application, 2025-2035
  • Figure 131: Middle East and Africa Market; Attractiveness Analysis by Application
  • Figure 132: Middle East and Africa Market; Value Share and BPS Analysis by Platform Type, 2025 and 2035
  • Figure 133: Middle East and Africa Market; Y-o-Y Growth Comparison by Platform Type, 2025-2035
  • Figure 134: Middle East and Africa Market; Attractiveness Analysis by Platform Type
  • Figure 135: Middle East and Africa Market; Value Share and BPS Analysis by Outsourcing Approach, 2025 and 2035
  • Figure 136: Middle East and Africa Market; Y-o-Y Growth Comparison by Outsourcing Approach, 2025-2035
  • Figure 137: Middle East and Africa Market; Attractiveness Analysis by Outsourcing Approach
  • Figure 138: Middle East and Africa Market; Value Share and BPS Analysis by Client Type, 2025 and 2035
  • Figure 139: Middle East and Africa Market; Y-o-Y Growth Comparison by Client Type, 2025-2035
  • Figure 140: Middle East and Africa Market; Attractiveness Analysis by Client Type
  • Figure 141: Global Market; - Tier Structure Analysis
  • Figure 142: Global Market; - Company Share Analysis

Frequently Asked Questions

What is the market size of the aerospace engineering services outsourcing market in 2025?

The market size is valued at USD 188 billion in 2025.

How much will the aerospace engineering services outsourcing market reach by 2035?

It is projected to reach USD 1,754 billion by 2035.

What is the forecast CAGR for the aerospace engineering services outsourcing market from 2025 to 2035?

The market is expected to grow at a CAGR of 25% during 2025–2035.

Which service type holds the largest share in the aerospace engineering services outsourcing market?

Design and prototyping holds the largest share with 30% in 2025.

Who is the leading player in the aerospace engineering services outsourcing market?

Infosys is the leading player with 18% share.

Explore Similar Insights

Future Market Insights

Aerospace Engineering Services Outsourcing (ESO) Market