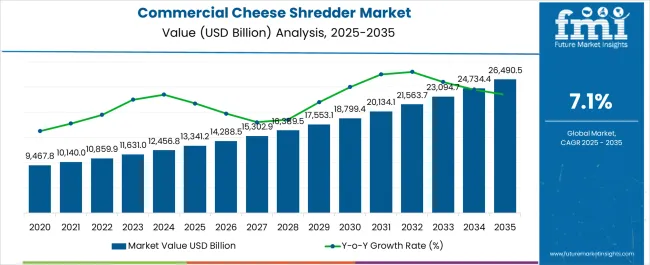
The commercial cheese shredder market is estimated to be valued at USD 13341.2 billion in 2025 and is projected to reach USD 26490.5 billion by 2035, registering a compound annual growth rate (CAGR) of 7.1% over the forecast period.
Cross-functional tensions emerge prominently in equipment selection processes where quality assurance teams prioritize hygiene features and contamination prevention systems while production managers focus on throughput maximization and operational speed requirements. Commercial kitchens encounter implementation challenges when integrating shredding systems that must comply with European hygiene package regulations including EC 852/2004 standards while accommodating workflow patterns established around traditional manual preparation methods. Food service operators face operational difficulties when coordinating maintenance schedules for blade replacement and cleaning protocols that cannot disrupt peak service periods yet require thorough sanitation compliance.
Restaurant segment demand patterns create operational tensions between franchise operators seeking standardized equipment specifications and independent establishments requiring customizable shredding configurations that accommodate unique menu offerings. Commercial kitchens struggle with space allocation decisions when installing shredding systems that promise efficiency improvements yet require dedicated floor space often competing with other essential food preparation equipment. Food service managers encounter challenges when training staff on automated shredding operations that demand technical competency while maintaining food safety protocols that vary between different cheese types and preparation requirements.
Technology integration presents particular operational challenges as IoT-enabled shredding systems offer predictive maintenance capabilities but require network infrastructure investments that many traditional food service establishments lack. Processing facilities discover that data analytics features promising yield optimization and waste reduction often demand staff training programs that extend implementation timelines beyond competitive operational schedules. Kitchen operations encounter difficulties when implementing automated systems that monitor shredding consistency and blade sharpness while accommodating varying operational volumes that fluctuate significantly between different service periods.
Energy efficiency considerations create operational tensions as advanced shredding systems promise reduced power consumption yet require initial investments that extend payback periods beyond traditional equipment replacement cycles. Food service facilities encounter challenges when evaluating total cost of ownership calculations that must account for energy savings against maintenance requirements and training costs associated with automated systems. Commercial operations face implementation difficulties when coordinating utility infrastructure upgrades necessary for high-efficiency shredding equipment while maintaining operational continuity during installation periods.
The commercial cheese shredder ecosystem continues evolving as operators address practical realities where equipment reliability, food safety compliance, and operational efficiency must integrate seamlessly while accommodating diverse operational environments ranging from high-volume chain restaurants to specialized artisanal food preparation facilities. Companies pursuing market expansion encounter operational challenges when scaling manufacturing capabilities that serve multiple market segments with distinct operational characteristics requiring specialized equipment configurations and maintenance protocols. Processing facilities face ongoing complexity when implementing operational strategies that balance automation benefits against workforce management considerations necessary for maintaining service quality standards within rapidly evolving food service industry requirements.
| Metric | Value |
|---|---|
| Commercial Cheese Shredder Market Estimated Value in (2025 E) | USD 13341.2 billion |
| Commercial Cheese Shredder Market Forecast Value in (2035 F) | USD 26490.5 billion |
| Forecast CAGR (2025 to 2035) | 7.1% |
The commercial cheese shredder market is witnessing consistent growth owing to rising demand for convenience in food preparation, increasing consumption of processed cheese, and the expansion of quick service restaurants and food service chains. The need for efficient equipment that reduces labor costs and enhances kitchen productivity is driving adoption among commercial kitchens.
Advances in equipment design, including improved safety features, higher throughput capacity, and energy efficiency, are further supporting market expansion. Regulatory emphasis on food safety and hygiene standards is encouraging investment in high quality shredding equipment.
The outlook remains positive as food service operators continue to prioritize automation, consistency, and operational efficiency in cheese processing, aligning with broader trends in commercial kitchen modernization.
The market is segmented by Product Type and End User and region. By Product Type, the market is divided into Semi-automatic Shredders and Automatic Cheese Shredders. In terms of End User, the market is classified into Commercial and Household. Regionally, the market is classified into North America, Latin America, Western Europe, Eastern Europe, Balkan & Baltic Countries, Russia & Belarus, Central Asia, East Asia, South Asia & Pacific, and the Middle East & Africa.
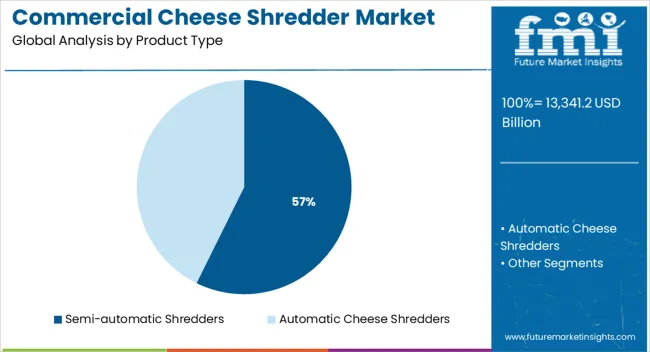
The semi automatic shredders segment is projected to hold 57.30% of total revenue by 2025, making it the leading product type. Growth is being driven by their balance between cost effectiveness and productivity, making them highly attractive for small to medium scale commercial kitchens.
These shredders provide consistent output while requiring less manual effort than traditional equipment, yet remain more affordable than fully automated solutions. Their adaptability to different cheese textures and volumes has further supported widespread adoption.
As demand for operational efficiency and flexibility continues to grow, semi automatic shredders are expected to maintain dominance in the product type category.
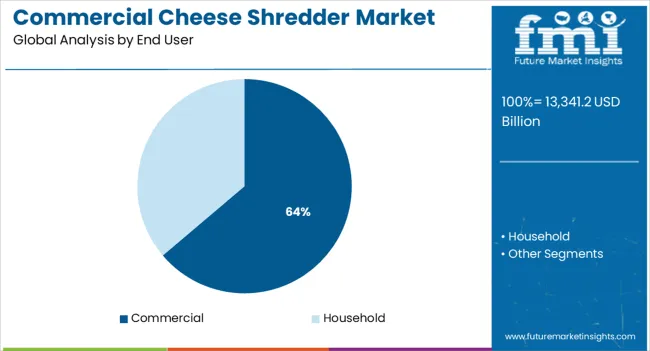
The commercial segment is expected to contribute 63.80% of total revenue by 2025, positioning it as the leading end user category. This dominance is attributed to the rising consumption of cheese in restaurants, hotels, catering services, and quick service outlets.
The need for consistent shredding, time savings, and compliance with food safety standards has driven strong adoption of commercial grade shredders. The growing preference for ready to use cheese in pizzas, sandwiches, and fast food preparations further supports this segment’s leadership.
As the food service industry continues to expand globally, the commercial end user category will remain the primary driver of market growth.
The global demand for commercial cheese shredders increased at 5.1% CAGR during the historical period from 2020 and 2025. However, for the projection period (2025 to 2035), a CAGR of 7.1% has been predicted by Future Market Insights for the worldwide commercial cheese shredder industry.
Growing demand for processed cheese and increasing usage of shredded cheese in a wide range of food recipes are a few of the key factors driving the global commercial cheese shredder industry.
Commercial cheese shredders have become essential equipment used across end use sectors such as restaurants, hotels, and cafes. These machines allow users to grate cheese into fine pieces on a large scale, thereby helping to improve overall productivity.
Changing food habits, rapid urbanization, and increasing consumer spending on processed food products are expected to push commercial cheese shredder demand during the forecast period.
Increasing penetration of supermarkets and hypermarkets and development of new products with enhanced features by leading market players will foster development of the global commercial cheese shredder industry over the next decade.
Several influential factors have been identified that are expected to foster the development of the global commercial cheese shredder industry during the projection period (2025 to 2035). Besides this, FMI analysts have also analyzed the restraining elements, lucrative opportunities, and upcoming threats that can influence commercial cheese shredder sales.
The drivers, restraints, opportunities, and threats (DROTs) identified are as follows:
DRIVERS
RESTRAINTS
OPPORTUNITIES
THREATS
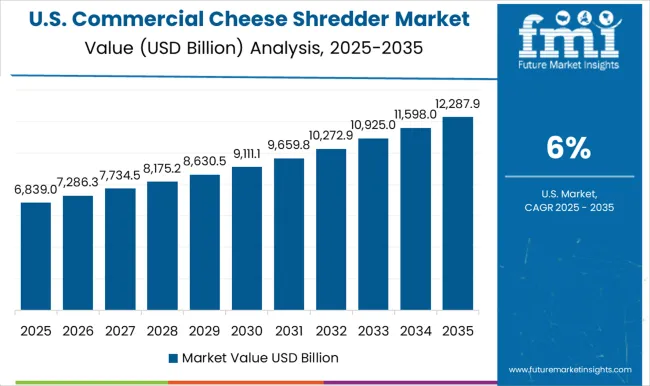
Rising Consumption of Fast Foods Boosting Commercial Cheese Shredder Sales in the United States
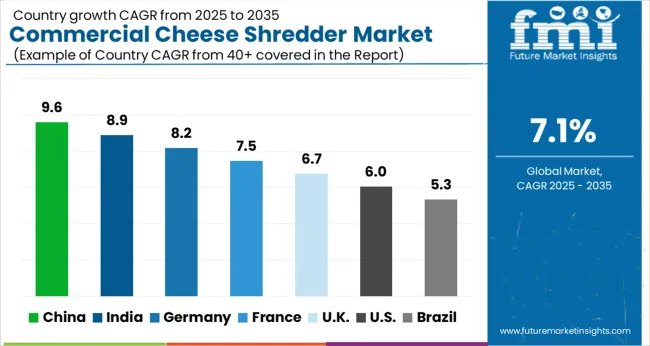
The United States commercial cheese shredder market is currently valued at USD 1,344.5 million and it accounts for around 34% share of the North American commercial cheese shredder industry. Growth in the United States market is driven by a rapid expansion of the food service industry and burgeoning consumption of various types of cheeses and cheese-based dishes.
Today, a significant number of Americans consume fast foods such as sandwiches, soup, pizza, and toasted cheese. As most of these products contain shredded cheese, demand for cheese shredders is likely to grow at a significant pace.
Similarly, the growing need for cutting cheese in a short time across households and commercial sectors is expected to push commercial cheese shredder demand in the country during the forecast period.
Rapid Growth of HoReCa Industry Generating Demand in the United Kingdom
As per FMI, the United Kingdom commercial cheese shredder market is valued at around USD 1,191.0 million and it holds about 32% share of the Europe commercial cheese shredder industry. Rising usage of shredded cheese in a wide range of food recipes and the growing popularity of processed food products due to changing lifestyles and rapid urbanization.
Similarly, the robust growth of the HoReCa sector, availability of advanced cheese processing equipment at lower costs, and booming culinary tourism are expected to push sales of commercial cheese shredders in the country during the projection period.
Rising Trend of Using Commercial Cheese Shredder in Households to Boost Market in China
According to FMI, China's commercial cheese shredder market is worth over USD 977.0 million and it accounts for around 35% of the Asia pacific commercial cheese shredder industry. This is attributed to the rising consumer spending on convenience and ready-to-eat food products, the rapidly growing population, and the easy availability of advanced products at lower prices.
Similarly, the growing popularity of using commercial cheese shredders across households is expected to boost the market in the country during the next ten years.
Automatic Cheese Shredder Becoming Widely Popular Among End Users
By product type, the automatic commercial cheese shredder segment is likely to expand at a healthy pace during the assessment period, owing to the rising end-user preference for these products due to their faster and more effective nature.
The automatic cheese shredder automatically cuts blocks of cheese into small pieces of equivalent sizes. These machines are incredibly easy to use and significantly improve the productivity of processes. As a result, they are becoming widely popular across households and commercial sectors.
Commercial Sector to Generate Lucrative Revenues Through 2035
Based on end users, most of the demand for commercial cheese shredders is expected to arise from the commercial sector during the forecast period. This is attributed to the surging presence of fast-food restaurants, cafes, and hotels.
Similarly, increasing consumption of fast foods worldwide due to rapid urbanization, increasing disposable income, changing eating habits, and busy schedules will positively influence commercial cheese shredder sales during the assessment period.
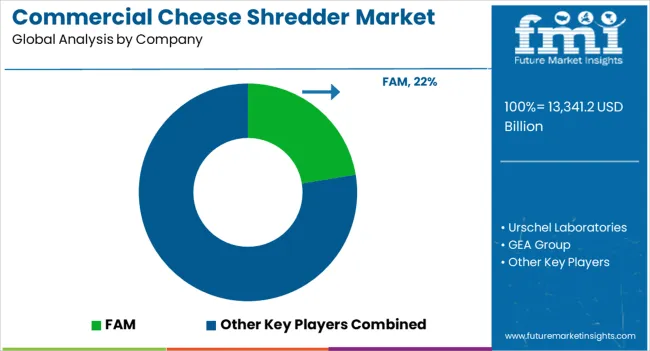
The food slicing and cutting equipment market is driven by leading manufacturers developing precision, hygienic, and high-throughput machinery for food processing and packaging applications. FAM and Urschel Laboratories Inc. lead globally with advanced cutting technologies designed for fruits, vegetables, meat, and cheese processing. Their systems emphasize uniform slicing accuracy, easy sanitation, and automated blade adjustment, enabling efficient large-scale production for food manufacturers worldwide. GEA Group AG offers integrated food processing lines, incorporating slicing and portioning equipment that deliver consistency, safety, and reduced waste for both industrial and ready-to-eat applications.
MIMASA and Cavecchi focus on hygiene and cleaning integration, providing cutting systems designed with washdown capabilities to meet strict food safety standards. Marchant Schmidt Inc. specializes in cheese cutting and portioning solutions tailored to dairy processors, combining precision automation with high-speed throughput. Johnson Industries supplies custom slicing systems for seafood and poultry sectors, ensuring consistent yield and product quality.
Weber Maschinenbau GmbH is a leading European player recognized for high-performance slicers used in deli and protein processing, integrating robotics and vision systems for portion control. Jaymech Food Machines caters to regional and niche processors with reliable, cost-effective cutting and slicing equipment. Competitive strategies focus on automation, sanitation, and customization, with innovation centered on smart controls, precision cutting, and energy-efficient designs for diverse food processing operations.
| Attribute | Details |
|---|---|
| Estimated Market Size (2025) | USD 13341.2 billion |
| Projected Market Size (2035) | USD 26490.5 billion |
| Anticipated Growth Rate (2025 to 2035) | 7.1% CAGR |
| Forecast Period | 2025 to 2035 |
| Historical Data Available for | 2020 to 2025 |
| Market Analysis | USD Million for Value and Units for Volume |
| Key Regions Covered | North America; Latin America; Europe; Asia Pacific; Oceania; Middle East & Africa |
| Key Countries Covered | The United States, Canada, Mexico, Germany, The United Kingdom, France, Italy, Spain, China, Japan, India, South Korea, Australia, Brazil, Argentina, South Africa, UAE |
| Key Segments Covered | Product Type, End User, Region |
| Key Companies Profiled | FAM, Urschel Laboratories Inc., GEA Group AG, MIMASA, Cavecchi, Marchant Schmidt Inc., Johnson Industries, Weber Maschinenbau GmbH, and Jaymech Food Machines. |
| Report Coverage | Market Forecast, Company Share Analysis, Competitive Landscape, DROT Analysis, Market Dynamics and Challenges, and Strategic Growth Initiatives |
The global commercial cheese shredder market is estimated to be valued at USD 13,341.2 billion in 2025.
The market size for the commercial cheese shredder market is projected to reach USD 26,490.5 billion by 2035.
The commercial cheese shredder market is expected to grow at a 7.1% CAGR between 2025 and 2035.
The key product types in commercial cheese shredder market are semi-automatic shredders and automatic cheese shredders.
In terms of end user, commercial segment to command 63.8% share in the commercial cheese shredder market in 2025.


Full Research Suite comprises of:
Market outlook & trends analysis
Interviews & case studies
Strategic recommendations
Vendor profiles & capabilities analysis
5-year forecasts
8 regions and 60+ country-level data splits
Market segment data splits
12 months of continuous data updates
DELIVERED AS:
PDF EXCEL ONLINE
Commercial Blast Freezer Market Size and Share Forecast Outlook 2025 to 2035
Commercial Water Heater Market Size and Share Forecast Outlook 2025 to 2035
Commercial High-Speed Oven Market Size and Share Forecast Outlook 2025 to 2035
Commercial Turboprop Aircrafts Market Size and Share Forecast Outlook 2025 to 2035
Commercial Vehicle Foundation Brakes Market Size and Share Forecast Outlook 2025 to 2035
Commercial Vehicle Brake Chambers Market Size and Share Forecast Outlook 2025 to 2035
Commercial Vehicles LED Bar Lights Market Size and Share Forecast Outlook 2025 to 2035
Commercial Vehicle AMT Transmission Market Size and Share Forecast Outlook 2025 to 2035
Commercial Greenhouse Market Size and Share Forecast Outlook 2025 to 2035
Commercial Vessel Market Size and Share Forecast Outlook 2025 to 2035
Commercial Slush Machine Market Size and Share Forecast Outlook 2025 to 2035
Commercial Medium Voltage Distribution Panel Market Size and Share Forecast Outlook 2025 to 2035
Commercial Earth Observation (CEO) Market Size and Share Forecast Outlook 2025 to 2035
Commercial Ozone Generator Market Size and Share Forecast Outlook 2025 to 2035
Commercial Gas-Fired Boiler Market Size and Share Forecast Outlook 2025 to 2035
Commercial Deep Fryer Parts & Accessories Market Size and Share Forecast Outlook 2025 to 2035
Commercial Gas Restaurant Ranges Market Size and Share Forecast Outlook 2025 to 2035
Commercial Heat Pump Market Size and Share Forecast Outlook 2025 to 2035
Commercial Countertop Ranges Market Size and Share Forecast Outlook 2025 to 2035
Commercial Electric Restaurant Ranges Market Size and Share Forecast Outlook 2025 to 2035

Thank you!
You will receive an email from our Business Development Manager. Please be sure to check your SPAM/JUNK folder too.
Chat With
MaRIA