Demand for Pea Protein RTM Dispersibility for Shaker Formats Size and Share Forecast Outlook 2025 to 2035

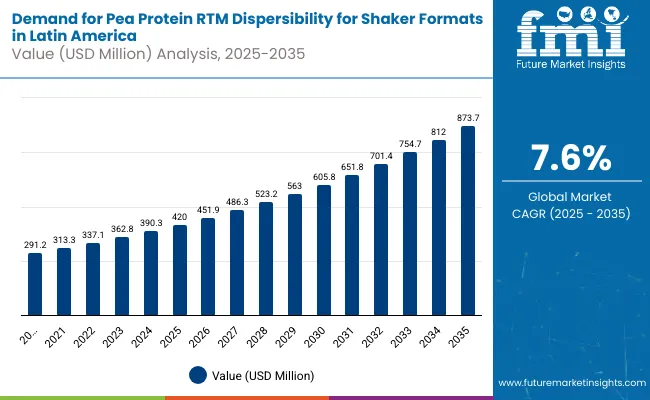
Demand for pea protein RTM dispersibility for shaker formats in Latin America is estimated at USD 420 million in 2025, with projections indicating a rise to USD 873.72 million by 2035, reflecting a CAGR of approximately 7.6% over the forecast period.
Pea Protein RTM Dispersibility for Shaker Formats in Latin America: Key Takeaways

  • Pea Protein RTM Sales Value in Latin America (2025): USD 420 million
  • Pea Protein RTM Forecast Value in Latin America (2035): USD 873.72 million
  • Pea Protein RTM Forecast CAGR (2025-2035): 7.6%
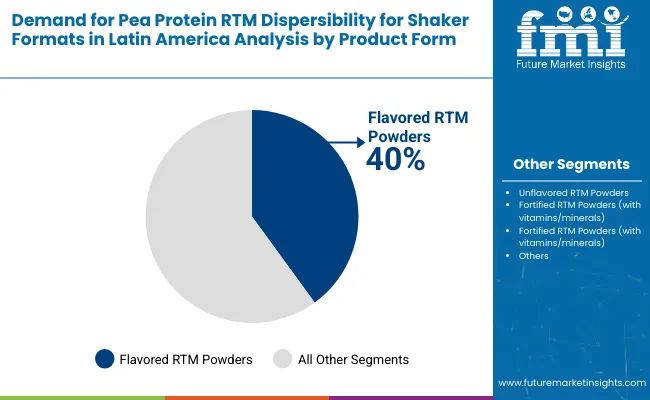
  • Leading Segment by Product Form (2025): Flavored RTM Powders (40%)
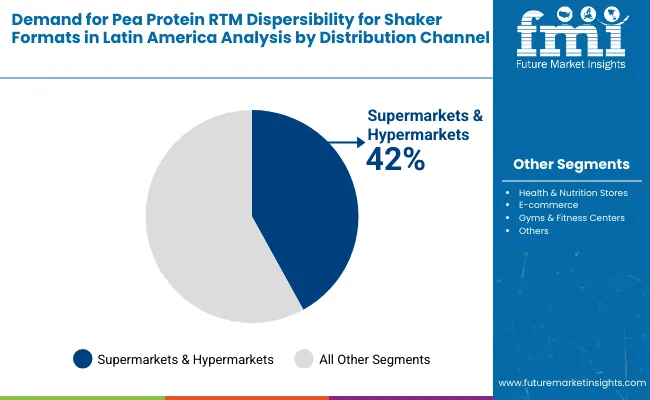
  • Leading Segment by Distribution (2025): Supermarkets & Hypermarkets (42%)
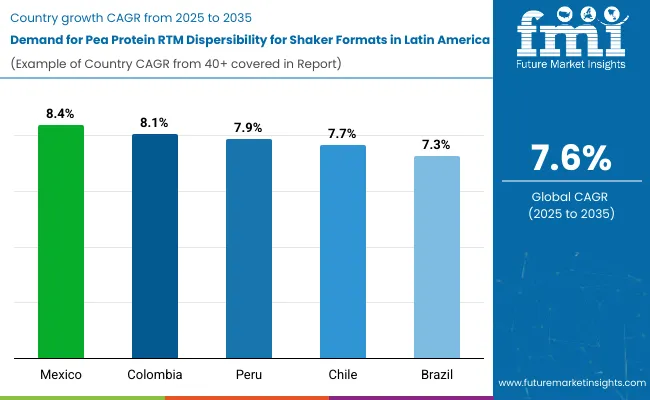
  • Fastest Growing Regions: Mexico, Colombia
  • Top Key Players in Pea Protein RTM Dispersibility for Shaker Formats in Latin America: Myprotein, Nutrilatina, Vitafor, EMS Pharma, Atlhetica Nutrition

Demand For Pea Protein Rtm Dispersibility For Shaker Formats

Metric Value
Industry Size (2025E) USD 420 million
Industry Value (2035F) USD 873.72 million
CAGR (2025 to 2035) 7.6%

This growth reflects both expanding consumer awareness of plant-based nutrition and increased per capita consumption of protein supplements across key urban centers. The rise in demand is linked to growing fitness culture adoption, heightened health consciousness, and evolving convenience preferences for on-the-go nutrition.

By 2025, per capita consumption in leading Latin American countries such as Brazil, Mexico, and Argentina averages between 0.8 to 1.2 kilograms, with projections reaching 1.6 kilograms by 2035. São Paulo leads among metropolitan areas, expected to generate USD 42 million in pea protein RTM sales by 2035, followed by Mexico City (USD 28 million), Buenos Aires (USD 18 million), Rio de Janeiro (USD 15 million), and Bogotá (USD 12 million).

The largest contribution to demand continues to come from flavored RTM powders, which are expected to account for 40% of total sales in 2025, owing to enhanced palatability, improved mixability profiles, and strong consumer preference for taste-forward formulations. By distribution channel, supermarkets and hypermarkets represent the dominant retail format, responsible for 42% of all sales, while health and nutrition stores and e-commerce platforms are expanding rapidly.

Consumer adoption is particularly concentrated among sports and fitness enthusiasts and health-conscious millennials, with urban density and disposable income emerging as significant drivers of demand. While price remains a consideration compared to whey protein alternatives, the average price premium has declined from 18% in 2020 to 12% in 2025.

Continued improvements in processing technology and local manufacturing capabilities are expected to accelerate affordability and access across middle-income households. Regional disparities persist, but per capita spending in emerging Colombian and Chilean cities is narrowing the gap with traditionally strong Brazilian and Mexican urban hubs.

Pea Protein RTM Dispersibility for Shaker Formats in Latin America: Segmentation

The pea protein RTM dispersibility segment in Latin America is classified across several dimensions. By product form, the key categories include unflavored RTM powders, flavored RTM powders, fortified RTM powders with vitamins and minerals, and specialized RTM powders for sports and clinical applications. By distribution channel, the segment spans supermarkets and hypermarkets, health and nutrition stores, e-commerce platforms, gyms and fitness centers, and other specialty outlets. By flavor profile, formulations include chocolate-based, vanilla-based, berry and fruit-based, and other exotic flavor combinations. By consumer profile, the segment covers sports and fitness enthusiasts, health-conscious millennials, weight management consumers, and other specialized demographic groups. By geography, countries such as Brazil, Mexico, Argentina, Colombia, and other Latin American nations are included, with coverage across major metropolitan areas and emerging urban centers.
By Product Form, Flavored RTM Powders to Lead with 40% Share

Demand For Pea Protein Rtm Dispersibility For Shaker Formats By Product

Flavored RTM powders are projected to dominate sales in 2025, supported by superior taste profiles, enhanced dispersibility characteristics, and consumer preference for ready-to-consume convenience. Other formats such as unflavored, fortified, and specialized powders are growing steadily, each serving distinct nutritional and application needs.
  • Flavored RTM powders are expected to hold a 40% value share in 2025, driven by advanced flavoring technology, improved solubility profiles, and consumer demand for palatable protein supplementation that eliminates the need for additional ingredients during preparation.
  • Unflavored RTM powders maintain a 35% share, appealing to purist consumers and those seeking ingredient flexibility, supported by clean label positioning and compatibility with custom flavor additions and smoothie recipes.
  • Fortified RTM powders with vitamins and minerals are showing strong traction at 15% share, particularly among health-conscious consumers seeking comprehensive nutritional supplementation beyond basic protein requirements.
  • Specialized RTM powders for sports and clinical applications represent 10% of the segment, targeting performance-oriented athletes and consumers with specific dietary or medical considerations requiring enhanced amino acid profiles and specialized formulations.

By Distribution Channel, Supermarkets & Hypermarkets to Lead with 42% Share

Demand For Pea Protein Rtm Dispersibility For Shaker Formats By Distribution

Pea protein RTM products in Latin America are distributed through a mix of traditional retail and specialized health channels. Supermarkets and hypermarkets are expected to remain the primary point of sale in 2025, followed by health and nutrition stores and e-commerce platforms. Distribution strategies are evolving to match consumer shopping behavior, with growth coming from both physical and digital formats.

  • Supermarkets and hypermarkets are projected to account for 42% of total sales in 2025, supported by widespread accessibility, prominent shelf placement in health and wellness sections, and the growing inclusion of premium and private label SKUs in chains such as Carrefour, Walmart, and local retail giants.
  • Health and nutrition stores maintain a significant 25% share through specialized product knowledge, expert consultation services, and curated assortments targeting serious fitness enthusiasts and health-conscious consumers seeking professional guidance.
  • E-commerce platforms are forecast to capture 18% of sales, fueled by subscription models, bulk purchasing options, and digital-native brands offering exclusive formulations and direct-to-consumer convenience in major metropolitan areas.
  • Gyms and fitness centers account for 10% of distribution through on-site retail, post-workout purchase convenience, and partnership programs with fitness influencers and personal trainers promoting specific brands and formulations.
  • Other channels, including pharmacies and specialty health stores, contribute 5% through targeted placement in wellness-focused retail environments and cross-selling opportunities with complementary health products.

By Flavor Profile, Chocolate-Based Formulations to Dominate Across Formats

Pea protein RTM products in Latin America utilize diverse flavor profiles, selected for palatability, cultural preferences, and masking of inherent pea protein taste characteristics. Chocolate-based formulations remain the most widely accepted, though vanilla and fruit-based alternatives are gaining momentum among specific consumer segments.

  • Chocolate-based flavors continue to lead with a 38% share, leveraging strong cultural affinity for chocolate across Latin American consumers and superior masking capabilities for pea protein's natural earthy notes through cocoa integration.
  • Vanilla-based formulations capture 32% of demand, appealing to consumers seeking versatile flavor profiles compatible with various mix-ins and smoothie recipes, while offering clean taste experiences without overwhelming sweetness.
  • Berry and fruit-based flavors account for 20% of sales, gaining traction among health-conscious millennials and female consumers seeking refreshing, antioxidant-rich flavor experiences that align with wellness lifestyle positioning.
  • Other exotic and regional flavor combinations represent 10% of the segment, including tropical fruit blends, coffee-inspired profiles, and culturally specific taste preferences that cater to local palates and emerging flavor trends.

By Consumer Profile, Sports & Fitness Enthusiasts Drive Core Demand

The pea protein RTM category appeals to a diverse consumer base across age groups, fitness levels, and health motivations. While usage patterns vary from performance enhancement to general wellness supplementation, demand is concentrated among three key demographic clusters. Each group brings distinct purchase behaviors, flavor preferences, and product expectations.
  • Sports and fitness enthusiasts represent the core consumer group at 45%, prioritizing protein quality, dispersibility performance, and post-workout recovery benefits; this segment tends to purchase larger container sizes and responds well to performance-focused messaging and amino acid profile transparency.
  • Health-conscious millennials account for 30% of demand, driven by plant-based lifestyle choices, environmental sustainability concerns, and clean label preferences; this group actively seeks organic certifications, minimal ingredient lists, and ethical sourcing claims.
  • Weight management consumers represent 15% of the segment, motivated by satiety benefits, calorie control, and metabolic support; their purchasing decisions are influenced by portion control packaging, hunger satisfaction claims, and integration with broader weight management programs.
  • Other consumer segments, including elderly consumers seeking muscle maintenance and general wellness users, contribute 10% through steady repeat purchasing and recommendation-driven adoption patterns.

Demand for Pea Protein RTM by Region

Demand For Pea Protein Rtm Dispersibility For Shaker Formats By Country

Pea protein RTM sales will not grow uniformly across every Latin American country. Rising fitness culture penetration and faster per-capita adoption in emerging economies give Mexico and Colombia a measurable edge, while mature Brazilian and other hubs expand more steadily from a higher consumption base. The table below shows the compound annual growth rate (CAGR) each of the five largest countries is expected to record between 2025 and 2035.

Between 2025 and 2035, demand for pea protein RTM products is projected to expand across all major Latin American countries, but the pace of growth will vary based on fitness culture adoption, retail infrastructure development, and baseline protein supplement consumption levels.

Among the top five countries analyzed, Mexico is expected to register the fastest compound annual growth rate (CAGR) of 8.4%, driven by rapidly expanding gym membership, growing middle-class purchasing power, and increasing health awareness among urban millennials. This acceleration is underpinned by improved distribution networks, local manufacturing investments, and strategic partnerships between international brands and regional fitness chains.

Colombia follows closely with an 8.1% CAGR, supported by strong economic growth prospects, increasing urban concentration, and developing retail infrastructure that facilitates premium product adoption. Both countries benefit from relatively lower baseline consumption levels, creating significant runway for category expansion as plant-based nutrition awareness increases.

Peru is forecast to grow at 7.9% CAGR, reflecting steady demand from emerging fitness communities in Lima and other major cities, supported by growing disposable income and health consciousness trends. The country's increasing integration with global supplement supply chains and expanding retail presence supports sustained growth.

Chile maintains a 7.7% growth rate, leveraging economic stability, high urban concentration, and sophisticated retail infrastructure. The country benefits from established health and wellness culture and growing acceptance of plant-based nutrition alternatives.

Brazil, while maintaining the largest absolute sales volume, is expected to grow at 7.3% CAGR, reflecting its mature supplement sector and higher baseline consumption levels. Growth will primarily come from flavor innovation, premium product tier expansion, and penetration into secondary cities beyond São Paulo and Rio de Janeiro.

Collectively, these five countries represent approximately 90% of Latin American demand for pea protein RTM products, but their individual growth trajectories highlight the importance of country-specific strategies in product formulation, pricing, and distribution approach.
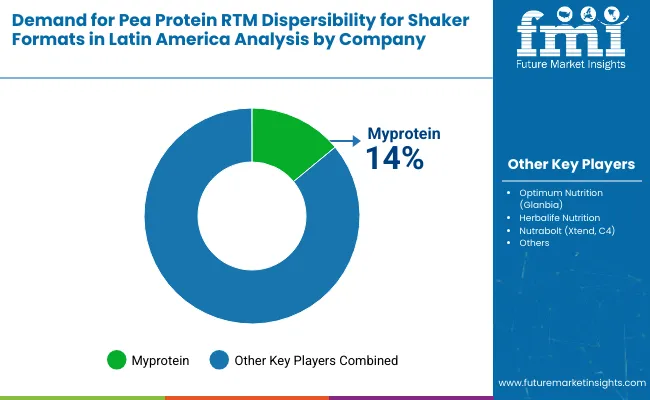
Notable Players and Strategies in Latin America Pea Protein RTM Space

Demand For Pea Protein Rtm Dispersibility For Shaker Formats By Company

The competitive environment is characterized by a mix of established regional supplement manufacturers and emerging plant-based specialists. Distribution breadth and local manufacturing capabilities rather than product variety remain the decisive success factors: the five largest suppliers collectively reach more than 15,000 retail outlets across the region and account for a majority of health store and supermarket shelf facings in the category.

Myprotein represents the leading player with a 14% share, leveraging its global brand recognition and extensive e-commerce capabilities to reach Latin American consumers. The company's focus on competitive pricing, diverse flavor options, and direct-to-consumer distribution has enabled strong penetration across multiple countries while maintaining quality standards through established supply chain partnerships.

Nutrilatina represents the most established regional player, leveraging its extensive distribution network across Brazil and expanding presence in Argentina and Colombia. The company's focus on locally-manufactured formulations and culturally-relevant flavor profiles has enabled premium positioning while maintaining competitive pricing through supply chain optimization.

Vitafor, a Brazilian-based supplement manufacturer, has emerged as a key competitor through strategic partnerships with fitness influencers and gym chains. Its emphasis on sports nutrition credentials and performance-focused messaging has resonated strongly with the core sports and fitness enthusiast demographic.

EMS Pharma, while traditionally focused on pharmaceutical products, has successfully entered the pea protein space through its wellness division, leveraging existing retail relationships and medical credibility to target health-conscious consumers seeking clinically-validated formulations.

Atlhetica Nutrition has differentiated itself through premium positioning and innovative flavor development, targeting affluent urban consumers willing to pay premium prices for superior taste and dispersibility characteristics. The company's direct-to-consumer e-commerce strategy has proven particularly effective in reaching millennial demographics.

International players including Garden of Life, Vega, and Orgain are gradually entering the Latin American space through import partnerships and selective distribution agreements, bringing advanced formulation technologies and established brand credibility to compete with regional specialists.

Key Players in Latin America Pea Protein RTM Space

  • Myprotein
  • Nutrilatina
  • Vitafor
  • EMS Pharma
  • Atlhetica Nutrition
  • Growth Supplements
  • Integral Médica
  • Max Titanium
  • FTW Sports Nutrition
  • Probiótica
  • NewNutrition
  • Essential Nutrition
  • Profit Labs
  • Synthesys
  • Black Skull
  • Dux Nutrition

Scope Of Report

Attribute Details
Study Coverage Latin American sales and consumption of pea protein RTM dispersibility products from 2020 to 2035
Base Year 2025
Historical Data 2020
Forecast Period 2025-2035
Units of Measurement USD (sales), Metric Tonnes (volume), Kilograms per capita (consumption)
Geography Covered Brazil, Mexico, Argentina, Colombia, Chile, Peru, Venezuela, Ecuador, and other LATAM countries
Top Countries Analyzed Brazil, Mexico, Argentina, Colombia, Chile
Top Cities Analyzed São Paulo, Mexico City, Buenos Aires, Rio de Janeiro, Bogotá
By Product Format Unflavored RTM powders, Flavored RTM powders, Fortified RTM powders, Specialized RTM powders
By Distribution Channel Supermarkets/hypermarkets, Health stores, E-commerce, Gyms, Others
By Flavor Profile Chocolate-based, Vanilla-based, Berry/fruit-based, Others
By Consumer Profile Sports enthusiasts, Health-conscious millennials, Weight management consumers, Others
Metrics Provided Sales (USD), Volume (MT), Per capita consumption (kg), CAGR (2025-2035), Share by segment
Price Analysis Average unit prices by product format and region
Competitive Landscape Company profiles, private label strategies, regional vs. international presence
Forecast Drivers Fitness culture adoption, health awareness, protein supplementation trends, disposable income growth

Key Segments

By Product Format:

  • Unflavored RTM Powders
  • Flavored RTM Powders
  • Fortified RTM Powders with Vitamins & Minerals
  • Specialized RTM Powders for Sports & Clinical Applications

By Distribution Channel:

  • Supermarkets & Hypermarkets
  • Health & Nutrition Stores
  • E-commerce Platforms
  • Gyms & Fitness Centers
  • Other Channels (Pharmacies & Specialty Stores)

By Flavor Profile:

  • Chocolate-Based Formulations
  • Vanilla-Based Formulations
  • Berry & Fruit-Based Flavors
  • Other Exotic & Regional Flavor Combinations

By Consumer Profile:

  • Sports & Fitness Enthusiasts
  • Health-Conscious Millennials
  • Weight Management Consumers
  • Other Consumer Segments

By Country:

  • Brazil
  • Mexico
  • Argentina
  • Colombia
  • Chile
  • Other Latin American Countries

Table of Content

  1. Executive Summary
    • Latin America Market Outlook
    • Demand-side Trends
    • Supply-side Trends
    • Technology Roadmap Analysis
    • Analysis and Recommendations
  2. Market Overview
    • Market Coverage / Taxonomy
    • Market Definition / Scope / Limitations
  3. Market Background
    • Market Dynamics
      • Drivers
      • Restraints
      • Opportunity
      • Trends
    • Scenario Forecast
      • Demand in Optimistic Scenario
      • Demand in Likely Scenario
      • Demand in Conservative Scenario
    • Opportunity Map Analysis
    • Product Life Cycle Analysis
    • Supply Chain Analysis
      • Supply Side Participants and their Roles
        • Producers
        • Mid-Level Participants (Distributors/Agents/Brokers)
        • Retailers and Direct Sellers
      • Value Added and Value Created at Each Node
      • List of Raw Material Suppliers
      • List of Existing and Potential Buyers
    • Investment Feasibility Matrix
    • Value Chain Analysis
      • Profit Margin Analysis
      • Distributors and Wholesalers
      • Retailers
    • PESTLE and Porter's Analysis
    • Regulatory Landscape
      • By Key Countries
    • Regional Parent Market Outlook
    • Production and Consumption Statistics
    • Import and Export Statistics
  4. Latin America Market Analysis 2020 to 2024 and Forecast, 2025 to 2035
    • Historical Market Size Value (USD Million) & Volume (MT) Analysis, 2020 to 2024
    • Current and Future Market Size Value (USD Million) & Volume (MT) Projections, 2025 to 2035
      • Y-o-Y Growth Trend Analysis
      • Absolute Dollar Opportunity Analysis
  5. Latin America Market Analysis 2020 to 2024 and Forecast 2025 to 2035, By Product Format
    • Introduction / Key Findings
    • Historical Market Size Value (USD Million) & Volume (MT) Analysis By Product Format, 2020 to 2024
    • Current and Future Market Size Value (USD Million) & Volume (MT) Analysis and Forecast By Product Format, 2025 to 2035
      • Unflavored RTM Powders
      • Flavored RTM Powders
      • Fortified RTM Powders with Vitamins & Minerals
      • Specialized RTM Powders for Sports & Clinical Applications
    • Y-o-Y Growth Trend Analysis By Product Format, 2020 to 2024
    • Absolute Dollar Opportunity Analysis By Product Format, 2025 to 2035
  6. Latin America Market Analysis 2020 to 2024 and Forecast 2025 to 2035, By Distribution Channel
    • Introduction / Key Findings
    • Historical Market Size Value (USD Million) & Volume (MT) Analysis By Distribution Channel, 2020 to 2024
    • Current and Future Market Size Value (USD Million) & Volume (MT) Analysis and Forecast By Distribution Channel, 2025 to 2035
      • Supermarkets & Hypermarkets
      • Health & Nutrition Stores
      • E-commerce Platforms
      • Gyms & Fitness Centers
      • Other Channels (Pharmacies & Specialty Stores)
    • Y-o-Y Growth Trend Analysis By Distribution Channel, 2020 to 2024
    • Absolute Dollar Opportunity Analysis By Distribution Channel, 2025 to 2035
  7. Latin America Market Analysis 2020 to 2024 and Forecast 2025 to 2035, By Flavor Profile
    • Introduction / Key Findings
    • Historical Market Size Value (USD Million) & Volume (MT) Analysis By Flavor Profile, 2020 to 2024
    • Current and Future Market Size Value (USD Million) & Volume (MT) Analysis and Forecast By Flavor Profile, 2025 to 2035
      • Chocolate-Based Formulations
      • Vanilla-Based Formulations
      • Berry & Fruit-Based Flavors
      • Other Exotic & Regional Flavor Combinations
    • Y-o-Y Growth Trend Analysis By Flavor Profile, 2020 to 2024
    • Absolute Dollar Opportunity Analysis By Flavor Profile, 2025 to 2035
  8. Latin America Market Analysis 2020 to 2024 and Forecast 2025 to 2035, By Consumer Profile
    • Introduction / Key Findings
    • Historical Market Size Value (USD Million) & Volume (MT) Analysis By Consumer Profile, 2020 to 2024
    • Current and Future Market Size Value (USD Million) & Volume (MT) Analysis and Forecast By Consumer Profile, 2025 to 2035
      • Sports & Fitness Enthusiasts
      • Health-Conscious Millennials
      • Weight Management Consumers
      • Other Consumer Segments
    • Y-o-Y Growth Trend Analysis By Consumer Profile, 2020 to 2024
    • Absolute Dollar Opportunity Analysis By Consumer Profile, 2025 to 2035
  9. Latin America Market Analysis 2020 to 2024 and Forecast 2025 to 2035, By Country
    • Introduction
    • Historical Market Size Value (USD Million) & Volume (MT) Analysis By Country, 2020 to 2024
    • Current Market Size Value (USD Million) & Volume (MT) Analysis and Forecast By Country, 2025 to 2035
      • Brazil
      • Mexico
      • Argentina
      • Colombia
      • Chile
      • Other Latin American Countries
    • Market Attractiveness Analysis By Country
  10. Brazil Market Analysis 2020 to 2024 and Forecast 2025 to 2035
    • Historical Market Size Value (USD Million) & Volume (MT) Trend Analysis By Market Taxonomy, 2020 to 2024
    • Market Size Value (USD Million) & Volume (MT) Forecast By Market Taxonomy, 2025 to 2035
      • By Product Format
      • By Distribution Channel
      • By Flavor Profile
      • By Consumer Profile
    • Market Attractiveness Analysis
    • Key Takeaways
  11. Mexico Market Analysis 2020 to 2024 and Forecast 2025 to 2035
    • Historical Market Size Value (USD Million) & Volume (MT) Trend Analysis By Market Taxonomy, 2020 to 2024
    • Market Size Value (USD Million) & Volume (MT) Forecast By Market Taxonomy, 2025 to 2035
      • By Product Format
      • By Distribution Channel
      • By Flavor Profile
      • By Consumer Profile
    • Market Attractiveness Analysis
    • Key Takeaways
  12. Argentina Market Analysis 2020 to 2024 and Forecast 2025 to 2035
    • Historical Market Size Value (USD Million) & Volume (MT) Trend Analysis By Market Taxonomy, 2020 to 2024
    • Market Size Value (USD Million) & Volume (MT) Forecast By Market Taxonomy, 2025 to 2035
      • By Product Format
      • By Distribution Channel
      • By Flavor Profile
      • By Consumer Profile
    • Market Attractiveness Analysis
    • Key Takeaways
  13. Colombia Market Analysis 2020 to 2024 and Forecast 2025 to 2035
    • Historical Market Size Value (USD Million) & Volume (MT) Trend Analysis By Market Taxonomy, 2020 to 2024
    • Market Size Value (USD Million) & Volume (MT) Forecast By Market Taxonomy, 2025 to 2035
      • By Product Format
      • By Distribution Channel
      • By Flavor Profile
      • By Consumer Profile
    • Market Attractiveness Analysis
    • Key Takeaways
  14. Chile Market Analysis 2020 to 2024 and Forecast 2025 to 2035
    • Historical Market Size Value (USD Million) & Volume (MT) Trend Analysis By Market Taxonomy, 2020 to 2024
    • Market Size Value (USD Million) & Volume (MT) Forecast By Market Taxonomy, 2025 to 2035
      • By Product Format
      • By Distribution Channel
      • By Flavor Profile
      • By Consumer Profile
    • Market Attractiveness Analysis
    • Key Takeaways
  15. Key Countries Market Analysis
    • Brazil
      • Pricing Analysis
      • Market Share Analysis, 2024
        • By Product Format
        • By Distribution Channel
        • By Flavor Profile
        • By Consumer Profile
    • Mexico
      • Pricing Analysis
      • Market Share Analysis, 2024
        • By Product Format
        • By Distribution Channel
        • By Flavor Profile
        • By Consumer Profile
    • Argentina
      • Pricing Analysis
      • Market Share Analysis, 2024
        • By Product Format
        • By Distribution Channel
        • By Flavor Profile
        • By Consumer Profile
    • Colombia
      • Pricing Analysis
      • Market Share Analysis, 2024
        • By Product Format
        • By Distribution Channel
        • By Flavor Profile
        • By Consumer Profile
    • Chile
      • Pricing Analysis
      • Market Share Analysis, 2024
        • By Product Format
        • By Distribution Channel
        • By Flavor Profile
        • By Consumer Profile
  16. Market Structure Analysis
    • Competition Dashboard
    • Competition Benchmarking
    • Market Share Analysis of Top Players
      • By Country
      • By Product Format
      • By Distribution Channel
      • By Flavor Profile
      • By Consumer Profile
  17. Competition Analysis
    • Competition Deep Dive
      • Nutrilatina
        • Overview
        • Product Portfolio
        • Profitability by Market Segments
        • Sales Footprint
        • Strategy Overview
          • Marketing Strategy
          • Product Strategy
          • Channel Strategy
      • Vitafor
        • Overview
        • Product Portfolio
        • Profitability by Market Segments
        • Sales Footprint
        • Strategy Overview
          • Marketing Strategy
          • Product Strategy
          • Channel Strategy
      • EMS Pharma
        • Overview
        • Product Portfolio
        • Profitability by Market Segments
        • Sales Footprint
        • Strategy Overview
          • Marketing Strategy
          • Product Strategy
          • Channel Strategy
      • Atlhetica Nutrition
        • Overview
        • Product Portfolio
        • Profitability by Market Segments
        • Sales Footprint
        • Strategy Overview
          • Marketing Strategy
          • Product Strategy
          • Channel Strategy
      • Growth Supplements
        • Overview
        • Product Portfolio
        • Profitability by Market Segments
        • Sales Footprint
        • Strategy Overview
          • Marketing Strategy
          • Product Strategy
          • Channel Strategy
      • Integral Médica
        • Overview
        • Product Portfolio
        • Profitability by Market Segments
        • Sales Footprint
        • Strategy Overview
          • Marketing Strategy
          • Product Strategy
          • Channel Strategy
      • Max Titanium
        • Overview
        • Product Portfolio
        • Profitability by Market Segments
        • Sales Footprint
        • Strategy Overview
          • Marketing Strategy
          • Product Strategy
          • Channel Strategy
      • Others
        • Overview
        • Product Portfolio
        • Profitability by Market Segments
        • Sales Footprint
        • Strategy Overview
          • Marketing Strategy
          • Product Strategy
          • Channel Strategy
  18. Assumptions & Acronyms Used
  19. Research Methodology

List of Tables

  • Table 1: Latin America Market Value (USD Million) Forecast by Country, 2020-2035
  • Table 2: Latin America Market Volume (MT) Forecast by Country, 2020-2035
  • Table 3: Latin America Market Value (USD Million) Forecast by Product Format, 2020-2035
  • Table 4: Latin America Market Volume (MT) Forecast by Product Format, 2020-2035
  • Table 5: Latin America Market Value (USD Million) Forecast by Distribution Channel, 2020-2035
  • Table 6: Latin America Market Volume (MT) Forecast by Distribution Channel, 2020-2035
  • Table 7: Latin America Market Value (USD Million) Forecast by Flavor Profile, 2020-2035
  • Table 8: Latin America Market Volume (MT) Forecast by Flavor Profile, 2020-2035
  • Table 9: Latin America Market Value (USD Million) Forecast by Consumer Profile, 2020-2035
  • Table 10: Latin America Market Volume (MT) Forecast by Consumer Profile, 2020-2035
  • Table 11: Brazil Market Value (USD Million) Forecast by Product Format, 2020-2035
  • Table 12: Brazil Market Volume (MT) Forecast by Product Format, 2020-2035
  • Table 13: Brazil Market Value (USD Million) Forecast by Distribution Channel, 2020-2035
  • Table 14: Brazil Market Volume (MT) Forecast by Distribution Channel, 2020-2035
  • Table 15: Brazil Market Value (USD Million) Forecast by Flavor Profile, 2020-2035
  • Table 16: Brazil Market Volume (MT) Forecast by Flavor Profile, 2020-2035
  • Table 17: Brazil Market Value (USD Million) Forecast by Consumer Profile, 2020-2035
  • Table 18: Brazil Market Volume (MT) Forecast by Consumer Profile, 2020-2035
  • Table 19: Mexico Market Value (USD Million) Forecast by Product Format, 2020-2035
  • Table 20: Mexico Market Volume (MT) Forecast by Product Format, 2020-2035
  • Table 21: Mexico Market Value (USD Million) Forecast by Distribution Channel, 2020-2035
  • Table 22: Mexico Market Volume (MT) Forecast by Distribution Channel, 2020-2035
  • Table 23: Mexico Market Value (USD Million) Forecast by Flavor Profile, 2020-2035
  • Table 24: Mexico Market Volume (MT) Forecast by Flavor Profile, 2020-2035
  • Table 25: Mexico Market Value (USD Million) Forecast by Consumer Profile, 2020-2035
  • Table 26: Mexico Market Volume (MT) Forecast by Consumer Profile, 2020-2035
  • Table 27: Argentina Market Value (USD Million) Forecast by Product Format, 2020-2035
  • Table 28: Argentina Market Volume (MT) Forecast by Product Format, 2020-2035
  • Table 29: Argentina Market Value (USD Million) Forecast by Distribution Channel, 2020-2035
  • Table 30: Argentina Market Volume (MT) Forecast by Distribution Channel, 2020-2035
  • Table 31: Argentina Market Value (USD Million) Forecast by Flavor Profile, 2020-2035
  • Table 32: Argentina Market Volume (MT) Forecast by Flavor Profile, 2020-2035
  • Table 33: Argentina Market Value (USD Million) Forecast by Consumer Profile, 2020-2035
  • Table 34: Argentina Market Volume (MT) Forecast by Consumer Profile, 2020-2035
  • Table 35: Colombia Market Value (USD Million) Forecast by Product Format, 2020-2035
  • Table 36: Colombia Market Volume (MT) Forecast by Product Format, 2020-2035
  • Table 37: Colombia Market Value (USD Million) Forecast by Distribution Channel, 2020-2035
  • Table 38: Colombia Market Volume (MT) Forecast by Distribution Channel, 2020-2035
  • Table 39: Colombia Market Value (USD Million) Forecast by Flavor Profile, 2020-2035
  • Table 40: Colombia Market Volume (MT) Forecast by Flavor Profile, 2020-2035

List of Figures

  • Figure 1: Latin America Market Value (USD Million) by Product Format, 2025-2035
  • Figure 2: Latin America Market Value (USD Million) by Distribution Channel, 2025-2035
  • Figure 3: Latin America Market Value (USD Million) by Flavor Profile, 2025-2035
  • Figure 4: Latin America Market Value (USD Million) by Consumer Profile, 2025-2035
  • Figure 5: Latin America Market Value (USD Million) by Country, 2025-2035
  • Figure 6: Latin America Market Value (USD Million) Analysis by Country, 2020-2035
  • Figure 7: Latin America Market Volume (MT) Analysis by Country, 2020-2035
  • Figure 8: Latin America Market Value Share (%) and BPS Analysis by Country, 2025-2035
  • Figure 9: Latin America Market Y-o-Y Growth (%) Projections by Country, 2025-2035
  • Figure 10: Latin America Market Value (USD Million) Analysis by Product Format, 2020-2035
  • Figure 11: Latin America Market Volume (MT) Analysis by Product Format, 2020-2035
  • Figure 12: Latin America Market Value Share (%) and BPS Analysis by Product Format, 2025-2035
  • Figure 13: Latin America Market Y-o-Y Growth (%) Projections by Product Format, 2025-2035
  • Figure 14: Latin America Market Value (USD Million) Analysis by Distribution Channel, 2020-2035
  • Figure 15: Latin America Market Volume (MT) Analysis by Distribution Channel, 2020-2035
  • Figure 16: Latin America Market Value Share (%) and BPS Analysis by Distribution Channel, 2025-2035
  • Figure 17: Latin America Market Y-o-Y Growth (%) Projections by Distribution Channel, 2025-2035
  • Figure 18: Latin America Market Value (USD Million) Analysis by Flavor Profile, 2020-2035
  • Figure 19: Latin America Market Volume (MT) Analysis by Flavor Profile, 2020-2035
  • Figure 20: Latin America Market Value Share (%) and BPS Analysis by Flavor Profile, 2025-2035
  • Figure 21: Latin America Market Y-o-Y Growth (%) Projections by Flavor Profile, 2025-2035
  • Figure 22: Latin America Market Value (USD Million) Analysis by Consumer Profile, 2020-2035
  • Figure 23: Latin America Market Volume (MT) Analysis by Consumer Profile, 2020-2035
  • Figure 24: Latin America Market Value Share (%) and BPS Analysis by Consumer Profile, 2025-2035
  • Figure 25: Latin America Market Y-o-Y Growth (%) Projections by Consumer Profile, 2025-2035
  • Figure 26: Latin America Market Attractiveness by Product Format, 2025-2035
  • Figure 27: Latin America Market Attractiveness by Distribution Channel, 2025-2035
  • Figure 28: Latin America Market Attractiveness by Flavor Profile, 2025-2035
  • Figure 29: Latin America Market Attractiveness by Consumer Profile, 2025-2035
  • Figure 30: Latin America Market Attractiveness by Country, 2025-2035
  • Figure 31: Brazil Market Value (USD Million) by Product Format, 2025-2035
  • Figure 32: Brazil Market Value (USD Million) by Distribution Channel, 2025-2035
  • Figure 33: Brazil Market Value (USD Million) by Flavor Profile, 2025-2035
  • Figure 34: Brazil Market Value (USD Million) by Consumer Profile, 2025-2035
  • Figure 35: Brazil Market Value (USD Million) Analysis by Product Format, 2020-2035
  • Figure 36: Brazil Market Volume (MT) Analysis by Product Format, 2020-2035
  • Figure 37: Brazil Market Value Share (%) and BPS Analysis by Product Format, 2025-2035
  • Figure 38: Brazil Market Y-o-Y Growth (%) Projections by Product Format, 2025-2035
  • Figure 39: Brazil Market Value (USD Million) Analysis by Distribution Channel, 2020-2035
  • Figure 40: Brazil Market Volume (MT) Analysis by Distribution Channel, 2020-2035
  • Figure 41: Brazil Market Value Share (%) and BPS Analysis by Distribution Channel, 2025-2035
  • Figure 42: Brazil Market Y-o-Y Growth (%) Projections by Distribution Channel, 2025-2035
  • Figure 43: Brazil Market Attractiveness by Product Format, 2025-2035
  • Figure 44: Brazil Market Attractiveness by Distribution Channel, 2025-2035
  • Figure 45: Mexico Market Value (USD Million) by Product Format, 2025-2035
  • Figure 46: Mexico Market Value (USD Million) by Distribution Channel, 2025-2035
  • Figure 47: Mexico Market Value (USD Million) by Flavor Profile, 2025-2035
  • Figure 48: Mexico Market Value (USD Million) by Consumer Profile, 2025-2035
  • Figure 49: Mexico Market Value (USD Million) Analysis by Product Format, 2020-2035
  • Figure 50: Mexico Market Volume (MT) Analysis by Product Format, 2020-2035
  • Figure 51: Mexico Market Value Share (%) and BPS Analysis by Product Format, 2025-2035
  • Figure 52: Mexico Market Y-o-Y Growth (%) Projections by Product Format, 2025-2035
  • Figure 53: Mexico Market Attractiveness by Product Format, 2025-2035
  • Figure 54: Mexico Market Attractiveness by Distribution Channel, 2025-2035
  • Figure 55: Argentina Market Value (USD Million) by Product Format, 2025-2035
  • Figure 56: Argentina Market Value (USD Million) by Distribution Channel, 2025-2035
  • Figure 57: Argentina Market Value (USD Million) by Flavor Profile, 2025-2035
  • Figure 58: Argentina Market Value (USD Million) by Consumer Profile, 2025-2035
  • Figure 59: Argentina Market Attractiveness by Product Format, 2025-2035
  • Figure 60: Argentina Market Attractiveness by Distribution Channel, 2025-2035
  • Figure 61: Colombia Market Value (USD Million) by Product Format, 2025-2035
  • Figure 62: Colombia Market Value (USD Million) by Distribution Channel, 2025-2035
  • Figure 63: Colombia Market Value (USD Million) by Flavor Profile, 2025-2035
  • Figure 64: Colombia Market Value (USD Million) by Consumer Profile, 2025-2035
  • Figure 65: Colombia Market Attractiveness by Product Format, 2025-2035
  • Figure 66: Colombia Market Attractiveness by Distribution Channel, 2025-2035
  • Figure 67: Chile Market Value (USD Million) by Product Format, 2025-2035
  • Figure 68: Chile Market Value (USD Million) by Distribution Channel, 2025-2035
  • Figure 69: Chile Market Value (USD Million) by Flavor Profile, 2025-2035
  • Figure 70: Chile Market Value (USD Million) by Consumer Profile, 2025-2035
  • Figure 71: Chile Market Attractiveness by Product Format, 2025-2035
  • Figure 72: Chile Market Attractiveness by Distribution Channel, 2025-2035

Frequently Asked Questions

What is the projected sales value of pea protein RTM dispersibility products in Latin America by 2035?

By 2035, total Latin American sales of pea protein RTM products are projected to reach USD 873.72 million, up from USD 420 million in 2025, reflecting a CAGR of approximately 7.6%.

Which product formats dominate the Latin American pea protein RTM category?

Flavored RTM powders hold the leading share, accounting for approximately 40% of total sales in 2025, followed by unflavored RTM powders at 35%.

What are the fastest-growing countries for pea protein RTM consumption?

Mexico and Colombia lead in projected growth, with Mexico registering a CAGR of 8.4% and Colombia at 8.1% between 2025 and 2035, due to expanding fitness culture and growing health awareness.

Which distribution channels are most effective for pea protein RTM products in Latin America?

Supermarkets and hypermarkets are the dominant sales channel (42% share in 2025), followed by health and nutrition stores (25%) and e-commerce platforms (18%).

Who are the key companies driving pea protein RTM innovation in Latin America?

Major players include Myprotein, Nutrilatina, Vitafor, EMS Pharma, and Atlhetica Nutrition, with growing competition from international brands and private label offerings.

Explore Similar Insights

Future Market Insights

Demand for Pea Protein RTM Dispersibility for Shaker Formats