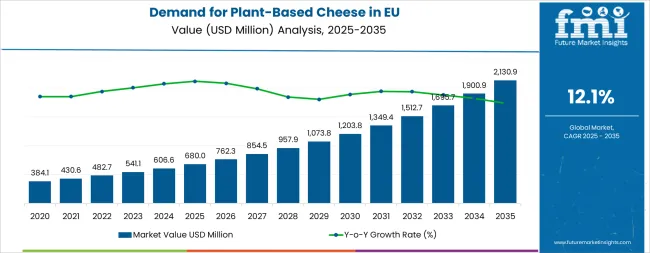
The EU plant-based cheese industry is projected to grow from USD 680 million in 2025 to USD 2,130.9 million by 2035, advancing at a CAGR of 12.1%. The soy milk segment is expected to lead sales with a 38.2% share in 2025, while the sliced format is anticipated to account for 30% of the application segment.
European Union plant-based cheese sales are projected to grow from USD 680.0 million in 2025 to approximately USD 2,130.9 million by 2035, recording an absolute increase of USD 1,460 million over the forecast period. This translates into total growth of 214.7%, with demand forecast to expand at a compound annual growth rate (CAGR) of 12.1% between 2025 and 2035. The overall industry size is expected to grow by nearly 3.1X during the same period, supported by the accelerating shift toward plant-based diets, increasing lactose intolerance awareness, and developing applications across sliced, shredded, spreadable, and block formats throughout European markets.
| Metric | Value |
|---|---|
| Market Value (2025) | USD 680 million |
| Market Forecast Value (2035) | USD 2,130.9 million |
| Forecast CAGR (2025-2035) | 12.1% |
Between 2025 and 2030, EU plant-based cheese demand is projected to expand from USD 680 million to USD 1,201.1 million, resulting in a value increase of USD 521.1 million, which represents 35.7% of the total forecast growth for the decade. This phase of development will be shaped by rising consumer adoption of dairy alternatives, increasing availability of diverse product varieties across sliced, shredded, and spreadable formats, and growing mainstream acceptance of plant-based cheese across retail and foodservice channels. Manufacturers are expanding their product portfolios to address the evolving preferences for improved melting properties, authentic cheese flavor profiles, and nutritionally fortified formulations comparable to conventional dairy cheese.
From 2030 to 2035, sales are forecast to grow from USD 1,201.1 million to USD 2,130.9 million, adding another USD 938.9 million, which constitutes 64.3% of the overall ten-year expansion. This period is expected to be characterized by further expansion of foodservice and HoReCa (hotels, restaurants, cafes) adoption, integration of advanced fermentation technologies for improved taste and texture, and development of premium artisanal plant-based cheese varieties targeting gourmet applications. The growing emphasis on environmental eco-efficiency and increasing consumer willingness to pay premium prices for plant-based alternatives will drive demand for innovative plant-based cheese products that deliver authentic dairy cheese experiences.
Between 2020 and 2025, EU plant-based cheese sales experienced robust expansion at a CAGR of 12.1%, growing from USD 383.3 million to USD 680 million. This period was driven by increasing environmental consciousness among European consumers, rising awareness of lactose intolerance and dairy allergies, and growing recognition of plant-based nutrition benefits. The industry developed as major food companies and specialized plant-based brands recognized the commercial potential of dairy cheese alternatives. Product innovations, improved melting characteristics, and taste profile enhancements began establishing consumer confidence and mainstream acceptance of plant-based cheese products.
Industry expansion is being supported by the rapid increase in flexitarian and vegan consumers across European countries and the corresponding demand for eco-efficient, ethical, and health-conscious dairy alternatives with proven functionality in culinary applications. Modern consumers rely on plant-based cheese as a direct replacement for dairy cheese in cooking, pizza preparation, sandwich making, and snacking occasions, driving demand for products that match or exceed dairy cheese's functional properties, including melting behavior, stretchability, and flavor characteristics. Even minor dietary concerns, such as lactose intolerance, dairy allergies, or cholesterol management, can drive comprehensive adoption of plant-based cheese to maintain optimal wellness and support eco-efficient consumption patterns.
The growing awareness of animal welfare issues and increasing recognition of dairy production's environmental impact are driving demand for plant-based cheese alternatives from certified producers with appropriate eco-efficiency credentials and ethical sourcing practices. Regulatory authorities are increasingly establishing clear guidelines for plant-based cheese labeling, nutritional fortification standards, and quality requirements to maintain consumer safety and ensure product consistency. Scientific research studies and culinary analyses are providing evidence supporting plant-based cheese's environmental advantages and functional improvements, requiring specialized processing methods and standardized formulation protocols for authentic cheese flavor development, optimal melting properties, and appropriate nutritional profiles, including calcium and vitamin B12 fortification.
Sales are segmented by product type (source), application (format), distribution channel, nature, and country. By product type, demand is divided into soy milk, pea milk, almond milk, oat milk, coconut milk, and rice/other bases. Based on the application, sales are categorized into sliced, shredded, spreadable, blocks, and others. In terms of distribution channel, demand is segmented into B2C (hypermarkets/supermarkets) and B2B (hotels/restaurants/cafes/foodservice). By nature, sales are classified into conventional and organic. Regionally, demand is focused on Germany, France, Italy, Spain, the Netherlands, and the Rest of Europe.
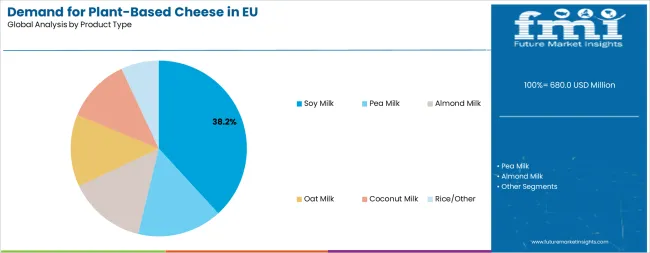
The soy-based segment is projected to account for 38.2% of EU plant-based cheese sales in 2025, establishing itself as the dominant ingredient base across European markets. This commanding position is fundamentally supported by soy's long-established presence in plant-based food production, comprehensive nutritional profile featuring high protein content comparable to dairy cheese, and superior functional properties enabling cheese-like texture development and melting behavior. The soy-based format delivers exceptional versatility, providing manufacturers with a reliable protein source that facilitates emulsification, texture formation, and flavor carrier properties essential for authentic cheese replication.
This segment benefits from mature supply chains, well-established processing infrastructure, and extensive availability from multiple certified European and international suppliers who maintain rigorous quality standards and organic certifications. Additionally, soy-based cheese offers versatility across various formats, including sliced, shredded, spreadable, and block varieties, supported by proven manufacturing technologies that address traditional challenges in melting performance and flavor development.
The soy-based segment is expected to maintain its 38.2% share through 2035, demonstrating stable positioning as newer alternative bases, including pea, oat, and almond, complement rather than displace soy's established presence throughout the forecast period.
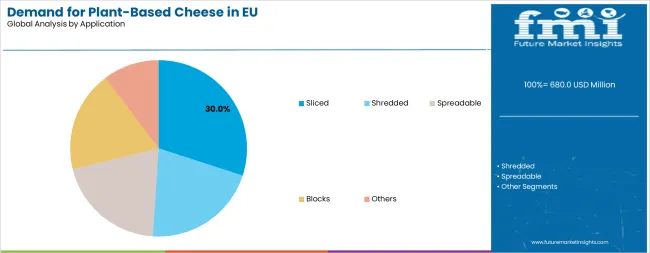
Sliced format is positioned to represent 30% of total plant-based cheese demand across European markets in 2025, maintaining this substantial share through 2035, reflecting the segment's dominance as the primary usage format within the overall industry ecosystem. This considerable share directly demonstrates that sliced cheese represents the largest single application, with consumers purchasing pre-sliced plant-based cheese for sandwich preparation, burger topping, snack platter assembly, and convenient meal applications mirroring traditional dairy cheese sliced product usage.
Modern consumers increasingly view sliced plant-based cheese as a convenient, portion-controlled alternative to dairy slices, driving demand for products optimized for cold applications with appropriate texture, flavor profiles that appeal beyond core vegan demographics, and packaging that maintains freshness and prevents slice separation. The segment benefits from continuous product innovation focused on improved melting performance when heated, texture enhancement preventing rubbery characteristics, and flavor development eliminating off-notes associated with early plant-based cheese formulations.
The segment's stable share reflects proportional growth across all application categories, with sliced format maintaining its leading position as the primary consumer-facing format throughout the forecast period.
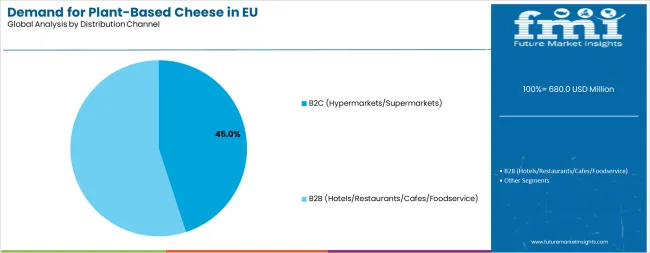
B2C channels, including hypermarkets, supermarkets, and large retail chains, are projected to control 55% of total sales in 2025, maintaining this dominant position through 2035. Retail channels play a critical role in driving product visibility, consumer access, and repeat purchases, ensuring mainstream adoption. Broad availability across multiple store formats enables consumers to trial products easily, encouraging integration into daily consumption routines. Major retail chains support market growth through in-store promotions, bundled offers, and dedicated product sections that improve visibility and brand recognition. The segment benefits from consumer preference for convenience, affordability, and consistent quality, which strengthens trust and encourages loyalty. Retail expansion across urban and suburban regions further reinforces B2C dominance.
The B2C segment also supports category credibility by normalizing product consumption and influencing purchase behavior. Promotional campaigns, product displays, and strategic merchandising drive awareness and trial, making hypermarkets and supermarkets key touchpoints for first-time consumers. Retail-led visibility allows consistent exposure to products, which enhances consumer confidence and reinforces repeat buying patterns. In addition, large-scale B2C adoption supports supply chain efficiency, ensuring reliable distribution and timely restocking. The combination of convenience, accessibility, and strong brand presence positions B2C channels as the dominant force in market expansion. Overall, hypermarkets and supermarkets continue to drive mainstream acceptance and sustained sales growth throughout the forecast period.
Key factors supporting B2C dominance include:
Conventional plant-based cheese products are strategically positioned to contribute 65% of total European sales in 2025, maintaining this substantial share through 2035, representing products produced through standard agricultural methods without organic certification requirements. These conventional products successfully deliver accessible pricing and consistent quality while ensuring broad commercial availability across all retail channels and foodservice operations that prioritize volume scalability and cost competitiveness over organic certification.
Conventional production serves price-conscious consumers, mainstream retail applications, and large-volume foodservice operators, including pizza chains, quick-service restaurants, and institutional catering that require reliable supply at competitive price points. The segment derives significant competitive advantages from established ingredient supply chains, economies of scale in manufacturing, and the ability to meet substantial volume requirements from major retailers and foodservice distributors without organic certification constraints limiting ingredient sourcing options.
The segment's stable share through 2035 reflects the category's growth stage, where mainstream adoption and volume expansion take priority over organic differentiation, with conventional products commanding the majority position and continuing to grow proportionally with overall industry expansion.
EU plant-based cheese sales are advancing rapidly due to accelerating flexitarian diet adoption, growing lactose intolerance awareness, and increasing environmental consciousness regarding dairy production impacts. However, the industry faces challenges, including persistent taste and texture gaps compared to premium dairy cheese for discerning consumers, higher price points that limit mass-market penetration, and functional limitations in melting and stretching performance for some applications. Continued innovation in fermentation technologies and culinary performance optimization remains central to industry development.
The rapidly accelerating development of precision fermentation technologies is fundamentally transforming plant-based cheese production from traditional ingredient blending to bioidentical dairy protein synthesis, enabling authentic cheese characteristics previously unattainable through conventional plant-based formulation. Advanced fermentation platforms featuring engineered microorganisms producing casein and whey proteins identical to dairy-derived molecules would allow manufacturers to create plant-based cheese with authentic melting behavior, characteristic stretchiness, and genuine cheese flavor development through traditional cheesemaking processes. These biotechnology innovations prove particularly transformative for premium cheese applications, including mozzarella for pizza, aged cheese varieties, and gourmet artisanal products, where authentic dairy cheese properties prove essential for consumer acceptance.
Major plant-based cheese brands invest heavily in fermentation technology partnerships, pilot-scale production development, and regulatory approval processes for precision fermentation ingredients, recognizing that bioidentical dairy proteins represent breakthrough solutions for functional performance challenges limiting plant-based cheese adoption. Manufacturers collaborate with biotechnology companies, fermentation technology providers, and ingredient suppliers to develop scalable production systems that reduce fermentation-derived protein costs while maintaining quality standards supporting premium positioning and mainstream penetration.
Modern plant-based cheese producers systematically incorporate advanced formulation strategies, including modified starches, specialty fats, and hydrocolloid systems that deliver superior melting performance, characteristic cheese stretch, and appropriate browning behavior, supporting pizza, gratin, and baked dish applications. Strategic integration of functional ingredients optimized for heat performance enables manufacturers to position plant-based cheese as a legitimate dairy cheese alternative where cooking performance directly determines consumer satisfaction and repeat purchase behavior. These functional improvements prove essential for foodservice adoption, as professional chefs demand consistent melting behavior, appropriate texture development during cooking, and reliable performance across diverse preparation methods.
Companies implement extensive application testing programs, culinary development partnerships with chefs, and formulation optimization targeting specific use cases, including pizza cheese requiring stretch and browning, shredded cheese for tacos and quesadillas, and block cheese for grilling and baking. Manufacturers leverage cooking performance improvements in marketing campaigns, foodservice demonstrations, and product packaging featuring application photography, positioning functionally enhanced plant-based cheese as a reliable alternative, delivering authentic cooking experiences.
European consumers increasingly prioritize clean-label plant-based cheese formulations featuring recognizable ingredients, minimal additives, and transparent manufacturing processes that align with whole-food dietary philosophies. This clean-label trend enables manufacturers to differentiate premium offerings through simple ingredient lists, non-GMO certification, and minimal processing claims that resonate with health-conscious consumers seeking plant-based alternatives without extensive ingredient manipulation or synthetic additives. Clean-label positioning proves particularly important for retail specialty cheese applications where premium pricing requires ingredient quality justification and transparency supporting consumer trust.
The development of fermentation-based production methods, enzyme-assisted processing, and natural flavor development through aging and culturing expands manufacturers' abilities to create clean-label products delivering authentic cheese characteristics without extensive additive reliance. Brands collaborate with ingredient suppliers, food scientists, and culinary experts to develop formulations balancing clean-label requirements with functional performance needs, supporting marketing claims and premium positioning while maintaining cooking reliability and taste acceptability across mainstream consumer segments.
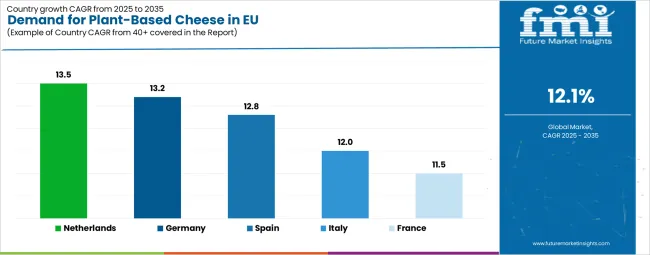
| Country | CAGR % |
|---|---|
| Netherlands | 13.5% |
| Germany | 13.2% |
| Spain | 12.8% |
| Italy | 12.0% |
| France | 11.5% |
EU plant-based cheese sales demonstrate strong growth across major European economies, with the Rest of Europe leading expansion at 13.7% CAGR through 2035, driven by emerging development and increasing mainstream retail penetration. Germany maintains leadership through an established vegan food culture and mature retail infrastructure. France benefits from growing flexitarian adoption and premium product positioning. Italy leverages progressive urban markets and foodservice innovation. Spain shows steady growth supported by the influence of the tourism industry and retail modernization. The Netherlands emphasizes eco-efficiency leadership and advanced food technology expertise. Overall, sales show robust regional development reflecting EU-wide cultural shifts toward plant-based consumption and dairy alternative acceptance.
Revenue from plant-based cheese in Germany is projected to exhibit robust growth with a CAGR of 13.2% through 2035, driven by exceptionally well-developed vegan food culture, comprehensive retail infrastructure for plant-based products, and strong consumer commitment to environmental eco-efficiency throughout the country. Germany's sophisticated understanding of plant-based nutrition and internationally recognized leadership in vegan product innovation are creating substantial demand for diverse plant-based cheese varieties across all consumer segments.
Major retailers, including Edeka, Rewe, Aldi, and specialized organic chains such as Alnatura, denn's Biomarkt, and Bio Company, systematically expand plant-based cheese selections, often dedicating extensive refrigerated sections to dairy alternatives and positioning them prominently to encourage trial. German demand benefits from high environmental consciousness, substantial disposable income supporting premium organic products, and cultural openness to dietary innovation that naturally supports plant-based cheese adoption across mainstream consumers beyond core vegan demographics.
Revenue from plant-based cheese in France is expanding at a CAGR of 11.5%, substantially supported by evolving consumer attitudes toward dairy alternatives despite France's strong traditional cheese culture and culinary heritage. France's growing environmental consciousness among younger urban consumers and increasing lactose intolerance awareness are systematically driving demand for high-quality plant-based cheese alternatives across diverse demographic segments.
Major retailers, including Carrefour, Auchan, Leclerc, and specialized organic chains, including Naturalia and Biocoop, are gradually establishing comprehensive plant-based cheese ranges to serve the continuously growing demand. French sales particularly benefit from a sophisticated culinary culture that demands superior taste and quality standards, driving product innovation and premiumization within the plant-based cheese category. Consumer education initiatives and chef endorsements are significantly enhancing penetration rates despite historical resistance to dairy alternatives in traditionally cheese-centric food culture.
Revenue from plant-based cheese in Italy is growing at a robust CAGR of 12.0%, fundamentally driven by increasing health consciousness, progressive urban consumer segments, and gradual modernization of Italian dietary patterns to incorporate plant-based alternatives. Italy's traditionally cheese-heavy cuisine is gradually accommodating plant-based options as consumers recognize the health benefits and environmental advantages of reducing dairy consumption while maintaining culinary traditions.
Major retailers, including Coop Italia, Esselunga, Conad, and Carrefour Italia, strategically invest in plant-based cheese category expansion and consumer education programs to address growing interest in dairy alternatives. Italian sales particularly benefit from strong pizza culture, creating natural demand for melting plant-based cheese alternatives, combined with increasing vegan communities in Milan, Rome, and other major cities, contributing to expansion through cultural influence and mainstreaming of plant-based options.
Demand for plant-based cheese in Spain is projected to grow at a CAGR of 12.8%, substantially supported by tourism industry exposure to international dietary preferences, expanding retail availability through major supermarket chains, and increasing environmental awareness among younger Spanish consumers. Spanish food culture's emphasis on fresh, natural ingredients positions plant-based cheese as a natural evolution rather than a radical departure from culinary heritage.
Major retailers, including Mercadona, Carrefour España, Alcampo, and Lidl España, systematically expand plant-based cheese offerings, with Mercadona's private-label plant-based products proving particularly successful in driving mainstream adoption through accessible pricing and prominent shelf placement. Spain's substantial tourism industry exposes domestic consumers to plant-based options through hotel breakfasts, café menus, and international restaurant chains, normalizing dairy alternatives and encouraging trial among curious consumers.
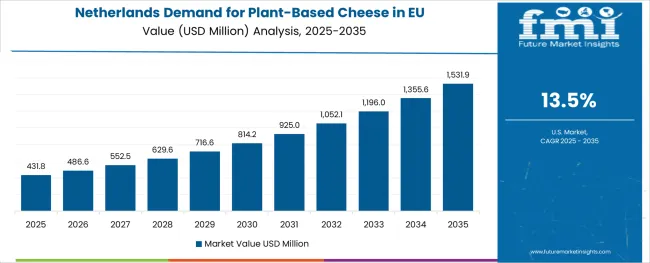
Demand for plant-based cheese in the Netherlands is expanding at a CAGR of 13.5%, fundamentally driven by exceptionally strong environmental consciousness, leadership in eco-efficient food innovation, and comprehensive retail support for plant-based products across mainstream and specialized channels. Dutch consumers demonstrate particularly high receptivity to eco-efficiency messaging and willingness to modify consumption patterns to reduce environmental impact.
Netherlands sales significantly benefit from a well-developed organic retail infrastructure, including Albert Heijn's extensive plant-based sections, Ekoplaza's specialized organic stores, and Marqt's premium positioning, combined with innovative food startups testing new products in a receptive Dutch environment. The country's dairy industry heritage paradoxically coexists with growing plant-based adoption, as consumers increasingly recognize environmental contradictions and seek alternatives. The Netherlands also serves as an innovation testing ground for the European market, with successful Dutch product launches often expanding to broader European markets.
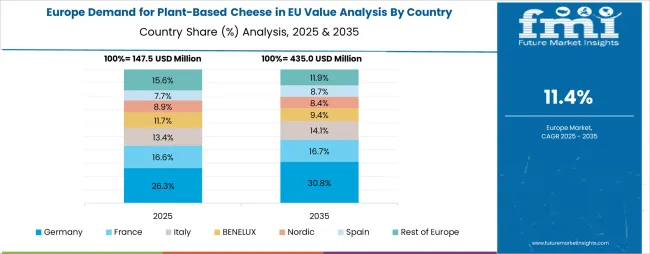
EU plant-based cheese sales are projected to grow from USD 680.0 million in 2025 to USD 2,130.9 million by 2035, registering a CAGR of 12.1% over the forecast period. The Rest of Europe region is expected to demonstrate the strongest growth trajectory with a 13.7% CAGR, supported by emerging development, increasing retail penetration, and growing environmental consciousness. Italy and the Netherlands follow with 13.5% CAGR each, attributed to progressive urban consumers and strong vegan food culture, respectively.
Germany, while maintaining the largest share at 25.0% in 2025, is expected to grow at a 13.2% CAGR, reflecting maturity and established plant-based infrastructure. France and Spain also demonstrate 11.5% and 12.8% CAGR, respectively, supported by evolving dietary preferences and expanding foodservice adoption.
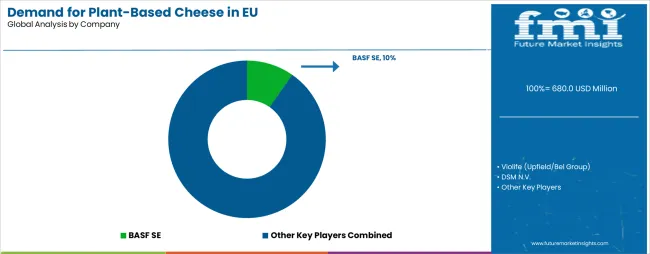
EU plant-based cheese sales are defined by competition among multinational food companies, specialized plant-based brands, and regional artisanal producers. Companies are investing in fermentation technologies, melting performance optimization, flavor development research, and eco-efficiency communication to deliver high-quality, functionally superior, and environmentally responsible plant-based cheese solutions. Strategic partnerships with foodservice operators, retail expansion initiatives, and marketing campaigns emphasizing taste improvements and cooking performance are central to strengthening the position.
Major participants include BASF SE with an estimated 12.0% share, leveraging its chemical expertise, ingredient development capabilities, and established European presence, supporting consistent supply to plant-based cheese manufacturers. BASF benefits from a specialty ingredient portfolio, technical support services, and the ability to provide functional solutions, including proteins, emulsifiers, and flavor systems, supporting cheese formulation development.
Violife (Upfield/Bel Group) holds approximately 10.0% share, emphasizing a comprehensive product portfolio spanning multiple cheese formats, strong retail distribution across European supermarkets, and brand recognition driving consumer trial and repeat purchase. Violife's success in developing products with improved melting performance and taste profiles creates strong positioning and mainstream acceptance, supported by Upfield's distribution capabilities and Bel Group's cheese industry expertise.
DSM N.V. accounts for roughly a 6.0% share through its position as a nutrition ingredient supplier, providing proteins, cultures, and functional ingredients to plant-based cheese manufacturers. The company benefits from fermentation technology expertise, precision fermentation ingredient development, and comprehensive technical support, helping manufacturers optimize formulations for taste, texture, and nutritional profiles.
Miyoko's Creamery represents approximately 4.0% share, supporting growth through artisanal positioning, premium product formulations using traditional cheesemaking techniques, and organic certification emphasis. Miyoko's leverages cultured plant-based cheese production methods, clean-label ingredient transparency, and gourmet positioning, attracting premium-focused consumers seeking authentic cheese alternatives with sophisticated flavor development.
Other companies and regional brands collectively hold 68.0% share, reflecting the highly fragmented nature of European plant-based cheese sales, where numerous national brands, private label offerings from major retailers, specialized organic producers, and emerging fermentation technology companies serve local markets, specific consumer preferences, and niche applications. This fragmentation provides opportunities for differentiation through specialized formats (aged cheese, gourmet varieties), innovative production methods (precision fermentation, traditional culturing), regional flavor profiles, and premium positioning resonating with sophisticated consumers seeking authentic dairy cheese alternatives.
| Item | Value |
|---|---|
| Quantitative Units | USD 2,140 million |
| Product Type (Source) | Soy Milk, Pea Milk, Almond Milk, Oat Milk, Coconut Milk, Rice/Other |
| Application (Format) | Sliced, Shredded, Spreadable, Blocks, Others |
| Distribution Channel | B2C (Hypermarkets/Supermarkets), B2B (Hotels/Restaurants/Cafes/Foodservice) |
| Nature | Conventional, Organic |
| Forecast Period | 2025-2035 |
| Base Year | 2025 |
| Historical Data | 2020-2024 |
| Countries Covered | Germany, France, Italy, Spain, the Netherlands, and the Rest of Europe |
| Key Companies Profiled | BASF SE, Violife (Upfield/Bel Group), DSM N.V., Miyoko's Creamery, Regional brands |
| Report Pages | 180+ Pages |
| Data Tables | 50+ Tables and Figures |
| Additional Attributes | Dollar sales by product type (source), application (format), distribution channel, and nature; regional demand trends across major European markets; competitive landscape analysis with established ingredient suppliers and specialized plant-based cheese brands; consumer preferences for various cheese formats and applications; integration with fermentation technologies and precision fermentation development; innovations in melting performance optimization and flavor development; adoption across retail and foodservice channels; regulatory framework analysis for plant-based cheese labeling and dairy alternative naming; supply chain strategies; and penetration analysis for mainstream and environmentally conscious European consumers. |
The global demand for plant-based cheese in EU is estimated to be valued at USD 680.0 million in 2025.
The market size for the demand for plant-based cheese in EU is projected to reach USD 2,130.9 million by 2035.
The demand for plant-based cheese in EU is expected to grow at a 12.1% CAGR between 2025 and 2035.
The key product types in demand for plant-based cheese in EU are soy milk, pea milk, almond milk, oat milk, coconut milk and rice/other.
In terms of application, sliced segment to command 30.0% share in the demand for plant-based cheese in EU in 2025.


Our Research Products

The "Full Research Suite" delivers actionable market intel, deep dives on markets or technologies, so clients act faster, cut risk, and unlock growth.

The Leaderboard benchmarks and ranks top vendors, classifying them as Established Leaders, Leading Challengers, or Disruptors & Challengers.

Locates where complements amplify value and substitutes erode it, forecasting net impact by horizon

We deliver granular, decision-grade intel: market sizing, 5-year forecasts, pricing, adoption, usage, revenue, and operational KPIs—plus competitor tracking, regulation, and value chains—across 60 countries broadly.

Spot the shifts before they hit your P&L. We track inflection points, adoption curves, pricing moves, and ecosystem plays to show where demand is heading, why it is changing, and what to do next across high-growth markets and disruptive tech

Real-time reads of user behavior. We track shifting priorities, perceptions of today’s and next-gen services, and provider experience, then pace how fast tech moves from trial to adoption, blending buyer, consumer, and channel inputs with social signals (#WhySwitch, #UX).

Partner with our analyst team to build a custom report designed around your business priorities. From analysing market trends to assessing competitors or crafting bespoke datasets, we tailor insights to your needs.
Supplier Intelligence
Discovery & Profiling
Capacity & Footprint
Performance & Risk
Compliance & Governance
Commercial Readiness
Who Supplies Whom
Scorecards & Shortlists
Playbooks & Docs
Category Intelligence
Definition & Scope
Demand & Use Cases
Cost Drivers
Market Structure
Supply Chain Map
Trade & Policy
Operating Norms
Deliverables
Buyer Intelligence
Account Basics
Spend & Scope
Procurement Model
Vendor Requirements
Terms & Policies
Entry Strategy
Pain Points & Triggers
Outputs
Pricing Analysis
Benchmarks
Trends
Should-Cost
Indexation
Landed Cost
Commercial Terms
Deliverables
Brand Analysis
Positioning & Value Prop
Share & Presence
Customer Evidence
Go-to-Market
Digital & Reputation
Compliance & Trust
KPIs & Gaps
Outputs
Full Research Suite comprises of:
Market outlook & trends analysis
Interviews & case studies
Strategic recommendations
Vendor profiles & capabilities analysis
5-year forecasts
8 regions and 60+ country-level data splits
Market segment data splits
12 months of continuous data updates
DELIVERED AS:
PDF EXCEL ONLINE
High-Protein Plant-Based Cheese Alternatives in the EU Analysis Size and Share Forecast Outlook 2025 to 2035
Europe Radiotherapy Patient Positioning Market Size and Share Forecast Outlook 2025 to 2035
Europe Polyvinyl Alcohol Industry Analysis Size and Share Forecast Outlook 2025 to 2035
Cheese Packaging Market Forecast and Outlook 2025 to 2035
Europe Cruise Market Forecast and Outlook 2025 to 2035
Europium Market Forecast and Outlook 2025 to 2035
Eucommia Leaf Extract Market Size and Share Forecast Outlook 2025 to 2035
Europe Massage Therapy Service Market Size and Share Forecast Outlook 2025 to 2035
Europe Cement Market Analysis Size and Share Forecast Outlook 2025 to 2035
European Union Tourism Industry Size and Share Forecast Outlook 2025 to 2035
Europe Injection Molding Machines Market Size and Share Forecast Outlook 2025 to 2035
Cheese Concentrates Market Size and Share Forecast Outlook 2025 to 2035
Europe Injection Moulders Market Size and Share Forecast Outlook 2025 to 2035
Cheese Ingredient Market Size and Share Forecast Outlook 2025 to 2035
Europe and MENA Generic Oncology Drug Market Size and Share Forecast Outlook 2025 to 2035
Europe Masking Tapes Market Size and Share Forecast Outlook 2025 to 2035
Europe Liners Market Size and Share Forecast Outlook 2025 to 2035
Europe Dermal Fillers Market Size and Share Forecast Outlook 2025 to 2035
Cheese Color Market Size and Share Forecast Outlook 2025 to 2035
Europe Trolley Bus Market Size and Share Forecast Outlook 2025 to 2035

Thank you!
You will receive an email from our Business Development Manager. Please be sure to check your SPAM/JUNK folder too.
Chat With
MaRIA