Electric Milkshake Machine Market Outlook (2022 to 2032)

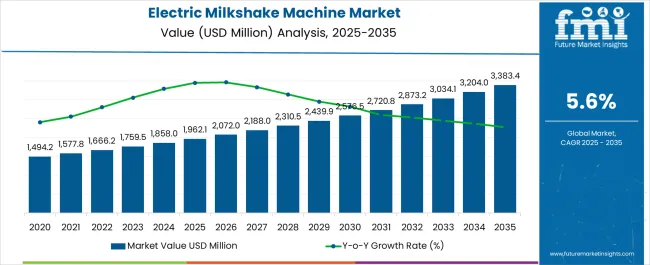
The global electric milkshake machine market size reached US$ 1666.2 million in 2022 and it is expected to increase at a steady CAGR of 5.6% between 2022 and 2032. Overall electric milkshake machine sales worldwide are projected to cross a market valuation of US$ 2873.2 million by 2032.

Growing demand for electric milkshake machines from commercial and residential sectors and increasing popularity of high nutritional ready-to-drink blended beverages such as milkshakes are driving the worldwide electric milkshake machines industry forward.

A countertop electric mixer used to prepare milkshakes, frappés, flavored milk, and other blended drinks is known as a milkshake machine or drink mixer. For making milkshakes in homes and restaurants, milkshake machines are typically found at ice cream shops and fast-food establishments.

Electric milkshake machines are gaining enormous popularity due to their safe and hygienic features. Unlike conventional mixers and blenders, electric milkshake mixers do not use blades, which makes them safe to use. These versatile machines give users more control over their creation.

They are being increasingly used across various end use sectors for making a broader range of blended beverages such as milkshakes. Hence, rising consumption of milkshakes and other blended beverages as a result of changing consumer preferences toward healthier and more nutritious food options will boost the electric milkshake machine market during the forecast period.

Increasing adoption of electric milkshake machines across households due to growing trend of ‘do it yourself’ (DIY) and rising popularity of smart homes is expected to create growth prospects for the global market over the next ten years.

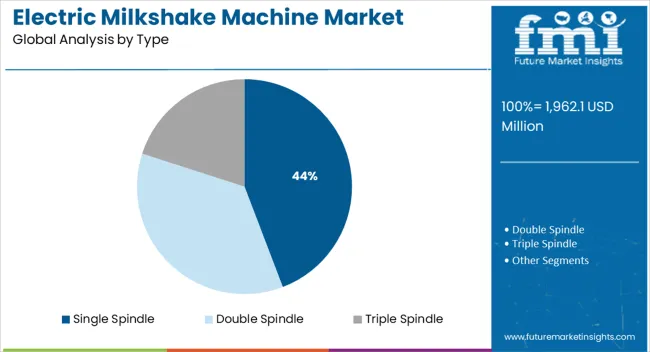
Demand is especially rising for multi-spindle electric milkshake machines due to their time-saving and high-efficiency features. These machines allow users to prepare a higher volume of milkshakes at once.

Expanding online retail sales across markets such as the Asia Pacific and the Europe due to rising popularity of buying electrical products online will further expand the global electric milkshake machine industry during the next decade.

Leading electric milkshake machine manufacturers are innovating to introduce more energy-efficient models with user-friendly features. Besides this, they are concentrating on reducing product prices so that more and more households can afford these electric appliances. This will help them to increase sales.

Attribute Key Insights
Electric Milkshake Machine Market Value (2022) US$ 1666.2 Million
Market Value (2032) US$ 2873.2 Million
Value-based CAGR (2022 to 2032) 5.6% CAGR

Don't pay for what you don't need

Customize your report by selecting specific countries or regions and save 30%!

2017 to 2021 Global Electric Milkshake Machine Market Outlook Compared to Demand Forecast for 2022 to 2032

The worldwide sales of electric milkshake machines increased at a moderate CAGR over the past half-decade (2017 to 2021). However, for the forecast period (2022 to 2032), a steady CAGR of 5.6% has been predicted by Future Market Insights for the global electric milkshake machine industry.

Growing consumption of milkshakes along with increasing usage of electric milkshake machines across residential and commercial sectors for preparing various blended beverages is a key factor driving the global market forward.

Milkshake demand is increasing in the food service industry as a result of changing consumer preferences toward healthier and more nutritious food options. Milkshakes are becoming increasingly popular as a dessert or snack option, particularly among young people.

The proliferation of fast-food chains and restaurants that include milkshake variations on their menus is expected to play a crucial role in fostering growth in the global electric milkshake machine industry during the forecast period.
Comparative Analysis of Electric Milkshake Machine Markets

Electric Milkshake Machine Market:

Differentiating Aspects Electric Milkshake Machine Market
CAGR in 2022 to 2032 5.6%
Current Valuation in 2022 US$ 1666.2 million
Projected Valuation in 2032 US$ 2873.2 million
Demand Drivers
  • Increasing demand for blended beverages such as milkshakes across the world due to their high nutritional content is driving the global electric milkshake machine industry.
  • Growing adoption across households due to rising trend of ‘do it yourself’ (DIY) and increasing popularity of smart homes will fuel electric milkshake machine sales during the forecast period.

Ribbon Blenders Market:

Differentiating Aspects Ribbon Blenders Market
CAGR in 2022 to 2032 9.7%
Current Valuation in 2022 US$ 17.8 billion
Projected Valuation in 2032 US$ 21.3 billion
Demand Drivers
  • Growing demand for high-performance blenders in food and beverage industry is expected to drive the global ribbon blender market swiftly during the forecast period.
  • Increasing usage across non-food industries such as pharmaceutical and petrochemical will boost ribbon blender sales over the projection period.

Food Premix Market:

Differentiating Aspects Food Premix Market
CAGR in 2022 to 2032 5.2%
Current Valuation in 2022 US$ 1.8 billion
Projected Valuation in 2032 US$ 3.2 billion
Demand Drivers
  • Rising awareness about the nutritional and health benefits of food premixes is providing a strong impetus to the global food premix market.
  • Increasing incidence of malnutrition along with growing popularity of fortified foods will elevate demand for food premixes during the next ten years.
Nandini Roy Choudhury

Principal Consultant

Talk to Analyst

Find your sweet spots for generating winning opportunities in this market.

Country-wise Insights

What Makes the United States a Dominant Market for Electric Milkshake Machines?

Growing Adoption across Households Fueling Sales Across United States

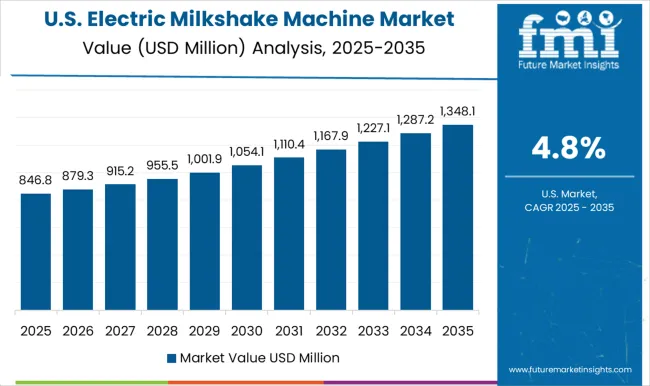
According to Future Market Insights, the United States electric milkshake machines market totaled a valuation of US$ 430.5 million in 2022 and it is expected to retain its dominance over the global market during the forecast period.

Increasing health-conscious consumers, hectic life schedules, and growing popularity of packaged milkshakes on account of their probiotic effect are a few factors driving demand for electric milkshake machines across the United States.

Similarly, rising adoption across residential homes along with increasing presence of restaurants and cafes is expected to propel electric milkshake machine demand in the country during the assessment period.

How are China and India Playing Key Roles in Shaping Asia Pacific Electric Milkshake Machine Industry?

Rising Export of Electric Appliances Boosting Market in China

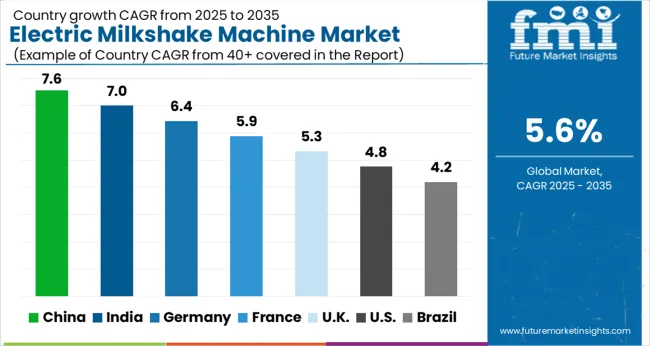
As per FMI’s latest analysis, the Asia Pacific, spearheaded by China and India, is set to emerge as the most lucrative market for electric milkshake machines market during the projection period. This is attributed to robust growth of home appliances industry, rapid urbanization, shifting consumer preferences toward western foods & beverages, and presence of leading electric milkshake machine manufacturers.

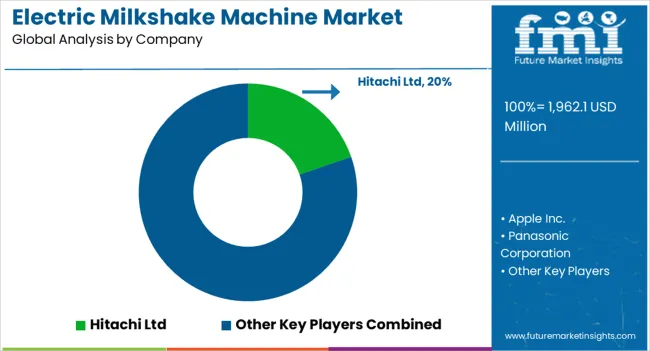
The Asia Pacific has become the hub of electronics due to presence of the world’s leading players including Philips N V, TOSHIBA Cooperation, Hitachi ltd, Apple Inc, Samsung Electronics, and Ali Groups. These companies are continuously introducing novel electrical appliances to meet end user demand.

Countries such as China and India have become leading exporters of mixers, blenders, and electric milkshake machines. China’s electrical products are gaining enormous popularity globally due to lower costs. Hence, increasing export of electric appliances is expected to create lucrative opportunities for electric milkshake machines throughout the forecast period

Increasing penetration of online shopping platforms, supermarkets, and industrial distributors across the Asia Pacific coupled with growing consumer preference towards purchasing home appliances through online mode will further boost electric milkshake sales during the assessment period.

Category-wise Insights

Who is the Leading End User of Electric Milkshake Machines?

Most of the Electric Milkshake Machine Demand to Arise from Households

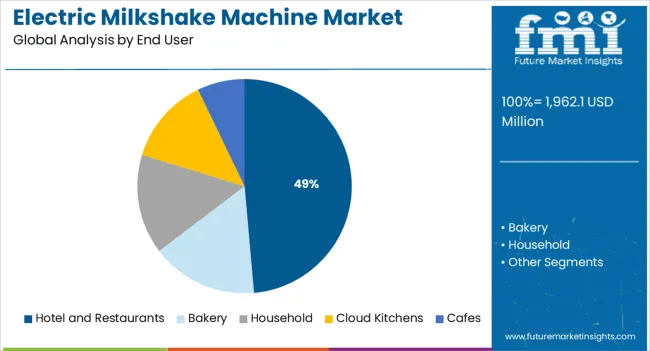
Based on end user, the global electric milkshake machine industry is segmented into hotels and restaurants, bakery, cafes, cloud kitchens, and households. Among these, the household category is perhaps one of the most dominant segments, holding a prominent market share of the global market. This is attributed to the rising adoption of electric milkshake machines across households for making milkshakes, frappes, and other blended beverages.

The demand for electrical goods increases together with the world population. As households' average monthly income has increased, they are now able to buy things other than those necessary for survival.

Families have started purchasing electrical appliances such as rice cookers, blenders, and electric milkshake machines to make their life easy and comfortable. This is providing a strong thrust to the global electric milkshake machine industry and the trend is expected to continue during the forecast period.

Subsequently, factors such as rapid urbanization, changing lifestyles and eating habits, and growing trend of ‘do it yourself’ are expected to elevate electric milkshake machine demand over the projection period.

Why is Demand for Fully Automated Electric Milkshake Machines Rising Rapidly?

Growing Need for Saving Time and Effort Encouraging Adoption of Full-automated Machines

By operating mode, the global market is categorized into manual, semi-automated, and fully-automated. Among these, semi-automated segment holds a significant share of the electric milkshake machine industry while the fully-automated segment is expected to surge at a healthy pace during the next ten years.

As people are becoming busier than ever before, they are showing a keen inclination towards employing automatic machines for performing various tasks. Adoption of fully automatic appliances helps them to save time and effort. This is a key factor triggering sales of fully-automated electric milkshake machines globally.
Get the data you need at a Fraction of the cost

Personalize your report by choosing insights you need
and save 40%!

Competitive Landscape

Leading electric milkshake machine manufacturers are continuously striving to upgrade their product portfolios by launching new innovative machines with additional features. They are also working on improving design of their products as well as reducing costs to attract more and more customers.

Other key strategies adopted by electric milkshake machine companies include mergers, acquisitions, partnerships, collaborations, and facility expansions. Besides these, they are shifting their preference towards selling their products through online shopping platforms.

Recent Developments:

  • In September 2021 Panasonic Corporation launched a new range of products that includes Monster Super Mixer Grinders with attractive discounts.
  • In November 2022, a new milkshake machine was set by Whole Moo World at Saffron’s Garage, in Bodenham.

Electric Milkshake Machine Industry Report Scope

Attribute Details
Market Size (2022) US$ 1666.2 million
Projected Market Size (2032) US$ 2873.2 million
Anticipated Growth Rate (2022 to 2032) 5.6% CAGR
Forecast Period 2022 to 2032
Historical Data Available for 2017 to 2021
Market Analysis US$ million for Value and Units for Volume
Key Regions Covered
  • North America
  • Latin America
  • Europe
  • Asia Pacific
  • South America
Key Countries Covered
  • United States
  • Canada
  • Mexico
  • Germany
  • United Kingdom
  • France
  • Italy
  • Spain
  • China
  • Japan
  • India
  • South Korea
  • Australia
  • Brazil
  • South Africa
  • UAE
Key Segments Covered
  • Product Type
  • Operating Mode
  • End User
  • Material
  • Type
  • Region
Key Companies Profiled
  • Hitachi Ltd
  • Apple Inc.
  • Panasonic Corporation
  • Ali Group Srl
  • Hamilton Beach Brands Holding Co.
  • Vita-Mix Corp.
  • Amilton Beach Brands
  • Electro Freeze
  • Federal Hospitality Equipment
  • KitchenAid
Report Coverage Market Forecast, Company Share Analysis, Competitive Landscape, DROT Analysis, Market Dynamics and Challenges, and Strategic Growth Initiatives

Key Segments

By Product Type:

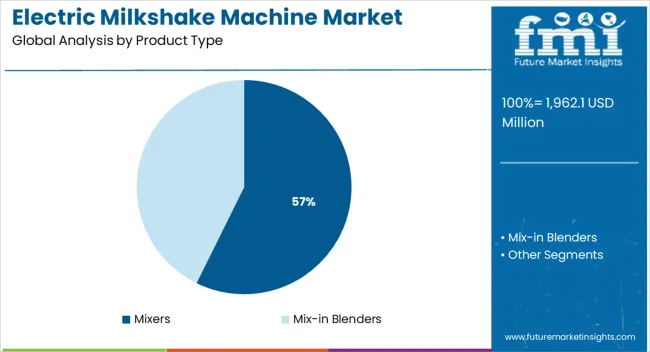
  • Mixers
  • Mix-in Blenders

By End User:

  • Hotel and Restaurants
  • Bakery
  • Household
  • Cloud Kitchens
  • Cafes

By Type:

  • Single Spindle
  • Double Spindle
  • Triple Spindle

By Operating Mode:

  • Manual
  • Semi-automated
  • Fully-automated

By Material:

  • Stainless steel
  • Polycarbonate

By Region:

  • North America
  • Latin America
  • Europe
  • South Asia
  • East Asia
  • Oceania
  • Middle East & Africa

Frequently Asked Questions

What are the future trends in the fence screen market?

The growing demand for decorative fence screens, the increasing popularity of DIY projects, and the rising use of recycled materials.

What are the investment opportunities in the electric milkshake machine market?

The market is expected to grow at a CAGR of 5.6% from 2023 to 2033, creating opportunities for investors.

What are the opportunities in the electric milkshake machine market?

The growing demand for milkshakes, the increasing popularity of at-home food service, and the rising disposable income of consumers.

Which regional market will witness higher growth?

The Asia Pacific region is expected to witness the highest growth in the electric milkshake machine market, with a CAGR of 5.8% from 2023 to 2033.

What are the future trends in the electric milkshake machine market?

The growing demand for portable machines, the increasing popularity of self-service machines, and the rising use of touchscreen technology.

Table of Content
1. Executive Summary | Electric Milkshake Machine Market

    1.1. Global Market Outlook

    1.2. Demand-side Trends

    1.3. Supply-side Trends

    1.4. Technology Roadmap Analysis

    1.5. Analysis and Recommendations

2. Market Overview

    2.1. Market Coverage/Taxonomy

    2.2. Market Definition/Scope/Limitations

3. Market Background

    3.1. Market Dynamics

        3.1.1. Drivers

        3.1.2. Restraints

        3.1.3. Opportunity

        3.1.4. Trends

    3.2. Scenario Forecast

        3.2.1. Demand in Optimistic Scenario

        3.2.2. Demand in Likely Scenario

        3.2.3. Demand in Conservative Scenario

    3.3. Product launches & Recent Developments

    3.4. Product Life Cycle Analysis

    3.5. Value Chain Analysis

        3.5.1. Supply Side Participants and their Roles

            3.5.1.1. Producers

            3.5.1.2. Mid-Level Participants (Traders/Agents/Brokers)

            3.5.1.3. Wholesalers and Distributors

        3.5.2. % of Operating Margin Analysis

        3.5.3. List of Raw Material Suppliers

        3.5.4. List of Existing and Potential Buyer’s

    3.6. Global Market - Pricing Analysis

        3.6.1. Price Point Assessment by Region

        3.6.2. Price Point Assessment by Product Type

        3.6.3. Price Forecast till 2032

        3.6.4. Factors affecting pricing

    3.7. Forecast Factors - Relevance & Impact

    3.8. PESTLE and Porter’s Analysis

    3.9. Regulatory Landscape

        3.9.1. Packaging & Labelling Regulations

        3.9.2. Certifications and Certifying Agency Overview

        3.9.3. Import/Export Policies

    3.10. Regional Parent Market Outlook

    3.11. Production and Consumption Statistics

    3.12. Import and Export Statistics

    3.13. Consumers Survey Analysis

    3.14. Macro-Economic Factors

    3.15. Product Claims & Nutritional Information Scan by Buyers

4. Global Analysis 2017 to 2021 and Forecast, 2022 to 2032

    4.1. Historical Market Size Value (US$ Million) & Volume (UNITS) Analysis, 2017 to 2021

    4.2. Current and Future Market Size Value (US$ Million) & Volume (UNITS) Projections, 2022 to 2032

        4.2.1. Y-o-Y Growth Trend Analysis

        4.2.2. Absolute $ Opportunity Analysis

5. Global Analysis 2017 to 2021 and Forecast 2022 to 2032, By Product Type

    5.1. Introduction / Key Findings

    5.2. Historical Market Size Value (US$ Million) & Volume (UNITS) Analysis by Product Type, 2017 to 2021

    5.3. Current and Future Market Size Value (US$ Million) & Volume (UNITS) Analysis and Forecast by Product Type, 2022 to 2032

        5.3.1. Mixers

        5.3.2. Mix-in Blenders

    5.4. Y-o-Y Growth Trend Analysis by Product Type, 2017 to 2021

    5.5. Absolute $ Opportunity Analysis by Product Type, 2022 to 2032

6. Global Analysis 2017 to 2021 and Forecast 2022 to 2032, By Operating Mode

    6.1. Introduction / Key Findings

    6.2. Historical Market Size Value (US$ Million) & Volume (UNITS) Analysis by Operating Mode, 2017 to 2021

    6.3. Current and Future Market Size Value (US$ Million) & Volume (UNITS) Analysis and Forecast by Operating Mode, 2022 to 2032

        6.3.1. Manual

        6.3.2. Fully automated

        6.3.3. Semi- automated

    6.4. Y-o-Y Growth Trend Analysis by Operating Mode, 2017 to 2021

    6.5. Absolute $ Opportunity Analysis by Operating Mode, 2022 to 2032

7. Global Analysis 2017 to 2021 and Forecast 2022 to 2032, By Material

    7.1. Introduction / Key Findings

    7.2. Historical Market Size Value (US$ Million) & Volume (UNITS) Analysis by Material, 2017 to 2021

    7.3. Current and Future Market Size Value (US$ Million) & Volume (UNITS) Analysis and Forecast by Material, 2022 to 2032

        7.3.1. Stainless steel

        7.3.2. Polycarbonate

    7.4. Y-o-Y Growth Trend Analysis by Material, 2017 to 2021

    7.5. Absolute $ Opportunity Analysis by Material, 2022 to 2032

8. Global Analysis 2017 to 2021 and Forecast 2022 to 2032, By End User

    8.1. Introduction / Key Findings

    8.2. Historical Market Size Value (US$ Million) & Volume (UNITS) Analysis by End User, 2017 to 2021

    8.3. Current and Future Market Size Value (US$ Million) & Volume (UNITS) Analysis and Forecast by End User, 2022 to 2032

        8.3.1. Hotel and Restaurants

        8.3.2. Bakery

        8.3.3. Catering

        8.3.4. Household

        8.3.5. Cafes

    8.4. Y-o-Y Growth Trend Analysis by End User, 2017 to 2021

    8.5. Absolute $ Opportunity Analysis by End User, 2022 to 2032

9. Global Analysis 2017 to 2021 and Forecast 2022 to 2032, By Type

    9.1. Introduction / Key Findings

    9.2. Historical Market Size Value (US$ Million) & Volume (UNITS) Analysis by Type, 2017 to 2021

    9.3. Current and Future Market Size Value (US$ Million) & Volume (UNITS) Analysis and Forecast by Type, 2022 to 2032

        9.3.1. Single Spindle

        9.3.2. Double Spindle

        9.3.3. Triple Spindle

    9.4. Y-o-Y Growth Trend Analysis by Type, 2017 to 2021

    9.5. Absolute $ Opportunity Analysis by Type, 2022 to 2032

10. Global Analysis 2017 to 2021 and Forecast 2022 to 2032, By Operating Mode

    10.1. Introduction / Key Findings

    10.2. Historical Market Size Value (US$ Million) & Volume (UNITS) Analysis by Operating Mode, 2017 to 2021

    10.3. Current and Future Market Size Value (US$ Million) & Volume (UNITS) Analysis and Forecast by Operating Mode, 2022 to 2032

        10.3.1. Manual

        10.3.2. Semi – Automated

        10.3.3. Fully-Automated

    10.4. Y-o-Y Growth Trend Analysis by Operating Mode, 2017 to 2021

    10.5. Absolute $ Opportunity Analysis by Operating Mode, 2022 to 2032

11. Global Analysis 2017 to 2021 and Forecast 2022 to 2032, By Region

    11.1. Introduction

    11.2. Historical Market Size Value (US$ Million) & Volume (UNITS) Analysis by Region, 2017 to 2021

    11.3. Current Market Size Value (US$ Million) & Volume (UNITS) Analysis and Forecast by Region, 2022 to 2032

        11.3.1. North America

        11.3.2. Latin America

        11.3.3. Europe

        11.3.4. East Asia

        11.3.5. South Asia

        11.3.6. Oceania

        11.3.7. Middle East & Africa

    11.4. Market Attractiveness Analysis by Region

12. North America Analysis 2017 to 2021 and Forecast 2022 to 2032, By Country

    12.1. Historical Market Size Value (US$ Million) & Volume (UNITS) Trend Analysis by Market Taxonomy, 2017 to 2021

    12.2. Market Size Value (US$ Million) & Volume (UNITS) Forecast by Market Taxonomy, 2022 to 2032

        12.2.1. By Country

            12.2.1.1. United States

            12.2.1.2. Canada

        12.2.2. By Product Type

        12.2.3. By Operating Mode

        12.2.4. By Material

        12.2.5. By End User

        12.2.6. By Type

        12.2.7. By Operating Mode

    12.3. Market Attractiveness Analysis

        12.3.1. By Country

        12.3.2. By Product Type

        12.3.3. By Operating Mode

        12.3.4. By Material

        12.3.5. By End User

        12.3.6. By Type

        12.3.7. By Operating Mode

    12.4. Key Takeaways

13. Latin America Analysis 2017 to 2021 and Forecast 2022 to 2032, By Country

    13.1. Historical Market Size Value (US$ Million) & Volume (UNITS) Trend Analysis by Market Taxonomy, 2017 to 2021

    13.2. Market Size Value (US$ Million) & Volume (UNITS) Forecast by Market Taxonomy, 2022 to 2032

        13.2.1. By Country

            13.2.1.1. Brazil

            13.2.1.2. Mexico

            13.2.1.3. Argentina

            13.2.1.4. Chile

            13.2.1.5. Peru

            13.2.1.6. Rest of Latin America

        13.2.2. By Product Type

        13.2.3. By Operating Mode

        13.2.4. By Material

        13.2.5. By End User

        13.2.6. By Type

        13.2.7. By Operating Mode

    13.3. Market Attractiveness Analysis

        13.3.1. By Country

        13.3.2. By Product Type

        13.3.3. By Operating Mode

        13.3.4. By Material

        13.3.5. By End User

        13.3.6. By Type

        13.3.7. By Operating Mode

    13.4. Key Takeaways

14. Europe Analysis 2017 to 2021 and Forecast 2022 to 2032, By Country

    14.1. Historical Market Size Value (US$ Million) & Volume (UNITS) Trend Analysis by Market Taxonomy, 2017 to 2021

    14.2. Market Size Value (US$ Million) & Volume (UNITS) Forecast by Market Taxonomy, 2022 to 2032

        14.2.1. By Country

            14.2.1.1. Germany

            14.2.1.2. Italy

            14.2.1.3. France

            14.2.1.4. United Kingdom

            14.2.1.5. Spain

            14.2.1.6. Russia

            14.2.1.7. BENELUX

            14.2.1.8. Poland

            14.2.1.9. Nordic Countries

            14.2.1.10. Rest of Europe

        14.2.2. By Product Type

        14.2.3. By Operating Mode

        14.2.4. By Material

        14.2.5. By End User

        14.2.6. By Type

        14.2.7. By Operating Mode

    14.3. Market Attractiveness Analysis

        14.3.1. By Country

        14.3.2. By Product Type

        14.3.3. By Operating Mode

        14.3.4. By Material

        14.3.5. By End User

        14.3.6. By Type

        14.3.7. By Operating Mode

    14.4. Key Takeaways

15. East Asia Analysis 2017 to 2021 and Forecast 2022 to 2032, By Country

    15.1. Historical Market Size Value (US$ Million) & Volume (UNITS) Trend Analysis by Market Taxonomy, 2017 to 2021

    15.2. Market Size Value (US$ Million) & Volume (UNITS) Forecast by Market Taxonomy, 2022 to 2032

        15.2.1. By Country

            15.2.1.1. China

            15.2.1.2. Japan

            15.2.1.3. South Korea

        15.2.2. By Product Type

        15.2.3. By Operating Mode

        15.2.4. By Material

        15.2.5. By End User

        15.2.6. By Type

        15.2.7. By Operating Mode

    15.3. Market Attractiveness Analysis

        15.3.1. By Country

        15.3.2. By Product Type

        15.3.3. By Operating Mode

        15.3.4. By Material

        15.3.5. By End User

        15.3.6. By Type

        15.3.7. By Operating Mode

    15.4. Key Takeaways

16. South Asia Analysis 2017 to 2021 and Forecast 2022 to 2032, By Country

    16.1. Historical Market Size Value (US$ Million) & Volume (UNITS) Trend Analysis by Market Taxonomy, 2017 to 2021

    16.2. Market Size Value (US$ Million) & Volume (UNITS) Forecast by Market Taxonomy, 2022 to 2032

        16.2.1. By Country

            16.2.1.1. India

            16.2.1.2. Thailand

            16.2.1.3. Malaysia

            16.2.1.4. Indonesia

            16.2.1.5. Singapore

            16.2.1.6. Rest of South Asia

        16.2.2. By Product Type

        16.2.3. By Operating Mode

        16.2.4. By Material

        16.2.5. By End User

        16.2.6. By Type

        16.2.7. By Operating Mode

    16.3. Market Attractiveness Analysis

        16.3.1. By Country

        16.3.2. By Product Type

        16.3.3. By Operating Mode

        16.3.4. By Material

        16.3.5. By End User

        16.3.6. By Type

        16.3.7. By Operating Mode

    16.4. Key Takeaways

17. Oceania Analysis 2017 to 2021 and Forecast 2022 to 2032, By Country

    17.1. Historical Market Size Value (US$ Million) & Volume (UNITS) Trend Analysis by Market Taxonomy, 2017 to 2021

    17.2. Market Size Value (US$ Million) & Volume (UNITS) Forecast by Market Taxonomy, 2022 to 2032

        17.2.1. By Country

            17.2.1.1. Australia

            17.2.1.2. New Zealand

        17.2.2. By Product Type

        17.2.3. By Operating Mode

        17.2.4. By Material

        17.2.5. By End User

        17.2.6. By Type

        17.2.7. By Operating Mode

    17.3. Market Attractiveness Analysis

        17.3.1. By Country

        17.3.2. By Product Type

        17.3.3. By Operating Mode

        17.3.4. By Material

        17.3.5. By End User

        17.3.6. By Type

        17.3.7. By Operating Mode

    17.4. Key Takeaways

18. Middle East & Africa Analysis 2017 to 2021 and Forecast 2022 to 2032, By Country

    18.1. Historical Market Size Value (US$ Million) & Volume (UNITS) Trend Analysis by Market Taxonomy, 2017 to 2021

    18.2. Market Size Value (US$ Million) & Volume (UNITS) Forecast by Market Taxonomy, 2022 to 2032

        18.2.1. By Country

            18.2.1.1. GCC Countries

            18.2.1.2. South Africa

            18.2.1.3. Central Africa

            18.2.1.4. North Africa

        18.2.2. By Product Type

        18.2.3. By Operating Mode

        18.2.4. By Material

        18.2.5. By End User

        18.2.6. By Type

        18.2.7. By Operating Mode

    18.3. Market Attractiveness Analysis

        18.3.1. By Country

        18.3.2. By Product Type

        18.3.3. By Operating Mode

        18.3.4. By Material

        18.3.5. By End User

        18.3.6. By Type

        18.3.7. By Operating Mode

    18.4. Key Takeaways

19. Key Countries Analysis

    19.1. United States

        19.1.1. Pricing Analysis

        19.1.2. Market Share Analysis, 2022

            19.1.2.1. By Product Type

            19.1.2.2. By Operating Mode

            19.1.2.3. By Material

            19.1.2.4. By End User

            19.1.2.5. By Type

            19.1.2.6. By Operating Mode

    19.2. Canada

        19.2.1. Pricing Analysis

        19.2.2. Market Share Analysis, 2022

            19.2.2.1. By Product Type

            19.2.2.2. By Operating Mode

            19.2.2.3. By Material

            19.2.2.4. By End User

            19.2.2.5. By Type

            19.2.2.6. By Operating Mode

    19.3. Brazil

        19.3.1. Pricing Analysis

        19.3.2. Market Share Analysis, 2022

            19.3.2.1. By Product Type

            19.3.2.2. By Operating Mode

            19.3.2.3. By Material

            19.3.2.4. By End User

            19.3.2.5. By Type

            19.3.2.6. By Operating Mode

    19.4. Mexico

        19.4.1. Pricing Analysis

        19.4.2. Market Share Analysis, 2022

            19.4.2.1. By Product Type

            19.4.2.2. By Operating Mode

            19.4.2.3. By Material

            19.4.2.4. By End User

            19.4.2.5. By Type

            19.4.2.6. By Operating Mode

    19.5. Argentina

        19.5.1. Pricing Analysis

        19.5.2. Market Share Analysis, 2022

            19.5.2.1. By Product Type

            19.5.2.2. By Operating Mode

            19.5.2.3. By Material

            19.5.2.4. By End User

            19.5.2.5. By Type

            19.5.2.6. By Operating Mode

    19.6. Chile

        19.6.1. Pricing Analysis

        19.6.2. Market Share Analysis, 2022

            19.6.2.1. By Product Type

            19.6.2.2. By Operating Mode

            19.6.2.3. By Material

            19.6.2.4. By End User

            19.6.2.5. By Type

            19.6.2.6. By Operating Mode

    19.7. Peru

        19.7.1. Pricing Analysis

        19.7.2. Market Share Analysis, 2022

            19.7.2.1. By Product Type

            19.7.2.2. By Operating Mode

            19.7.2.3. By Material

            19.7.2.4. By End User

            19.7.2.5. By Type

            19.7.2.6. By Operating Mode

    19.8. Germany

        19.8.1. Pricing Analysis

        19.8.2. Market Share Analysis, 2022

            19.8.2.1. By Product Type

            19.8.2.2. By Operating Mode

            19.8.2.3. By Material

            19.8.2.4. By End User

            19.8.2.5. By Type

            19.8.2.6. By Operating Mode

    19.9. Italy

        19.9.1. Pricing Analysis

        19.9.2. Market Share Analysis, 2022

            19.9.2.1. By Product Type

            19.9.2.2. By Operating Mode

            19.9.2.3. By Material

            19.9.2.4. By End User

            19.9.2.5. By Type

            19.9.2.6. By Operating Mode

    19.10. France

        19.10.1. Pricing Analysis

        19.10.2. Market Share Analysis, 2022

            19.10.2.1. By Product Type

            19.10.2.2. By Operating Mode

            19.10.2.3. By Material

            19.10.2.4. By End User

            19.10.2.5. By Type

            19.10.2.6. By Operating Mode

    19.11. Spain

        19.11.1. Pricing Analysis

        19.11.2. Market Share Analysis, 2022

            19.11.2.1. By Product Type

            19.11.2.2. By Operating Mode

            19.11.2.3. By Material

            19.11.2.4. By End User

            19.11.2.5. By Type

            19.11.2.6. By Operating Mode

    19.12. United Kingdom

        19.12.1. Pricing Analysis

        19.12.2. Market Share Analysis, 2022

            19.12.2.1. By Product Type

            19.12.2.2. By Operating Mode

            19.12.2.3. By Material

            19.12.2.4. By End User

            19.12.2.5. By Type

            19.12.2.6. By Operating Mode

    19.13. Russia

        19.13.1. Pricing Analysis

        19.13.2. Market Share Analysis, 2022

            19.13.2.1. By Product Type

            19.13.2.2. By Operating Mode

            19.13.2.3. By Material

            19.13.2.4. By End User

            19.13.2.5. By Type

            19.13.2.6. By Operating Mode

    19.14. Poland

        19.14.1. Pricing Analysis

        19.14.2. Market Share Analysis, 2022

            19.14.2.1. By Product Type

            19.14.2.2. By Operating Mode

            19.14.2.3. By Material

            19.14.2.4. By End User

            19.14.2.5. By Type

            19.14.2.6. By Operating Mode

    19.15. BENELUX

        19.15.1. Pricing Analysis

        19.15.2. Market Share Analysis, 2022

            19.15.2.1. By Product Type

            19.15.2.2. By Operating Mode

            19.15.2.3. By Material

            19.15.2.4. By End User

            19.15.2.5. By Type

            19.15.2.6. By Operating Mode

    19.16. Nordic Countries

        19.16.1. Pricing Analysis

        19.16.2. Market Share Analysis, 2022

            19.16.2.1. By Product Type

            19.16.2.2. By Operating Mode

            19.16.2.3. By Material

            19.16.2.4. By End User

            19.16.2.5. By Type

            19.16.2.6. By Operating Mode

    19.17. China

        19.17.1. Pricing Analysis

        19.17.2. Market Share Analysis, 2022

            19.17.2.1. By Product Type

            19.17.2.2. By Operating Mode

            19.17.2.3. By Material

            19.17.2.4. By End User

            19.17.2.5. By Type

            19.17.2.6. By Operating Mode

    19.18. Japan

        19.18.1. Pricing Analysis

        19.18.2. Market Share Analysis, 2022

            19.18.2.1. By Product Type

            19.18.2.2. By Operating Mode

            19.18.2.3. By Material

            19.18.2.4. By End User

            19.18.2.5. By Type

            19.18.2.6. By Operating Mode

    19.19. South Korea

        19.19.1. Pricing Analysis

        19.19.2. Market Share Analysis, 2022

            19.19.2.1. By Product Type

            19.19.2.2. By Operating Mode

            19.19.2.3. By Material

            19.19.2.4. By End User

            19.19.2.5. By Type

            19.19.2.6. By Operating Mode

    19.20. India

        19.20.1. Pricing Analysis

        19.20.2. Market Share Analysis, 2022

            19.20.2.1. By Product Type

            19.20.2.2. By Operating Mode

            19.20.2.3. By Material

            19.20.2.4. By End User

            19.20.2.5. By Type

            19.20.2.6. By Operating Mode

    19.21. Thailand

        19.21.1. Pricing Analysis

        19.21.2. Market Share Analysis, 2022

            19.21.2.1. By Product Type

            19.21.2.2. By Operating Mode

            19.21.2.3. By Material

            19.21.2.4. By End User

            19.21.2.5. By Type

            19.21.2.6. By Operating Mode

    19.22. Indonesia

        19.22.1. Pricing Analysis

        19.22.2. Market Share Analysis, 2022

            19.22.2.1. By Product Type

            19.22.2.2. By Operating Mode

            19.22.2.3. By Material

            19.22.2.4. By End User

            19.22.2.5. By Type

            19.22.2.6. By Operating Mode

    19.23. Malaysia

        19.23.1. Pricing Analysis

        19.23.2. Market Share Analysis, 2022

            19.23.2.1. By Product Type

            19.23.2.2. By Operating Mode

            19.23.2.3. By Material

            19.23.2.4. By End User

            19.23.2.5. By Type

            19.23.2.6. By Operating Mode

    19.24. Singapore

        19.24.1. Pricing Analysis

        19.24.2. Market Share Analysis, 2022

            19.24.2.1. By Product Type

            19.24.2.2. By Operating Mode

            19.24.2.3. By Material

            19.24.2.4. By End User

            19.24.2.5. By Type

            19.24.2.6. By Operating Mode

    19.25. Australia

        19.25.1. Pricing Analysis

        19.25.2. Market Share Analysis, 2022

            19.25.2.1. By Product Type

            19.25.2.2. By Operating Mode

            19.25.2.3. By Material

            19.25.2.4. By End User

            19.25.2.5. By Type

            19.25.2.6. By Operating Mode

    19.26. New Zealand

        19.26.1. Pricing Analysis

        19.26.2. Market Share Analysis, 2022

            19.26.2.1. By Product Type

            19.26.2.2. By Operating Mode

            19.26.2.3. By Material

            19.26.2.4. By End User

            19.26.2.5. By Type

            19.26.2.6. By Operating Mode

    19.27. GCC Countries

        19.27.1. Pricing Analysis

        19.27.2. Market Share Analysis, 2022

            19.27.2.1. By Product Type

            19.27.2.2. By Operating Mode

            19.27.2.3. By Material

            19.27.2.4. By End User

            19.27.2.5. By Type

            19.27.2.6. By Operating Mode

    19.28. South Africa

        19.28.1. Pricing Analysis

        19.28.2. Market Share Analysis, 2022

            19.28.2.1. By Product Type

            19.28.2.2. By Operating Mode

            19.28.2.3. By Material

            19.28.2.4. By End User

            19.28.2.5. By Type

            19.28.2.6. By Operating Mode

    19.29. North Africa

        19.29.1. Pricing Analysis

        19.29.2. Market Share Analysis, 2022

            19.29.2.1. By Product Type

            19.29.2.2. By Operating Mode

            19.29.2.3. By Material

            19.29.2.4. By End User

            19.29.2.5. By Type

            19.29.2.6. By Operating Mode

    19.30. Central Africa

        19.30.1. Pricing Analysis

        19.30.2. Market Share Analysis, 2022

            19.30.2.1. By Product Type

            19.30.2.2. By Operating Mode

            19.30.2.3. By Material

            19.30.2.4. By End User

            19.30.2.5. By Type

            19.30.2.6. By Operating Mode

20. Market Structure Analysis

    20.1. Competition Dashboard

    20.2. Competition Benchmarking

    20.3. Market Share Analysis of Top Players

        20.3.1. By Regional

        20.3.2. By Product Type

        20.3.3. By Operating Mode

        20.3.4. By Material

        20.3.5. By End User

        20.3.6. By Type

        20.3.7. By Operating Mode

21. Competition Analysis

    21.1. Competition Deep Dive

        21.1.1. Hitachi Ltd

            21.1.1.1. Overview

            21.1.1.2. Product Portfolio

            21.1.1.3. Profitability by Market Segments (Product Type/Material /Type/Operating Mode/End User/Region)

            21.1.1.4. Sales Footprint

            21.1.1.5. Strategy Overview

                21.1.1.5.1. Marketing Strategy

                21.1.1.5.2. Product Strategy

                21.1.1.5.3. Channel Strategy

        21.1.2. Apple Inc.

            21.1.2.1. Overview

            21.1.2.2. Product Portfolio

            21.1.2.3. Profitability by Market Segments (Product Type/Material /Type/Operating Mode/End User/Region)

            21.1.2.4. Sales Footprint

            21.1.2.5. Strategy Overview

                21.1.2.5.1. Marketing Strategy

                21.1.2.5.2. Product Strategy

                21.1.2.5.3. Channel Strategy

        21.1.3. Panasonic Corporation

            21.1.3.1. Overview

            21.1.3.2. Product Portfolio

            21.1.3.3. Profitability by Market Segments (Product Type/Material /Type/Operating Mode/End User/Region)

            21.1.3.4. Sales Footprint

            21.1.3.5. Strategy Overview

                21.1.3.5.1. Marketing Strategy

                21.1.3.5.2. Product Strategy

                21.1.3.5.3. Channel Strategy

        21.1.4. Ali Group Srl

            21.1.4.1. Overview

            21.1.4.2. Product Portfolio

            21.1.4.3. Profitability by Market Segments (Product Type/Material /Type/Operating Mode/End User/Region)

            21.1.4.4. Sales Footprint

            21.1.4.5. Strategy Overview

                21.1.4.5.1. Marketing Strategy

                21.1.4.5.2. Product Strategy

                21.1.4.5.3. Channel Strategy

        21.1.5. Hamilton Beach Brands Holding Co.

            21.1.5.1. Overview

            21.1.5.2. Product Portfolio

            21.1.5.3. Profitability by Market Segments (Product Type/Material /Type/Operating Mode/End User/Region)

            21.1.5.4. Sales Footprint

            21.1.5.5. Strategy Overview

                21.1.5.5.1. Marketing Strategy

                21.1.5.5.2. Product Strategy

                21.1.5.5.3. Channel Strategy

        21.1.6. Vita-Mix Corp.

            21.1.6.1. Overview

            21.1.6.2. Product Portfolio

            21.1.6.3. Profitability by Market Segments (Product Type/Material /Type/Operating Mode/End User/Region)

            21.1.6.4. Sales Footprint

            21.1.6.5. Strategy Overview

                21.1.6.5.1. Marketing Strategy

                21.1.6.5.2. Product Strategy

                21.1.6.5.3. Channel Strategy

        21.1.7. Amilton Beach Brands

            21.1.7.1. Overview

            21.1.7.2. Product Portfolio

            21.1.7.3. Profitability by Market Segments (Product Type/Material /Type/Operating Mode/End User/Region)

            21.1.7.4. Sales Footprint

            21.1.7.5. Strategy Overview

                21.1.7.5.1. Marketing Strategy

                21.1.7.5.2. Product Strategy

                21.1.7.5.3. Channel Strategy

        21.1.8. Electro Freeze

            21.1.8.1. Overview

            21.1.8.2. Product Portfolio

            21.1.8.3. Profitability by Market Segments (Product Type/Material /Type/Operating Mode/End User/Region)

            21.1.8.4. Sales Footprint

            21.1.8.5. Strategy Overview

                21.1.8.5.1. Marketing Strategy

                21.1.8.5.2. Product Strategy

                21.1.8.5.3. Channel Strategy

        21.1.9. Vita-Mix

            21.1.9.1. Overview

            21.1.9.2. Product Portfolio

            21.1.9.3. Profitability by Market Segments (Product Type/Material /Type/Operating Mode/End User/Region)

            21.1.9.4. Sales Footprint

            21.1.9.5. Strategy Overview

                21.1.9.5.1. Marketing Strategy

                21.1.9.5.2. Product Strategy

                21.1.9.5.3. Channel Strategy

        21.1.10. Ceado

            21.1.10.1. Overview

            21.1.10.2. Product Portfolio

            21.1.10.3. Profitability by Market Segments (Product Type/Material /Type/Operating Mode/End User/Region)

            21.1.10.4. Sales Footprint

            21.1.10.5. Strategy Overview

                21.1.10.5.1. Marketing Strategy

                21.1.10.5.2. Product Strategy

                21.1.10.5.3. Channel Strategy

        21.1.11. Federal Hospitality Equipment

            21.1.11.1. Overview

            21.1.11.2. Product Portfolio

            21.1.11.3. Profitability by Market Segments (Product Type/Material /Type/Operating Mode/End User/Region)

            21.1.11.4. Sales Footprint

            21.1.11.5. Strategy Overview

                21.1.11.5.1. Marketing Strategy

                21.1.11.5.2. Product Strategy

                21.1.11.5.3. Channel Strategy

        21.1.12. KitchenAid

            21.1.12.1. Overview

            21.1.12.2. Product Portfolio

            21.1.12.3. Profitability by Market Segments (Product Type/Material /Type/Operating Mode/End User/Region)

            21.1.12.4. Sales Footprint

            21.1.12.5. Strategy Overview

                21.1.12.5.1. Marketing Strategy

                21.1.12.5.2. Product Strategy

                21.1.12.5.3. Channel Strategy

22. Assumptions & Acronyms Used

23. Research Methodology
Recommendations

Food and Beverage

Milk Protein Market

June 2022

REP-GB-14909

April 2024

250 pages

Food and Beverage

Milk Powder Market

June 2022

REP-GB-14898

March 2024

325 pages

Process Automation

Milk Clarifier Market

December 2022

REP-GB-16196

250 pages

Packaging

Milk Powder Packaging Machines Market

September 2024

REP-GB-13484

Upcoming

Explore Process Automation Insights

View Reports
Future Market Insights

Electric Milkshake Machine Market