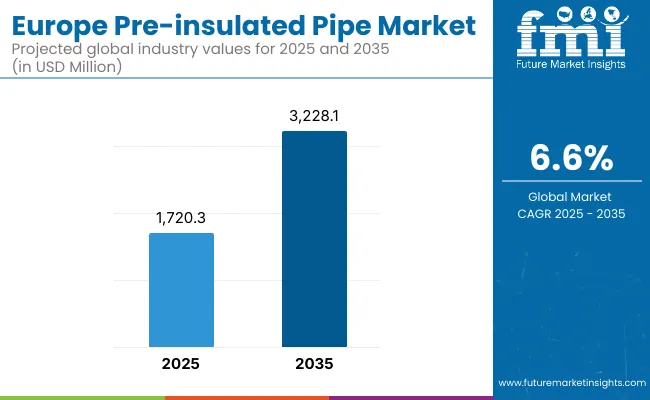
The European pre-insulated pipe market is expected to register steady growth, supported by rise in investments in district heating, industrial thermal transport, and sustainable building systems. These pipes have heating foam and protective jackets, reducing thermal loss and increasing energy efficiency for long-distance fluid transport networks. The market is expected to reach USD 3,228.1 million by 2035 from USD 1,720.3 million in 2025, growing at a CAGR of 6.6% during the forecast period.
As Europe shifts to greener infrastructure and climate-resilient heating solutions, pre-insulated pipes are becoming the cornerstone of district heating and cooling systems. These systems are popular for being durable, low maintenance and energy-saving. In Northern and Central Europe in particular, nations are targeting old pipelines for replacement with new lines that are modern and highly insulated. Use of pre-insulated pipe is also increasing in oil & gas, chemical processing, food manufacturing, and marine applications where controlled fluid temperature is important.
Advanced polyurethane and polyisocyanurate foam technologies are being developed by the manufacturers to improve thermal resistance, fire protection, and moisture barrier performance. Public infrastructure projects are increasingly integrating leak detection sensors and smart monitoring systems within pipe networks. The move to decarbonized heating and less carbon emissions is also fuelling innovation in recyclable and bio-based insulation systems aimed at circular economy models.
Metric Overview
Metric | Value |
---|---|
Market Size (2025E) | USD 1,720.3 million |
Market Value (2035F) | USD 3,228.1 million |
CAGR (2025 to 2035) | 6.6% |
Beyond this, pre-insulated pipe networks deliver long-term energy savings and carbon footprint reductions. We expect demand to be strong across new build, infrastructure retrofits, and renewable energy projects, most notably in relation to geothermal and biomass based heating systems.
Northern Europe already has an extensive district heating network, creating a mature, high-demand market for pre-insulated pipes. For instance, countries such as Sweden, Finland and Denmark are shifting into fourth-generation low-temperature heating networks with high-performance, thermally efficient pipe systems. The region focuses on corrosion resistance, leak detection technology and modular joint systems to address harsh winter conditions and extensive pipe runs in urban and rural environments.
Western Europe is ahead again due to their powerful regulatory benevolence toward energy efficiency and decarbonisation. Germany, France and Benelux are replacing old thermal infrastructure with modern high-insulation piping for district heat, cooling and industrial steam transport. Western Europe, for instance, has additionally invested heavily in innovation, such as recyclable insulation materials, pre-assembled pipe sections, and smart monitoring to prevent thermal loss.
The increasing demand for pre-insulated pipes across HVAC systems for buildings and renewable energy projects as well as agriculture-based heating applications in Southern Europe is a potential driving factor for the growth of the market. Countries such as Italy, Spain and Portugal are investing in biomass and solar-thermal integrated networks, where thermal efficiency and negligible maintenance are paramount. We’re seeing adoption grow in middle-market towns and eco-tourism projects, and more interest in modular, flexible pipe systems that can help implement decentralized energy grids.
Eastern Europe is updating much of its infrastructure, particularly the legacy district heating systems from the Soviet era. Countries like Poland, Romania and the Czech Republic are installing new polyurethane-insulated systems, abandoning older and less energy-efficient steel pipelines. The EU funds projects to modernise the region's infrastructure and reflects the growing need for cost-efficient solutions in the piping industry, combining heat retention and endurance.
Challenges
High Installation Costs and Complex Retrofitting
The initial cost of pre-insulated pipe systems (including the trenching, jointing, and insulation logistics) can be quite high, particularly for retrofits. Retrofitting urban heating systems is usually a challenge from technical perspective (e.g., physical route constraints, limited space, regulations). Likewise, lengthy procurement cycles and stringent certification requirements that are hallmarks of public infrastructure projects can significantly slow relative deployment timelines.
Opportunities
Green Heating Mandates and Technological Upgrades
Europe’s target for carbon neutrality is triggering solid prospects for pre-insulated pipe systems within both heating and cooling industries. Renewable-integrated pipe systems (which would be connected to biomass, solar thermal, or geothermal sources) are also catching on, as fossil-fuel-based heating is phased out. The demand for flexibility in the form of joint systems, corrosion-resistant jackets, and IoT-based thermal monitoring systems is on the rise. Modular, plug-and-play pipe sections are gaining ground, too, as a way to expedite installation and reduce service interruptions.
The European pre-insulated pipe market had a total revenue impact from 2020 to 2024, as well as during the period from 2020 to 2024, decreased by pandemic recovery funding, EU climate investments, and other factors that spurred demand for energy-efficient municipal heating. In smart cities, pilot projects incorporated sensor-embedded pipelines and hybrid insulation materials. The primary focus was on combating energy poverty, with incentives linked to urban retrofitting in low-income neighbourhoods.
From 2025 to 2035, the market will transition to next-gen pipe systems that target circularity and low-temp fluid transport. Integrated thermal sensors, remote asset monitoring and real-time energy analytics will be standard features of largescale installations. District cooling and co-gen networks will become more relevant in the high-density urban areas. In addition, industry attention will shift from public infrastructure to include high-efficiency, thermally managed industrial fluid distribution and cold chain logistics.
Market Shifts: A Comparative Analysis 2020 to 2024 vs. 2025 to 2035
Market Shift | 2020 to 2024 Trends |
---|---|
Technology Focus | PUR-foam insulation and steel/polymer jackets |
Demographic Penetration | Municipal and industrial retrofits |
Treatment Settings | Centralized district heating and industry |
Geographical Growth | Germany, Nordics, Poland |
Application Preference | Heating and industrial steam |
Cost Dynamics | CapEx -intensive projects, subsidy-backed |
Consumer Behaviour | Driven by regulatory compliance |
Service Model Evolution | Product and engineering contracts |
Market Shift | 2025 to 2035 Projections |
---|---|
Technology Focus | Bio-based foam, leak detection sensors, and smart pipe coatings |
Demographic Penetration | New smart city grids, mixed-use building heating systems |
Treatment Settings | Decentralized, hybrid heating and integrated HVAC systems |
Geographical Growth | France, Southern Europe, and Eastern EU expansion zones |
Application Preference | District cooling, geothermal, and low-temp energy transport |
Cost Dynamics | Leaner installation models with lifecycle cost focus |
Consumer Behaviour | Demand for energy efficiency, emissions tracking, and smart data |
Service Model Evolution | EPC + data integration, predictive maintenance partnerships |
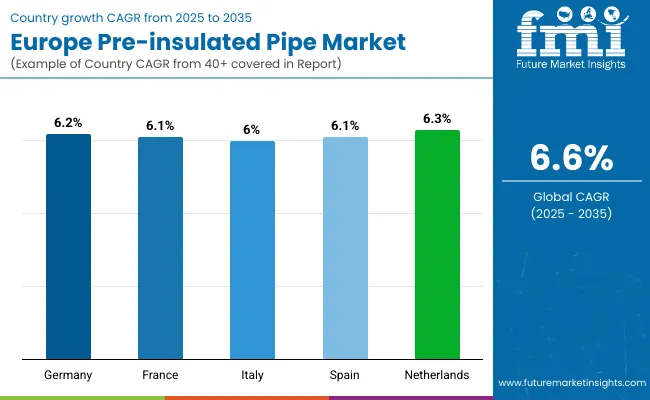
Germany is the dominant player in the Europe pre-insulated pipe market, bolstered by extensive district heating networks and challenging energy efficiency regulations. Retrofitting of older thermal grids and the growth of zero-energy buildings in the country is creating demand for pipes insulated with polyurethane and mineral wool. On the other hand, industrial users prefer thicker insulation variants for process heating and chilled water applications, as it assures minimum thermal loss.
Country | CAGR (2025 to 2035) |
---|---|
Germany | 6.2% |
The push towards decarbonisation in France governing the heating systems in buildings translated to greater investments in pre-insulated pipelines especially in urban renovation projects. In underground hot water and gas distribution, polyethylene and elastomeric foam insulated pipes are now being used. France will focus on phasing out fossil heating, which is expected accelerate deployment in new and replacement installations.
Country | CAGR (2025 to 2035) |
---|---|
France | 6.1% |
Growing investments in green building projects and energy-resilient infrastructure in Italy are further bolstering the demand growth for lightweight, corrosion-resistant pipe insulation. Most prefer phenolic foam and polypropylene variants because they perform well in high-humidity zones. In Europe, particularly in Italy, manufacturers are responding with customized thickness options for insulation to serve the varied needs of residential, commercial, and municipal needs.
Country | CAGR (2025 to 2035) |
---|---|
Italy | 6.0% |
The increased pressure for Spain to save energy in public and commercial structures is encouraging the use of pre-insulated piping for HVAC for district cooling. In coastal cities, elastomeric foam and glass wool are used in all-projects because they do not corrode in saline environment. The market is also being driven by government subsidies for schools, hospitals, and social housing to improve efficiency in heating.
Country | CAGR (2025 to 2035) |
---|---|
Spain | 6.1% |
Portugal is also slowly ramping up deployment of pre-insulated piping for geothermal and biomass-based heating networks. Aerogel and Mineral wool insulation is gaining a demand for high-performance energy projects. Urban heat loop installations in dense urban areas such as Amsterdam and Rotterdam have employed thinner insulation (0.5 to 1 inch), in order to reduce trench sizes as much as performance allows.
Country | CAGR (2025 to 2035) |
---|---|
Netherlands | 6.3% |
It breaks down the Europe pre-insulated pipe market into following segments - insulation material: polyethylene, polypropylene, polyurethane, phenolic foam, mineral wool (rock wool & slag wool), glass wool/fiberglass, elastomeric foam, aerogel, others insulation thickness - 0.1 to 0.5 Inch, 0.5 to 1 Inch, 1 to 2 Inch, 2 to 4 Inch Of these, polyurethane is still the preeminent material, given its unrivalled thermal conductivity and mechanical strength across use cases.
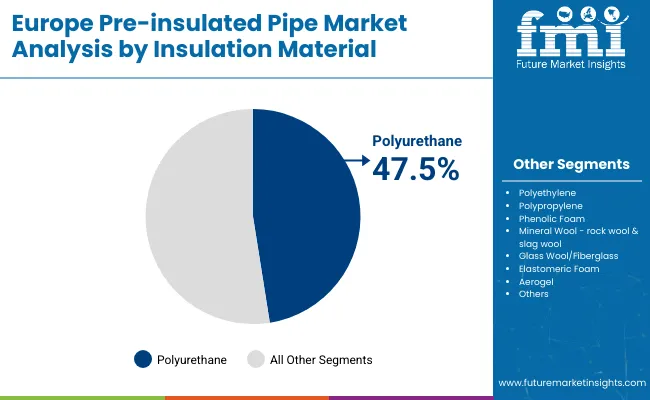
Insulation Material Segment | Market Share (2025) |
---|---|
Polyurethane | 47.5% |
Polyurethane is expected to lead with a 47.5% share in 2025. Polyurethane foam is the most-used material for hot water and steam systems, they are the most heat-insulated, and they have a long operational life because of underground conditions. Its ability to be used with steel and plastic pipe systems makes it even more attractive to energy, utility, and industrial customers.
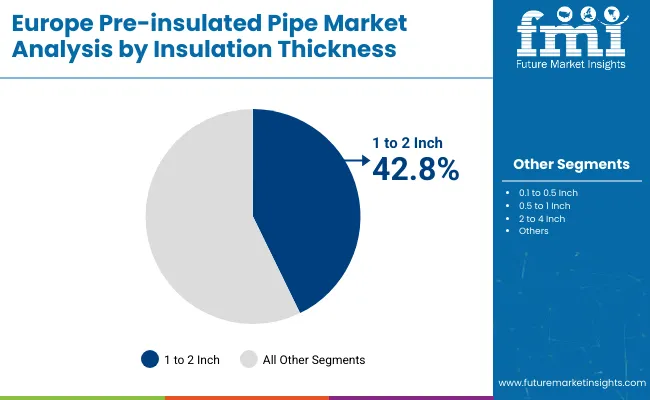
Insulation Thickness Segment | Market Share (2025) |
---|---|
1 to 2 Inch | 42.8% |
In 2025, insulation thickness of 1 to 2 inches will represent 42.8% of the market. This range is best suited for general-purpose applications such as building heating, chilled water transport, and integration of renewable energy systems. It will give best thermal resistance while having reasonable installation size and costs.
Facade systems to maintain insulation integrity and thermal performance offer significant thermal efficiency on the surface and are the key to being sustainable in commercial buildings, driving demand in the MMS market in Europe. Companies are launching corrosion-resistant outer casings, hybrid insulation materials, and intuitive monitoring interfaces for temperature and leakage control.
Tailor-made insulation solutions for municipal grids, renewable heating solutions, and industrial processes enable vendors to address rising energy transition targets. EN 253 and Euro class product certifications are still fundamental for marketability.
Market Share Analysis by Key Players
Company Name | Estimated Market Share (%) |
---|---|
LOGSTOR A/S | 18-21% |
Uponor Infra | 14-17% |
Thermaflex | 12-15% |
REHAU Group | 10-13% |
Others | 34-38% |
Company Name | Key Offerings/Activities |
---|---|
LOGSTOR A/S | In 2025 , launched Flextra Link ™, a smart-insulated district heating pipe with integrated temperature monitoring. |
Uponor Infra | In 2024 , introduced Ecoflex VIP, combining vacuum insulation panels with flexible casing for zero-energy buildings. |
Thermaflex | In 2025 , expanded its Flexalen range with bio-based foam and HDPE casing optimized for geothermal systems. |
REHAU Group | In 2024 , enhanced RAUVITHERM series with anti-UV outer jackets and advanced heat loss prevention layers. |
Key Market Insights
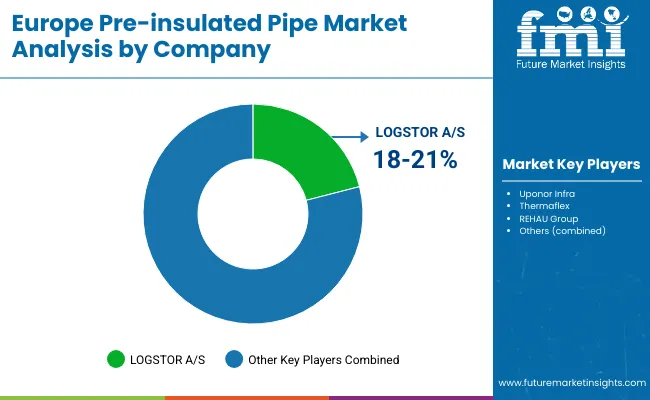
LOGSTOR A/S (18-21%)
LOGSTOR leads with pre-insulated pipe systems engineered for performance and longevity in European thermal networks. Its innovations in leak detection and digital monitoring make it the go-to partner for smart heating infrastructure across Northern and Central Europe.
Uponor Infra (14-17%)
Uponor Infra is well-known for modular pipe solutions designed for flexibility, ease of installation, and sustainability. Its Ecoflex product line is favored in new-build residential complexes and community heating systems.
Thermaflex (12-15%)
Thermaflex emphasizes eco-design, offering recyclable insulation with high-performance thermal retention. Its pre-insulated pipes are widely used in decentralized energy systems and biomass-powered heating grids across the EU.
REHAU Group (10-13%)
REHAU provides advanced polymer-based solutions combining thermal durability with mechanical strength. Its focus on energy efficiency and seamless integration in HVAC systems strengthens its position in retrofit and green building projects.
Other Key Players (34-38% Combined)
Table 01: Market Volume (000' Meters) Forecast By Insulation Material, 2018 to 2033
Table 02: Market Size Value (US$ million) Forecast By Insulation Material, 2018 to 2033
Table 03: Market Volume (000' Meters) and Value (US$ million) Forecast By Insulation Thickness, 2018 to 2033
Table 04: Market Size Volume (000' Meters) and Value (US$ million) Forecast By Configuration, 2018 to 2033
Table 05: Market Volume (000' Meters) Forecast By Pipe Outer Diameter, 2018 to 2033
Table 06: Market Size Value (US$ million) Forecast By Pipe Outer Diameter, 2018 to 2033
Table 07: Market Volume (000' Meters) and Value (US$ million) Forecast By Application, 2018 to 2033
Table 08: Market Volume (US$ million) Forecast By End Use, 2018 to 2033
Table 09: Market Value (000' Meters) Forecast By End Use, 2018 to 2033
Table 10: Market Size Volume (000' Meters) Forecast By Country, 2018 to 2033
Table 11: Market Size Value (US$ million) Forecast By Country, 2018 to 2033
Table 12: Germany Market Volume (000' Meters) Forecast By Insulation Material, 2018 to 2033
Table 13: Germany Market Size Value (US$ million) Forecast By Insulation Material, 2018 to 2033
Table 14: Germany Market Volume (000' Meters) and Value (US$ million) Forecast By Insulation Thickness, 2018 to 2033
Table 15: Germany Market Size Volume (000' Meters) and Value (US$ million) Forecast By Configuration, 2018 to 2033
Table 16: Germany Market Volume (000' Meters) Forecast By Pipe Outer Diameter, 2018 to 2033
Table 17: Germany Market Size Value (US$ million) Forecast By Pipe Outer Diameter, 2018 to 2033
Table 18: Germany Market Volume (000' Meters) and Value (US$ million) Forecast By Application, 2018 to 2033
Table 19: Germany Market Volume (000' Meters) Forecast By End Use, 2018 to 2033
Table 20: Germany Market Value (US$ million) Forecast By End Use, 2018 to 2033
Table 21: Italy Market Volume (000' Meters) Forecast By Insulation Material, 2018 to 2033
Table 22: Italy Market Size Value (US$ million) Forecast By Insulation Material, 2018 to 2033
Table 23: Italy Market Volume (000' Meters) and Value (US$ million) Forecast By Insulation Thickness, 2018 to 2033
Table 24: Italy Market Size Volume (000' Meters) and Value (US$ million) Forecast By Configuration, 2018 to 2033
Table 25: Italy Market Volume (000' Meters) Forecast By Pipe Outer Diameter, 2018 to 2033
Table 26: Italy Market Size Value (US$ million) Forecast By Pipe Outer Diameter, 2018 to 2033
Table 27: Italy Market Volume (000' Meters) and Value (US$ million) Forecast By Application, 2018 to 2033
Table 28: Italy Market Volume (000' Meters) Forecast By End Use, 2018 to 2033
Table 29: Italy Market Value (US$ million) Forecast By End Use, 2018 to 2033
Table 30: France Market Volume (000' Meters) Forecast By Insulation Material, 2018 to 2033
Table 31: France Market Size Value (US$ million) Forecast By Insulation Material, 2018 to 2033
Table 32: France Market Volume (000' Meters) and Value (US$ million) Forecast By Insulation Thickness, 2018 to 2033
Table 33: France Market Size Volume (000' Meters) and Value (US$ million) Forecast By Configuration, 2018 to 2033
Table 34: France Market Volume (000' Meters) Forecast By Pipe Outer Diameter, 2018 to 2033
Table 35: France Market Size Value (US$ million) Forecast By Pipe Outer Diameter, 2018 to 2033
Table 36: France Market Volume (000' Meters) and Value (US$ million) Forecast By Application, 2018 to 2033
Table 37: France Market Volume (000' Meters) Forecast By End Use, 2018 to 2033
Table 38: France Market Value (US$ million) Forecast By End Use, 2018 to 2033
Table 39: United Kingdom Market Volume (000' Meters) Forecast By Insulation Material, 2018 to 2033
Table 40: United Kingdom Market Size Value (US$ million) Forecast By Insulation Material, 2018 to 2033
Table 41: United Kingdom Market Volume (000' Meters) and Value (US$ million) Forecast By Insulation Thickness, 2018 to 2033
Table 42: United Kingdom Market Size Volume (000' Meters) and Value (US$ million) Forecast By Configuration, 2018 to 2033
Table 43: United Kingdom Market Volume (000' Meters) Forecast By Pipe Outer Diameter, 2018 to 2033
Table 44: United Kingdom Market Size Value (US$ million) Forecast By Pipe Outer Diameter, 2018 to 2033
Table 45: United Kingdom Market Volume (000' Meters) and Value (US$ million) Forecast By Application, 2018 to 2033
Table 46: United Kingdom Market Volume (000' Meters) Forecast By End Use, 2018 to 2033
Table 47: United Kingdom Market Value (US$ million) Forecast By End Use, 2018 to 2033
Table 48: Spain Market Volume (000' Meters) Forecast By Insulation Material, 2018 to 2033
Table 49: Spain Market Size Value (US$ million) Forecast By Insulation Material, 2018 to 2033
Table 50: Spain Market Volume (000' Meters) and Value (US$ million) Forecast By Insulation Thickness, 2018 to 2033
Table 51: Spain Market Size Volume (000' Meters) and Value (US$ million) Forecast By Configuration, 2018 to 2033
Table 52: Spain Market Volume (000' Meters) Forecast By Pipe Outer Diameter, 2018 to 2033
Table 53: Spain Market Size Value (US$ million) Forecast By Pipe Outer Diameter, 2018 to 2033
Table 54: Spain Market Volume (000' Meters) and Value (US$ million) Forecast By Application, 2018 to 2033
Table 55: Spain Market Volume (000' Meters) Forecast By End Use, 2018 to 2033
Table 56: Spain Market Value (US$ million) Forecast By End Use, 2018 to 2033
Table 57: BENELUX Market Volume (000' Meters) Forecast By Insulation Material, 2018 to 2033
Table 58: BENELUX Market Size Value (US$ million) Forecast By Insulation Material, 2018 to 2033
Table 59: BENELUX Market Volume (000' Meters) and Value (US$ million) Forecast By Insulation Thickness, 2018 to 2033
Table 60: BENELUX Market Size Volume (000' Meters) and Value (US$ million) Forecast By Configuration, 2018 to 2033
Table 61: BENELUX Market Volume (000' Meters) Forecast By Pipe Outer Diameter, 2018 to 2033
Table 62: BENELUX Market Size Value (US$ million) Forecast By Pipe Outer Diameter, 2018 to 2033
Table 63: BENELUX Market Volume (000' Meters) and Value (US$ million) Forecast By Application, 2018 to 2033
Table 64: BENELUX Market Volume (000' Meters) Forecast By End Use, 2018 to 2033
Table 65: BENELUX Market Value (US$ million) Forecast By End Use, 2018 to 2033
Table 66: NORDICS Market Volume (000' Meters) Forecast By Insulation Material, 2018 to 2033
Table 67: NORDICS Market Size Value (US$ million) Forecast By Insulation Material, 2018 to 2033
Table 68: NORDICS Market Volume (000' Meters) and Value (US$ million) Forecast By Insulation Thickness, 2018 to 2033
Table 69: NORDICS Market Size Volume (000' Meters) and Value (US$ million) Forecast By Configuration, 2018 to 2033
Table 70: NORDICS Market Volume (000' Meters) Forecast By Pipe Outer Diameter, 2018 to 2033
Table 71: NORDICS Market Size Value (US$ million) Forecast By Pipe Outer Diameter, 2018 to 2033
Table 72: NORDICS Market Volume (000' Meters) and Value (US$ million) Forecast By Application, 2018 to 2033
Table 73: NORDICS Market Volume (000' Meters) Forecast By End Use, 2018 to 2033
Table 74: NORDICS Market Value (US$ million) Forecast By End Use, 2018 to 2033
Table 75: Russia Market Volume (000' Meters) Forecast By Insulation Material, 2018 to 2033
Table 76: Russia Market Size Value (US$ million) Forecast By Insulation Material, 2018 to 2033
Table 77: Russia Market Volume (000' Meters) and Value (US$ million) Forecast By Insulation Thickness, 2018 to 2033
Table 78: Russia Market Size Volume (000' Meters) and Value (US$ million) Forecast By Configuration, 2018 to 2033
Table 79: Russia Market Volume (000' Meters) Forecast By Pipe Outer Diameter, 2018 to 2033
Table 80: Russia Market Size Value (US$ million) Forecast By Pipe Outer Diameter, 2018 to 2033
Table 81: Russia Market Volume (000' Meters) and Value (US$ million) Forecast By Application, 2018 to 2033
Table 82: Russia Market Volume (000' Meters) Forecast By End Use, 2018 to 2033
Table 83: Russia Market Value (US$ million) Forecast By End Use, 2018 to 2033
Table 84: Rest of Market Volume (000' Meters) Forecast By Insulation Material, 2018 to 2033
Table 85: Rest of Market Size Value (US$ million) Forecast By Insulation Material, 2018 to 2033
Table 86: Rest of Market Volume (000' Meters) and Value (US$ million) Forecast By Insulation Thickness, 2018 to 2033
Table 87: Rest of Market Size Volume (000' Meters) and Value (US$ million) Forecast By Configuration, 2018 to 2033
Table 88: Rest of Market Volume (000' Meters) Forecast By Pipe Outer Diameter, 2018 to 2033
Table 89: Rest of Market Size Value (US$ million) Forecast By Pipe Outer Diameter, 2018 to 2033
Table 90: Rest of Market Volume (000' Meters) and Value (US$ million) Forecast By Application, 2018 to 2033
Table 91: Rest of Market Volume (000' Meters) Forecast By End Use, 2018 to 2033
Table 92: Rest of Market Value (US$ million) Forecast By End Use, 2018 to 2033
Figure 01: Europe Pre-insulated Pipes) Market Historical Volume (000' Meters), 2018 to 2023
Figure 02: Market Current and Forecast Volume (000' Meters), 2023 to 2033
Figure 03: Market Historical Value (US$ million), 2018 to 2022
Figure 04: Market Current and Forecast Value (US$ million), 2023 to 2033
Figure 05: Market Incremental $ Opportunity (US$ million), 2023 to 2033
Figure 06: Market Share and BPS Analysis By Insulation Material– 2023 & 2033
Figure 07: Market Y-o-Y Growth Projections By Insulation Material, 2023 to 2033
Figure 08: Market Attractiveness Analysis By Insulation Material, 2023 to 2033
Figure 09: Market Absolute $ Opportunity by Polyethylene Segment, 2018 to 2033
Figure 10: Market Absolute $ Opportunity by Polypropylene Segment, 2018 to 2033
Figure 11: Market Absolute $ Opportunity by Polyurethane Segment, 2018 to 2033
Figure 12: Market Absolute $ Opportunity by Phenolic Foam Segment, 2018 to 2033
Figure 13: Market Absolute $ Opportunity by Mineral Wool Segment, 2018 to 2033
Figure 14: Market Absolute $ Opportunity by Glass Wool Foam Segment, 2018 to 2033
Figure 15: Market Absolute $ Opportunity by Elastomeric Foam Segment, 2018 to 2033
Figure 16: Market Absolute $ Opportunity by Aerogel Segment, 2018 to 2033
Figure 17: Market Absolute $ Opportunity by Others Segment, 2018 to 2033
Figure 18: Market Share and BPS Analysis By Insulation Thickness– 2023 & 2033
Figure 19: Market Y-o-Y Growth Projections By Insulation Thickness, 2023 to 2033
Figure 20: Market Attractiveness Analysis By Insulation Thickness, 2023 to 2033
Figure 21: Market Absolute $ Opportunity by 0.1 to 0.5-inch Segment, 2018 to 2033
Figure 22: Market Absolute $ Opportunity by 0.5 to 1-inch Segment, 2018 to 2033
Figure 23: Market Absolute $ Opportunity by 1 to 2-inch Segment, 2018 to 2033
Figure 24: Market Absolute $ Opportunity by 2 to 4-inch Segment, 2018 to 2033
Figure 25: Market Share and BPS Analysis By Configuration– 2023 & 2033
Figure 26: Market Y-o-Y Growth Projections By Configuration, 2023 to 2033
Figure 27: Market Attractiveness Analysis By Configuration, 2023 to 2033
Figure 28: Europe Market Absolute $ Opportunity by Single Pipe Segment
Figure 29: Market Absolute $ Opportunity by Twin Pipe Segment
Figure 30: Market Share and BPS Analysis By Pipe Outer Diameter– 2023 & 2033
Figure 31: Market Y-o-Y Growth Projections By Pipe Outer Diameter, 2023 to 2033
Figure 32: Market Attractiveness Analysis By Pipe Outer Diameter, 2023 to 2033
Figure 33: Market Absolute $ Opportunity by Up to 6 inch Segment, 2018 to 2033
Figure 34: Market Absolute $ Opportunity by 6 – 10 inch Segment, 2018 to 2033
Figure 35: Market Absolute $ Opportunity by 10 – 12 inch Segment, 2018 to 2033
Figure 36: Market Absolute $ Opportunity by 13 – 18 inch Segment, 2018 to 2033
Figure 37: Market Absolute $ Opportunity by 18 – 20 inch Segment, 2018 to 2033
Figure 38: Market Absolute $ Opportunity by 21 – 30 inch Segment, 2018 to 2033
Figure 39: Market Absolute $ Opportunity by Above 30 inch Segment, 2018 to 2033
Figure 40: Market Share and BPS Analysis By Application– 2023 & 2033
Figure 41: Market Y-o-Y Growth Projections By Application, 2023 to 2033
Figure 42: Market Attractiveness Analysis By Application, 2023 to 2033
Figure 43: Market Absolute $ Opportunity by HVAC Systems Segment, 2018 to 2033
Figure 44: Market Absolute $ Opportunity by Hot / Cold Water Piping Segment, 2018 to 2033
Figure 45: Market Absolute $ Opportunity by Fuel / Gas / Lubricant Piping Segment, 2018 to 2033
Figure 46: Market Absolute $ Opportunity by Process Industry Piping Segment, 2018 to 2033
Figure 47: Market Share and BPS Analysis By End Use– 2023 & 2033
Figure 48: Market Y-o-Y Growth Projections By End Use, 2023 to 2033
Figure 49: Market Attractiveness Analysis By End Use, 2023 to 2033
Figure 50: Market Absolute $ Opportunity by Industrial Segment, 2018 to 2033
Figure 51: Market Absolute $ Opportunity by Residential and Commercial HVAC Segment, 2018 to 2033
Figure 52: Market Absolute $ Opportunity by District Cooling & Heating Segment, 2018 to 2033
Figure 53: Market Absolute $ Opportunity by Civic Water Supply & Distribution Segment, 2018 to 2033
Figure 54: Market Share and BPS Analysis By Country– 2023 & 2033
Figure 55: Market Y-o-Y Growth Projections By Country, 2023 to 2033
Figure 56: Market Attractiveness Analysis By Country, 2023 to 2033
Figure 57: Market Absolute $ Opportunity by Germany Segment, 2018 to 2033
Figure 58: Market Absolute $ Opportunity by Italy Segment, 2018 to 2033
Figure 59: Market Absolute $ Opportunity by France Segment, 2018 to 2033
Figure 60: Market Absolute $ Opportunity by United Kingdom Segment, 2018 to 2033
Figure 61: Market Absolute $ Opportunity by Spain Segment, 2018 to 2033
Figure 62: Market Absolute $ Opportunity by BENELUX Segment, 2018 to 2033
Figure 63: Market Absolute $ Opportunity by NORDICS Segment, 2018 to 2033
Figure 64: Market Absolute $ Opportunity by Russia Segment, 2018 to 2033
Figure 65: Market Absolute $ Opportunity by Rest of Europe Segment, 2018 to 2033
Figure 66: Germany Market Share and BPS Analysis By Insulation Material– 2023 & 2033
Figure 67: Germany Market Y-o-Y Growth Projections By Insulation Material, 2023 to 2033
Figure 68: Germany Market Attractiveness Analysis By Insulation Material, 2023 to 2033
Figure 69: Germany Market Share and BPS Analysis By Insulation Thickness– 2023 & 2033
Figure 70: Germany Market Y-o-Y Growth Projections By Insulation Thickness, 2023 to 2033
Figure 71: Germany Market Attractiveness Analysis By Insulation Thickness, 2023 to 2033
Figure 72: Germany Market Share and BPS Analysis By Configuration– 2023 & 2033
Figure 73: Germany Market Y-o-Y Growth Projections By Configuration, 2023 to 2033
Figure 74: Germany Market Attractiveness Analysis By Configuration, 2023 to 2033
Figure 75: Germany Market Share and BPS Analysis By Pipe Outer Diameter– 2023 & 2033
Figure 76: Germany Market Y-o-Y Growth Projections By Pipe Outer Diameter, 2023 to 2033
Figure 77: Germany Market Attractiveness Analysis By Pipe Outer Diameter, 2023 to 2033
Figure 78: Germany Market Share and BPS Analysis By Application– 2023 & 2033
Figure 79: Germany Market Y-o-Y Growth Projections By Application, 2023 to 2033
Figure 80: Germany Market Attractiveness Analysis By Application, 2023 to 2033
Figure 81: Germany Market Share and BPS Analysis By End Use– 2023 & 2033
Figure 82: Germany Market Y-o-Y Growth Projections By End Use, 2023 to 2033
Figure 83: Germany Market Attractiveness Analysis By End Use, 2023 to 2033
Figure 84: Italy Market Share and BPS Analysis By Insulation Material– 2023 & 2033
Figure 85: Italy Market Y-o-Y Growth Projections By Insulation Material, 2023 to 2033
Figure 86: Italy Market Attractiveness Analysis By Insulation Material, 2023 to 2033
Figure 87: Italy Market Share and BPS Analysis By Insulation Thickness– 2023 & 2033
Figure 88: Italy Market Y-o-Y Growth Projections By Insulation Thickness, 2023 to 2033
Figure 89: Italy Market Attractiveness Analysis By Insulation Thickness, 2023 to 2033
Figure 90: Italy Market Share and BPS Analysis By Configuration– 2023 & 2033
Figure 91: Italy Market Y-o-Y Growth Projections By Configuration, 2023 to 2033
Figure 92: Italy Market Attractiveness Analysis By Configuration, 2023 to 2033
Figure 93: Italy Market Share and BPS Analysis By Pipe Outer Diameter– 2023 & 2033
Figure 94: Italy Market Y-o-Y Growth Projections By Pipe Outer Diameter, 2023 to 2033
Figure 95: Italy Market Attractiveness Analysis By Pipe Outer Diameter, 2023 to 2033
Figure 96: Italy Market Share and BPS Analysis By Application– 2023 & 2033
Figure 97: Italy Market Y-o-Y Growth Projections By Application, 2023 to 2033
Figure 98: Italy Market Attractiveness Analysis By Application, 2023 to 2033
Figure 99: Italy Market Share and BPS Analysis By End Use– 2023 & 2033
Figure 100: Italy Market Y-o-Y Growth Projections By End Use, 2023 to 2033
Figure 101: Italy Market Attractiveness Analysis By End Use, 2023 to 2033
Figure 102: France Market Share and BPS Analysis By Insulation Material– 2023 & 2033
Figure 103: France Market Y-o-Y Growth Projections By Insulation Material, 2023 to 2033
Figure 104: France Market Attractiveness Analysis By Insulation Material, 2023 to 2033
Figure 105: France Market Share and BPS Analysis By Insulation Thickness– 2023 & 2033
Figure 106: France Market Y-o-Y Growth Projections By Insulation Thickness, 2023 to 2033
Figure 107: France Market Attractiveness Analysis By Insulation Thickness, 2023 to 2033
Figure 108: France Market Share and BPS Analysis By Configuration– 2023 & 2033
Figure 109: France Market Y-o-Y Growth Projections By Configuration, 2023 to 2033
Figure 110: France Market Attractiveness Analysis By Configuration, 2023 to 2033
Figure 111: France Market Share and BPS Analysis By Pipe Outer Diameter– 2023 & 2033
Figure 112: France Market Y-o-Y Growth Projections By Pipe Outer Diameter, 2023 to 2033
Figure 113: France Market Attractiveness Analysis By Pipe Outer Diameter, 2023 to 2033
Figure 114: France Market Share and BPS Analysis By Application– 2023 & 2033
Figure 115: France Market Y-o-Y Growth Projections By Application, 2023 to 2033
Figure 116: France Market Attractiveness Analysis By Application, 2023 to 2033
Figure 117: France Market Share and BPS Analysis By End Use– 2023 & 2033
Figure 118: France Market Y-o-Y Growth Projections By End Use, 2023 to 2033
Figure 119: France Market Attractiveness Analysis By End Use, 2023 to 2033
Figure 120: United Kingdom Market Share and BPS Analysis By Insulation Material– 2023 & 2033
Figure 121: United Kingdom Market Y-o-Y Growth Projections By Insulation Material, 2023 to 2033
Figure 122: United Kingdom Market Attractiveness Analysis By Insulation Material, 2023 to 2033
Figure 123: United Kingdom Market Share and BPS Analysis By Insulation Thickness– 2023 & 2033
Figure 124: United Kingdom Market Y-o-Y Growth Projections By Insulation Thickness, 2023 to 2033
Figure 125: United Kingdom Market Attractiveness Analysis By Insulation Thickness, 2023 to 2033
Figure 126: United Kingdom Market Share and BPS Analysis By Configuration– 2023 & 2033
Figure 127: United Kingdom Market Y-o-Y Growth Projections By Configuration, 2023 to 2033
Figure 128: United Kingdom Market Attractiveness Analysis By Configuration, 2023 to 2033
Figure 129: United Kingdom Market Share and BPS Analysis By Pipe Outer Diameter– 2023 & 2033
Figure 130: United Kingdom Market Y-o-Y Growth Projections By Pipe Outer Diameter, 2023 to 2033
Figure 131: United Kingdom Market Attractiveness Analysis By Pipe Outer Diameter, 2023 to 2033
Figure 132: United Kingdom Market Share and BPS Analysis By Application– 2023 & 2033
Figure 133: United Kingdom Market Y-o-Y Growth Projections By Application, 2023 to 2033
Figure 134: United Kingdom Market Attractiveness Analysis By Application, 2023 to 2033
Figure 135: United Kingdom Market Share and BPS Analysis By End Use– 2023 & 2033
Figure 136: United Kingdom Market Y-o-Y Growth Projections By End Use, 2023 to 2033
Figure 137: United Kingdom Market Attractiveness Analysis By End Use, 2023 to 2033
Figure 138: Spain Market Share and BPS Analysis By Insulation Material– 2023 & 2033
Figure 139: Spain Market Y-o-Y Growth Projections By Insulation Material, 2023 to 2033
Figure 140: Spain Market Attractiveness Analysis By Insulation Material, 2023 to 2033
Figure 141: Spain Market Share and BPS Analysis By Insulation Thickness– 2023 & 2033
Figure 142: Spain Market Y-o-Y Growth Projections By Insulation Thickness, 2023 to 2033
Figure 143: Spain Market Attractiveness Analysis By Insulation Thickness, 2023 to 2033
Figure 144: Spain Market Share and BPS Analysis By Configuration– 2023 & 2033
Figure 145: Spain Market Y-o-Y Growth Projections By Configuration, 2023 to 2033
Figure 146: Spain Market Attractiveness Analysis By Configuration, 2023 to 2033
Figure 147: Spain Market Share and BPS Analysis By Pipe Outer Diameter– 2023 & 2033
Figure 148: Spain Market Y-o-Y Growth Projections By Pipe Outer Diameter, 2023 to 2033
Figure 149: Spain Market Attractiveness Analysis By Pipe Outer Diameter, 2023 to 2033
Figure 150: Spain Market Share and BPS Analysis By Application– 2023 & 2033
Figure 151: Spain Market Y-o-Y Growth Projections By Application, 2023 to 2033
Figure 152: Spain Market Attractiveness Analysis By Application, 2023 to 2033
Figure 153: Spain Market Share and BPS Analysis By End Use– 2023 & 2033
Figure 154: Spain Market Y-o-Y Growth Projections By End Use, 2023 to 2033
Figure 155: Spain Market Attractiveness Analysis By End Use, 2023 to 2033
Figure 156: BENELUX Market Share and BPS Analysis By Insulation Material– 2023 & 2033
Figure 157: BENELUX Market Y-o-Y Growth Projections By Insulation Material, 2023 to 2033
Figure 158: BENELUX Market Attractiveness Analysis By Insulation Material, 2023 to 2033
Figure 159: BENELUX Market Share and BPS Analysis By Insulation Thickness– 2023 & 2033
Figure 160: BENELUX Market Y-o-Y Growth Projections By Insulation Thickness, 2023 to 2033
Figure 161: BENELUX Market Attractiveness Analysis By Insulation Thickness, 2023 to 2033
Figure 162: BENELUX Market Share and BPS Analysis By Configuration– 2023 & 2033
Figure 163: BENELUX Market Y-o-Y Growth Projections By Configuration, 2023 to 2033
Figure 164: BENELUX Market Attractiveness Analysis By Configuration, 2023 to 2033
Figure 165: BENELUX Market Share and BPS Analysis By Pipe Outer Diameter– 2023 & 2033
Figure 166: BENELUX Market Y-o-Y Growth Projections By Pipe Outer Diameter, 2023 to 2033
Figure 167: BENELUX Market Attractiveness Analysis By Pipe Outer Diameter, 2023 to 2033
Figure 168: BENELUX Market Share and BPS Analysis By Application– 2023 & 2033
Figure 169: BENELUX Market Y-o-Y Growth Projections By Application, 2023 to 2033
Figure 170: BENELUX Market Attractiveness Analysis By Application, 2023 to 2033
Figure 171: BENELUX Market Share and BPS Analysis By End Use– 2023 & 2033
Figure 172: BENELUX Market Y-o-Y Growth Projections By End Use, 2023 to 2033
Figure 173: BENELUX Market Attractiveness Analysis By End Use, 2023 to 2033
Figure 174: NORDICS Market Share and BPS Analysis By Insulation Material– 2023 & 2033
Figure 175: NORDICS Market Y-o-Y Growth Projections By Insulation Material, 2023 to 2033
Figure 176: NORDICS Market Attractiveness Analysis By Insulation Material, 2023 to 2033
Figure 177: NORDICS Market Share and BPS Analysis By Insulation Thickness– 2023 & 2033
Figure 178: NORDICS Market Y-o-Y Growth Projections By Insulation Thickness, 2023 to 2033
Figure 179: NORDICS Market Attractiveness Analysis By Insulation Thickness, 2023 to 2033
Figure 180: NORDICS Market Share and BPS Analysis By Configuration– 2023 & 2033
Figure 181: NORDICS Market Y-o-Y Growth Projections By Configuration, 2023 to 2033
Figure 182: NORDICS Market Attractiveness Analysis By Configuration, 2023 to 2033
Figure 183: NORDICS Market Share and BPS Analysis By Pipe Outer Diameter– 2023 & 2033
Figure 184: NORDICS Market Y-o-Y Growth Projections By Pipe Outer Diameter, 2023 to 2033
Figure 185: NORDICS Market Attractiveness Analysis By Pipe Outer Diameter, 2023 to 2033
Figure 186: NORDICS Market Share and BPS Analysis By Application– 2023 & 2033
Figure 187: NORDICS Market Y-o-Y Growth Projections By Application, 2023 to 2033
Figure 188: NORDICS Market Attractiveness Analysis By Application, 2023 to 2033
Figure 189: NORDICS Market Share and BPS Analysis By End Use– 2023 & 2033
Figure 190: NORDICS Market Y-o-Y Growth Projections By End Use, 2023 to 2033
Figure 191: NORDICS Market Attractiveness Analysis By End Use, 2023 to 2033
Figure 192: Russia Market Share and BPS Analysis By Insulation Material– 2023 & 2033
Figure 193: Russia Market Y-o-Y Growth Projections By Insulation Material, 2023 to 2033
Figure 194: Russia Market Attractiveness Analysis By Insulation Material, 2023 to 2033
Figure 195: Russia Market Share and BPS Analysis By Insulation Thickness– 2023 & 2033
Figure 196: Russia Market Y-o-Y Growth Projections By Insulation Thickness, 2023 to 2033
Figure 197: Russia Market Attractiveness Analysis By Insulation Thickness, 2023 to 2033
Figure 198: Russia Market Share and BPS Analysis By Configuration– 2023 & 2033
Figure 199: Russia Market Y-o-Y Growth Projections By Configuration, 2023 to 2033
Figure 200: Russia Market Attractiveness Analysis By Configuration, 2023 to 2033
Figure 201: Russia Market Share and BPS Analysis By Pipe Outer Diameter– 2023 & 2033
Figure 202: Russia Market Y-o-Y Growth Projections By Pipe Outer Diameter, 2023 to 2033
Figure 203: Russia Market Attractiveness Analysis By Pipe Outer Diameter, 2023 to 2033
Figure 204: Russia Market Share and BPS Analysis By Application– 2023 & 2033
Figure 205: Russia Market Y-o-Y Growth Projections By Application, 2023 to 2033
Figure 206: Russia Market Attractiveness Analysis By Application, 2023 to 2033
Figure 207: Russia Market Share and BPS Analysis By End Use– 2023 & 2033
Figure 208: Russia Market Y-o-Y Growth Projections By End Use, 2023 to 2033
Figure 209: Russia Market Attractiveness Analysis By End Use, 2023 to 2033
Figure 210: Rest of Market Share and BPS Analysis By Insulation Material– 2023 & 2033
Figure 211: Rest of Market Y-o-Y Growth Projections By Insulation Material, 2023 to 2033
Figure 212: Rest of Market Attractiveness Analysis By Insulation Material, 2023 to 2033
Figure 213: Rest of Market Share and BPS Analysis By Insulation Thickness– 2023 & 2033
Figure 214: Rest of Market Y-o-Y Growth Projections By Insulation Thickness, 2023 to 2033
Figure 215: Rest of Market Attractiveness Analysis By Insulation Thickness, 2023 to 2033
Figure 216: Rest of Market Share and BPS Analysis By Configuration– 2023 & 2033
Figure 217: Rest of Market Y-o-Y Growth Projections By Configuration, 2023 to 2033
Figure 218: Rest of Market Attractiveness Analysis By Configuration, 2023 to 2033
Figure 219: Rest of Market Share and BPS Analysis By Pipe Outer Diameter– 2023 & 2033
Figure 220: Rest of Market Y-o-Y Growth Projections By Pipe Outer Diameter, 2023 to 2033
Figure 221: Rest of Market Attractiveness Analysis By Pipe Outer Diameter, 2023 to 2033
Figure 222: Rest of Market Share and BPS Analysis By Application– 2023 & 2033
Figure 223: Rest of Market Y-o-Y Growth Projections By Application, 2023 to 2033
Figure 224: Rest of Market Attractiveness Analysis By Application, 2023 to 2033
Figure 225: Rest of Market Share and BPS Analysis By End Use– 2023 & 2033
Figure 226: Rest of Market Y-o-Y Growth Projections By End Use, 2023 to 2033
Figure 227: Rest of Market Attractiveness Analysis By End Use, 2023 to 2033
The market size in 2025 was USD 1,720.3 million.
It is projected to reach USD 3,228.1 million by 2035.
The rise in investments in district heating, industrial thermal transport, and sustainable building systems will drive the demand for the pre-insulated pipe market in Europe.
The top contributors contributing to the pre-insulated pipe market in Europe are Germany, Sweden, France, Denmark, and Netherlands.
The Polyurethane segment is anticipated to dominate the pre-insulated pipe market in Europe.
Explore Automation Auxiliary Insights
Thank you!
You will receive an email from our Business Development Manager. Please be sure to check your SPAM/JUNK folder too.