The GaN Micro-LED Market is estimated to be valued at USD 1.6 billion in 2025 and is projected to reach USD 72.4 billion by 2035, registering a compound annual growth rate (CAGR) of 46.3% over the forecast period.
.webp)
The GaN Micro-LED market is expanding rapidly due to advancements in LED technology and increasing demand for high-performance display solutions. Industry trends point to growing applications in consumer electronics where compact, energy-efficient displays with superior brightness and color accuracy are highly valued. The development of GaN materials has enabled micro-LEDs to achieve higher output power while maintaining lower energy consumption, meeting the needs of next-generation displays.
As wearable devices, smartphones, and augmented reality products gain popularity, manufacturers are focusing on integrating GaN Micro-LED technology to enhance user experience. The market is also influenced by increasing investments in research and development, driving innovation in display functionalities and production scalability.
Growth is expected to be fueled by the rising adoption of High Power GaN Micro-LEDs, GaN Micro-LED displays, and expanding applications within the Consumer Electronics industry.
The market is segmented by Output Power, Function Type, and Industry and region. By Output Power, the market is divided into High Power GaN Micro-LED (1 to 6 W), Low Power GaN Micro-LED (0.15 to 0.7 W), Mid Power GaN Micro-LED (0.7 to 1 W), and Ultra-High Power GaN Micro-LED (>6 W). In terms of Function Type, the market is classified into GaN Micro-LED Display, Near to Eye Devices: AR & VR, Smartwatch, Television, Smartphones, Laptops, and GaN Micro-LED Lighting. Based on Industry, the market is segmented into Consumer Electronics, Automotive, Aerospace & Defense, Sports & Entertainment, Healthcare, and Others. Regionally, the market is classified into North America, Latin America, Western Europe, Eastern Europe, Balkan & Baltic Countries, Russia & Belarus, Central Asia, East Asia, South Asia & Pacific, and the Middle East & Africa.
The market is segmented by Output Power, Function Type, and Industry and region. By Output Power, the market is divided into High Power GaN Micro-LED (1 to 6 W), Low Power GaN Micro-LED (0.15 to 0.7 W), Mid Power GaN Micro-LED (0.7 to 1 W), and Ultra-High Power GaN Micro-LED (>6 W). In terms of Function Type, the market is classified into GaN Micro-LED Display, Near to Eye Devices: AR & VR, Smartwatch, Television, Smartphones, Laptops, and GaN Micro-LED Lighting. Based on Industry, the market is segmented into Consumer Electronics, Automotive, Aerospace & Defense, Sports & Entertainment, Healthcare, and Others. Regionally, the market is classified into North America, Latin America, Western Europe, Eastern Europe, Balkan & Baltic Countries, Russia & Belarus, Central Asia, East Asia, South Asia & Pacific, and the Middle East & Africa.
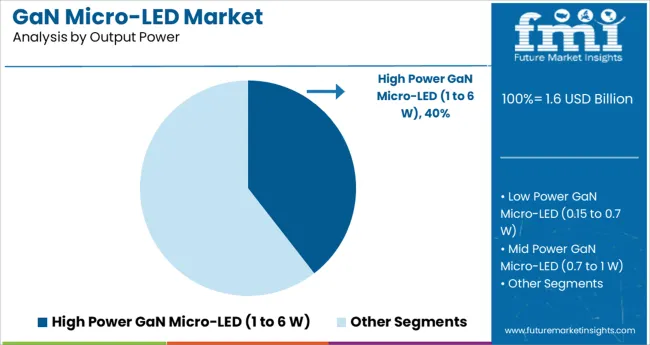
The High Power GaN Micro-LED segment, ranging from 1 to 6 watts, is projected to hold 39.5% of the market revenue in 2025. This segment has been driven by its ability to deliver superior brightness and efficiency necessary for high-end display applications. The higher output power range supports usage in devices requiring intense illumination without compromising energy efficiency or device lifespan.
The segment has seen increased adoption in products that demand clear visibility under varying lighting conditions. Manufacturers have favored this power range to meet stringent performance requirements in emerging display technologies.
As demand for bright and durable display panels continues, the high power segment is expected to retain its market leadership.
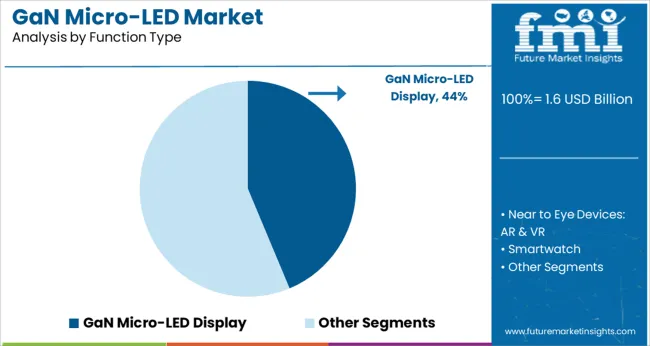
The GaN Micro-LED Display segment is expected to contribute 43.7% of the market revenue in 2025, maintaining its position as the dominant function type. This segment’s growth has been driven by the increasing demand for displays that offer enhanced color accuracy, contrast, and energy efficiency.
GaN Micro-LED displays are being integrated into various consumer electronics products due to their ability to provide vivid visuals with longer lifespans compared to traditional display technologies. The segment benefits from the scalability of micro-LED production and its compatibility with flexible and transparent display formats.
Increasing consumer preference for high-quality visual experiences in smartphones, televisions, and AR/VR devices supports the segment’s growth. With continuous advancements in display technology, this segment is expected to sustain its leading market share.
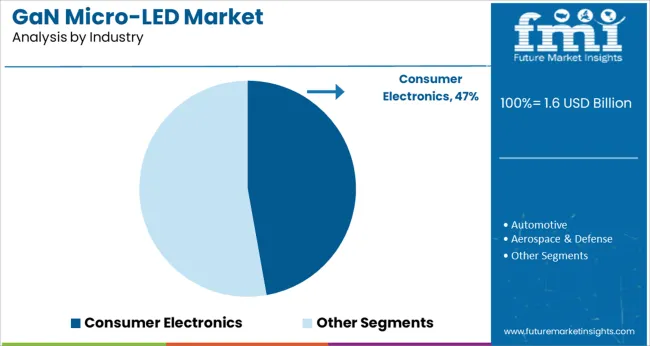
The Consumer Electronics segment is projected to account for 47.2% of the GaN Micro-LED market revenue in 2025, positioning it as the leading industry segment. This segment’s growth has been propelled by rising consumer demand for innovative, energy-efficient display technologies in smartphones, wearables, and smart home devices.
The integration of GaN Micro-LED technology enables manufacturers to deliver products with enhanced brightness, durability, and reduced power consumption, aligning with consumer expectations for premium device performance.
The growing adoption of smart devices and increasing penetration of AR and VR technologies have further fueled demand within this segment. As consumer electronics continue to evolve with a focus on display innovation, the GaN Micro-LED market within this industry is expected to maintain a strong growth trajectory.
Demand for video streaming, rise in infotainment systems in automobiles, surging trend in foldable display and flexible technologies, and consumers' demand for high-end home entertainment solutions are expected to fuel the GaN Micro-LED market growth during the forecast period.
It is highly likely that GaN Micro-LED will become a mainstream product soon owing to the pace at which technological advancements take place and consumer demand changes. Furthermore, demands stemming from newer consumers are expected to shape the growth trajectory of the global GaN Micro-LED market during the period of assessment.
A drop in the price of the products integrated with GaN Micro-LED will lead to its use in various applications and wider acceptance among consumers.
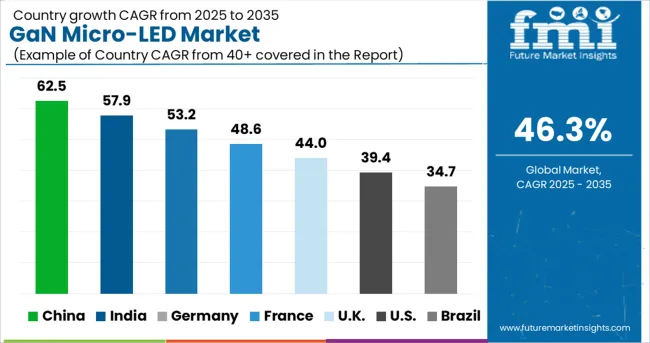
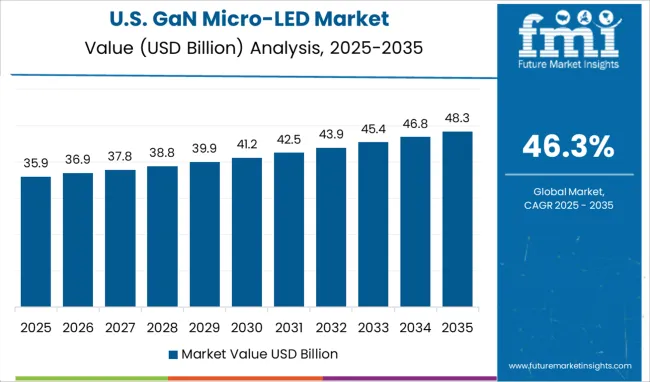
Currently, the USA market anticipates the largest consumption of GaN Micro-LED in the North American region and accounted for the market share of around 74% in 2024. The USA GaN Micro-LED market is expected to reach 16.5X by 2035.
Various GaN Micro-LED manufacturers in North America, primarily in the USA, are focusing on collaborations and acquisitions with semiconductor equipment distributors & networking solution providers to meet the growing demand for micro-LED in various industries including aerospace & defense, automotive, and consumer electronics.
Moreover, multiple RF power amplifier manufacturers in the country generate a significant portion of their revenue from distributors and online sales channels. This trend is expected to continue in the coming years as GaN technology product manufacturers are focusing on developing advanced display solutions.
United Kingdom market is set to register exponential growth of GaN Micro-LED in the Western Europe GaN Micro-LED market with a CAGR of nearly 34% from 2025 to 2035. The United Kingdom market is anticipated to create an absolute dollar opportunity of USD 1.6 Million between 2025 & 2035.
The semiconductor market in Western Europe is growing rapidly due to the high local demand for electronic products. Numerous OEMs are focusing on domestic manufacturing to serve the local demand of automotive and electronics industries as well as other global markets.
For instance, in August 2024, Cambridge startup Porotech teamed up with Jade Bird Display in China to use porous gallium nitride (GaN) for higher resolution, brighter microLED displays in portable designs.
China's market is set to report one of the largest consumption of GaN Micro-LED in the Asia Pacific Excluding Japan region, and the market size is expected to reach 16.7X by 2035. The Chinese market is anticipated to create an absolute dollar opportunity of USD 632 Million from 2025 to 2035.
China holds a broad range of advanced LED and display technologies that makes it one of the leading GaN Micro-LED developers for consumer electronics. It is building a pilot line and aims to deliver GaN Micro-LED offerings to domestic VR companies.
The low-power GaN Micro-LED (0.15 to 0.7 W) segment by output power will dominate the GaN Micro-LED demand and is expected to reach 13.1X by 2035. Moreover, the low power (0.15 to 0.7 W) GaN Micro-LED segment is set to witness the highest growth rate of 44.5% CAGR from 2025 to 2035.
As the new display technology, GaN Micro-LED with low power output is of the advantages of low power consumption, high brightness, high resolution, and fast response time. Moreover, exponential growth in wearable technology - from fitness trackers and smartwatches to Google Glass and Microsoft’s HoloLens - is highly likely to accelerate the mass market of low-power (0.15 to 0.7 W) GaN micro LEDs in the coming years.
The GaN Micro-LED display segment accounted for nearly 80% market share in the global GaN Micro-LED market in 2024. Leveraging the consumer cravings for top-notch home entertainment solutions, GaN micro-LED is likely to make its way into the regular household. Video-streaming services across various platforms are making consumers habituated to high-end home entertainment options, which leaves consumers in demand for better displays with every invention.
Thus, the growing market for smart wearables is expected to create lucrative opportunities for display panel manufacturers, such as LG, Samsung, Innolux, and AU Optronics. These companies are expected to consider investing in such applications by collaborating with GaN micro-LED startups.
The market size of the automotive segment, by industry, is set to expand by 13.6X by 2035. Moreover, the automotive segment is set to register an absolute dollar opportunity of USD 1.6 Billion between 2025 & 2035.
Major Key players have been concentrating on manufacturing various new products for precise applications as there are changing demands based on the use. The trend for automotive lighting, the emergence of in-car ambiance, and auto infotainment which has led to innovations in automotive displays and lighting thereby propelling the adoption of GaN Micro-LED in the automotive industry.
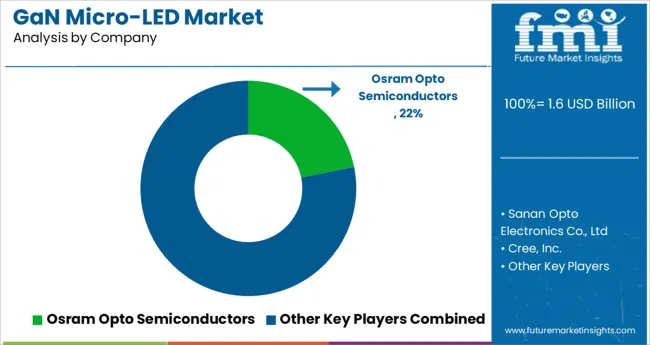
The global GaN Micro-LED industry serves a fairly consolidated competition landscape, where a majority of key players maintain their strategic focus on the development of solid distribution partnerships and joint ventures, thus targeting a firmer global footprint. With the use of technology, vendors also try to accelerate their business transformation and growth objectives by increasing their partner base.
| Attribute | Details |
|---|---|
| Market value in 2024 | USD 367.3 Million |
| Market CAGR 2014 to 2024 | 46.3% |
| Share of top 5 players | Around 47% |
| Forecast Period | 2025 to 2035 |
| Historical Data Available for | 2014 to 2024 |
| Market Analysis | million for Value |
| Key regions covered | North America; Latin America; Western Europe; Eastern Europe; Asia Pacific Excluding Japan; Japan; Middle East; and Africa |
| Key countries covered | USA, Canada, Germany, United Kingdom, France, Italy, Spain, Russia, BENELUX, Poland, China, Japan, South Korea, India, ASEAN, Australia, New Zealand, GCC countries, Turkey, Northern Africa, and South Africa |
| Key market segments covered | Output Power, Function Type, Industry Vertical, Region |
| Key companies profiled | Osram Opto Semiconductors; Sanan Opto Electronics Co., Ltd; Cree, Inc.; Innolux Corporation; Plessey Semiconductors; Lextar; Epistar; Rohinni; Aledia; Lumens Co., Ltd.; Lumiode; Glo AB |
| Report Coverage | Market forecast, company share analysis, competition intelligence, Drivers, Restraints, Opportunities and Threats analysis, market dynamics and challenges, and strategic growth initiatives |
| Customization & pricing | Available upon request |
The global gan micro-led market is estimated to be valued at USD 1.6 billion in 2025.
It is projected to reach USD 72.4 billion by 2035.
The market is expected to grow at a 46.3% CAGR between 2025 and 2035.
The key product types are high power gan micro-led (1 to 6 w), low power gan micro-led (0.15 to 0.7 w), mid power gan micro-led (0.7 to 1 w) and ultra-high power gan micro-led (>6 w).
gan micro-led display segment is expected to dominate with a 43.7% industry share in 2025.


Full Research Suite comprises of:
Market outlook & trends analysis
Interviews & case studies
Strategic recommendations
Vendor profiles & capabilities analysis
5-year forecasts
8 regions and 60+ country-level data splits
Market segment data splits
12 months of continuous data updates
DELIVERED AS:
PDF EXCEL ONLINE
GaN Substrate Market Size and Share Forecast Outlook 2025 to 2035
GaN-powered Chargers Market Size and Share Forecast Outlook 2025 to 2035
GaN Power Devices Market Report – Trends & Forecast 2017-2027
Organic Cosmetics Market Size and Share Forecast Outlook 2025 to 2035
Vegan Vitamin D3 Supplements Market Size and Share Forecast Outlook 2025 to 2035
Organoids LNP Market Size and Share Forecast Outlook 2025 to 2035
Organic Salad Dressing Market Forecast and Outlook 2025 to 2035
Organoids Market Size and Share Forecast Outlook 2025 to 2035
Organic Fertilizer Market Size and Share Forecast Outlook 2025 to 2035
Organic Acai Juice Market Size and Share Forecast Outlook 2025 to 2035
Vegan Cheese Market Size and Share Forecast Outlook 2025 to 2035
Organic Beverages Market Size and Share Forecast Outlook 2025 to 2035
Organic Drinks Market Size and Share Forecast Outlook 2025 to 2035
Vegan Confectionery Market Size and Share Forecast Outlook 2025 to 2035
Vegan Steak Market Size and Share Forecast Outlook 2025 to 2035
Vegan Pasta Market Size and Share Forecast Outlook 2025 to 2035
Organic Oats Market Size and Share Forecast Outlook 2025 to 2035
Argan Oil Moisturizers Market Analysis - Size, Share, and Forecast Outlook 2025 to 2035
Vegan Hyaluronic Acid Market Size and Share Forecast Outlook 2025 to 2035
Vegan Collagen Peptides Market Size and Share Forecast Outlook 2025 to 2035

Thank you!
You will receive an email from our Business Development Manager. Please be sure to check your SPAM/JUNK folder too.
Chat With
MaRIA