The global market for industrial coupling is projected to achieve steady growth from 2025 to 2035, driven by increasing demand for power transmission equipment with improved performance, increasing industrial automation, and transformation in heavy industries. Industrial couplings are mechanical pieces of equipment required to connect two shafts in equipment such that power transmission as well as misalignment, vibration, or other differences in operations can be allowed.
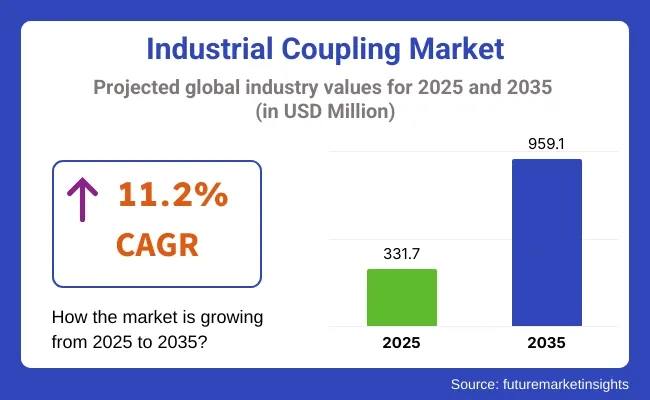
As manufacturing systems become more complex and availability more important more powerful long life couplings are gaining significance. The industrial coupling market is estimated to have a value of USD 331.7 million in 2025 and is projected to reach a value of USD 959.1 million in 2035 getting a CAGR of 11.2%.
| Metric | Value |
|---|---|
| Market Size in 2025 | USD 331.7 million |
| Projected Market Size in 2035 | USD 959.1 million |
| CAGR (2025 to 2035) | 11.2% |
Technological advancements, including couplings with no maintenance, smart vibration-damping technology, and high torque-flexibility designs, are changing the landscape. Requirements of pulp & paper, mining, food processing, automotive, and oil & gas industry segments, which are still on the rise, are proving to be lucrative for the market.
| Type | Market Share (2025) |
|---|---|
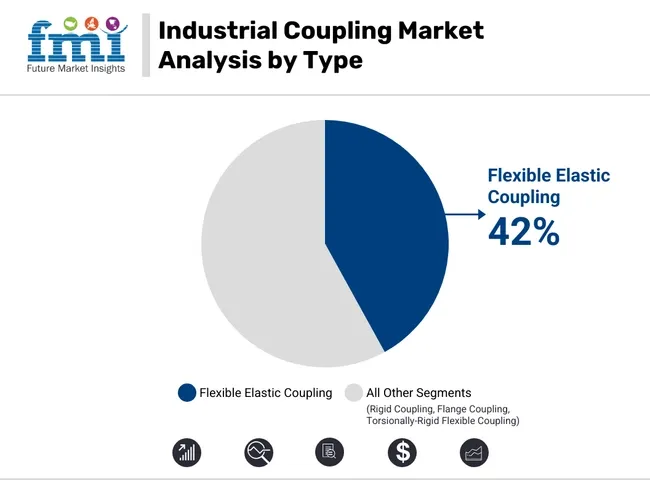
| Flexible Elastic Coupling | 42% |
Flexible elastic couplings are projected to dominate the industrial coupling industry with a market share of 42% in 2025. They are applied due to the fact that they are capable of enduring higher shock loads, can lower vibration, and are capable of tolerating misalignment, which is imperative in dynamic industrial usage.
Flexible elastic couplings help in the improvement of operational efficiency through preventing equipment failure as well as saving time and maintenance. They are used most commonly in flexure applications, such as conveyors, pumps, and high-speed production machinery. Of special interest, though, is that companies like Lovejoy (a company now owned by Timken) still experience very strong demand for their jaw and grid couplings, which they use widely in a broad variety of OEM applications.
Since they can guarantee them to be a top priority for companies seeking to become successful and lasting performers, their huge market coverage and growth are attained. Due to the fact that operations continue to prioritize operational reliability and life, flexible elastic couplings will never be replaced.
| Application | Market Share (2025) |
|---|---|
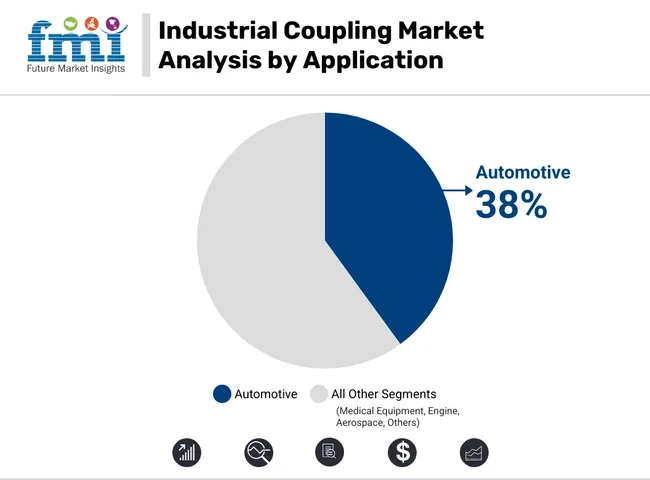
| Automotive | 38% |
The automotive market is projected to command 38% of the industrial coupling market share in 2025 based on wide scale utilization of such couplings for powertrain assembly, engine mounting, and use in electric motors. Industrial couplings enable vehicle performance through efficient and smooth transfer of mechanical power among rotating components and shafts. The growing trend of the automobile sector toward electric vehicles (EVs) has also fuelled additional demand for high-tech coupling solutions.
EVs need lightweight high-torque couplings since they need to absorb sophisticated drivetrain dynamics such as the requirement for regenerative braking and acceleration. Companies like KTR Systems and R+W Couplings are resizing products to align with changing requirements and providing customized solutions that deliver EV performance.
This high-performance drivetrain and the trend of electrification has placed industrial couplings as a key positioning in the automobile industry in the future, with a focus on ensuring healthy development in this industry.
Challenges: High Customization Requirements, Downtime Risk, and Volatility of Raw Material Prices
The industrial coupling sector is faced with the challenge of application-specific customizing, which can cause lead times and complexity in inventory. Risk of down time in the case of failure or misalignment incidents can translate into costly interruptions. Price volatility of steel and composite materials further impacts manufacturers' margins on production.
Opportunities: Predictive Maintenance, Smart Couplings, and New Applications
New opportunities emerge through the use of smart couplings with sensors embedded to monitor torque, vibration, and alignment in real time. Predictive maintenance is enabled, and unscheduled shutdowns are reduced. In addition, growing utilization of renewable energy equipment, electric vehicles, and robotics brings new opportunities for space-efficient coupling technologies.
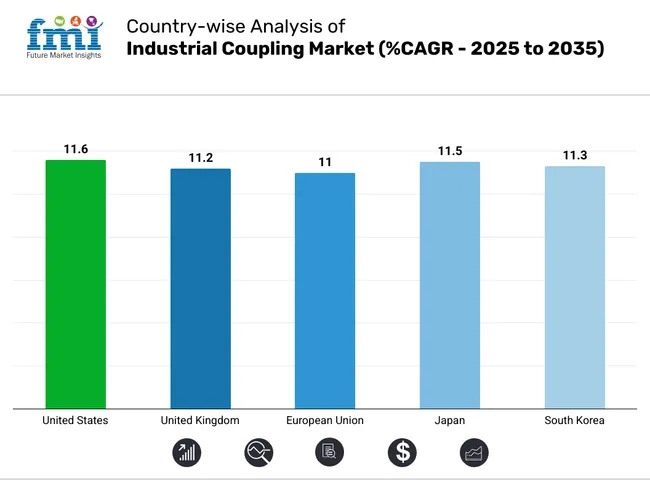
The USA industrial coupling market is advancing with the reshoring of manufacturing and investments in smart factories. Aerospace and EV sectors rely on precision couplings in robotic arms and testing dynos. Major energy projects also use high-torque disc and gear couplings in turbines and compressors.
| Country | CAGR (2025 to 2035) |
|---|---|
| USA | 11.6% |
In the UK, modernizations in water treatment, renewable energy, and intralogistics systems are boosting the demand for couplings. Companies are shifting toward low-maintenance metal bellows and magnetic couplings in distributed power and food-grade machinery applications.
| Country | CAGR (2025 to 2035) |
|---|---|
| UK | 11.2% |
In the EU, regulatory pressures for energy efficiency and machine safety compliance (EN ISO 12100, Machinery Directive) are fostering coupling upgrades across industries. Germany and Italy are front-runners in deploying smart couplings in packaging and high-speed precision manufacturing.
| Region | CAGR (2025 to 2035) |
|---|---|
| European Union (EU) | 11.0% |
Japan’s demand stems from miniaturized robotics, semiconductor fabrication, and ultra-high-speed spindles. Japanese firms are pushing innovations in zero-backlash miniature couplings, suitable for tight tolerance applications and lab automation systems.
| Country | CAGR (2025 to 2035) |
|---|---|
| Japan | 11.5% |
South Korea is witnessing growing use of high-precision couplings in smart warehouse systems, EV production lines, and offshore wind infrastructure. With automation upgrades in port logistics and steel manufacturing, demand for flexible couplings and torque limiters is steadily rising.
| Country | CAGR (2025 to 2035) |
|---|---|
| South Korea | 11.3% |
The Industrial Coupling Market will grow perpetually with the growing demand for effective power transmission solutions in diversified sectors like automotive, oil & gas, aerospace, and power generation. The growth in couplings technology, which includes the growth in maintenance-free and high-torque capacity couplings, also drives the market growth.
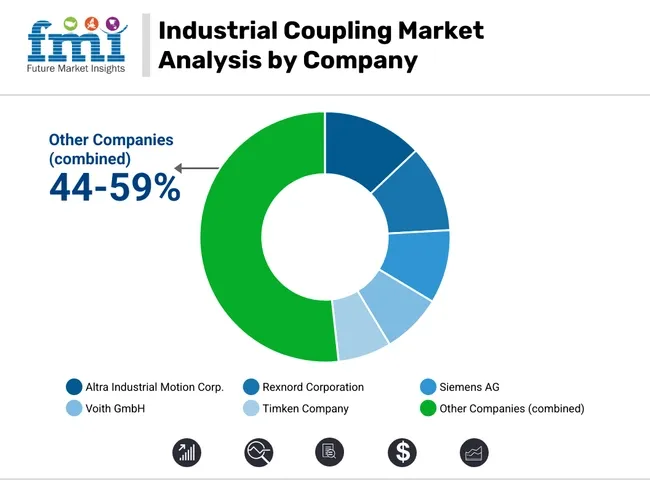
Altra Industrial Motion Corp. (12-15%)
Altra is a leader in its diversified couplings for various industrial uses. Its acquisition and activities in product development have also helped it achieve global presence.
Rexnord Corporation (10-13%)
Rexnord differentiates itself due to its high-performance coupling and dedication towards integrating smart technologies for predictive maintenance for maximizing clients' operating efficiency.
Siemens AG (8-11%)
Siemens utilizes its engineering skills to provide solutions for difficult coupling applications, lately with emphasis on digitalization and digital twin implementation to optimize product performance.
Voith GmbH (6-9%)
Voith is a power plant energy application coupling expert and is growing its renewable energy presence through strategic alliances.
Timken Company (5-8%)
The innovation with the Lovejoy brand and material science investment by Timken shows its intent to supply high-specialized coupling solutions to industries.
Other Key Players (44-59% Combined)
The industrial coupling market was valued at approximately USD 331.7 million in 2025.
The market is projected to reach around USD 959.1 million by 2035.
The increasing demand for industrial automation and advanced manufacturing processes is a key driver.
The top contributing countries are China, the United States, Japan, Germany, and India.
Flexible elastic couplings are expected to command a significant market share over the forecast period.
Table 1: Global Industrial Coupling Market Value (US$ Mn) Forecast by Region, 2017-2032
Table 2: Global Industrial Coupling Market Volume (Units) Forecast by Region, 2017-2032
Table 3: Global Industrial Coupling Market Value (US$ Mn) Forecast by Couplings Type, 2017-2032
Table 4: Global Industrial Coupling Market Volume (Units) Forecast by Couplings Type, 2017-2032
Table 5: Global Industrial Coupling Market Value (US$ Mn) Forecast by Application , 2017-2032
Table 6: Global Industrial Coupling Market Volume (Units) Forecast by Application , 2017-2032
Table 7: North America Industrial Coupling Market Value (US$ Mn) Forecast by Country, 2017-2032
Table 8: North America Industrial Coupling Market Volume (Units) Forecast by Country, 2017-2032
Table 9: North America Industrial Coupling Market Value (US$ Mn) Forecast by Couplings Type, 2017-2032
Table 10: North America Industrial Coupling Market Volume (Units) Forecast by Couplings Type, 2017-2032
Table 11: North America Industrial Coupling Market Value (US$ Mn) Forecast by Application , 2017-2032
Table 12: North America Industrial Coupling Market Volume (Units) Forecast by Application , 2017-2032
Table 13: Latin America Industrial Coupling Market Value (US$ Mn) Forecast by Country, 2017-2032
Table 14: Latin America Industrial Coupling Market Volume (Units) Forecast by Country, 2017-2032
Table 15: Latin America Industrial Coupling Market Value (US$ Mn) Forecast by Couplings Type, 2017-2032
Table 16: Latin America Industrial Coupling Market Volume (Units) Forecast by Couplings Type, 2017-2032
Table 17: Latin America Industrial Coupling Market Value (US$ Mn) Forecast by Application , 2017-2032
Table 18: Latin America Industrial Coupling Market Volume (Units) Forecast by Application , 2017-2032
Table 19: Europe Industrial Coupling Market Value (US$ Mn) Forecast by Country, 2017-2032
Table 20: Europe Industrial Coupling Market Volume (Units) Forecast by Country, 2017-2032
Table 21: Europe Industrial Coupling Market Value (US$ Mn) Forecast by Couplings Type, 2017-2032
Table 22: Europe Industrial Coupling Market Volume (Units) Forecast by Couplings Type, 2017-2032
Table 23: Europe Industrial Coupling Market Value (US$ Mn) Forecast by Application , 2017-2032
Table 24: Europe Industrial Coupling Market Volume (Units) Forecast by Application , 2017-2032
Table 25: Asia Pacific Industrial Coupling Market Value (US$ Mn) Forecast by Country, 2017-2032
Table 26: Asia Pacific Industrial Coupling Market Volume (Units) Forecast by Country, 2017-2032
Table 27: Asia Pacific Industrial Coupling Market Value (US$ Mn) Forecast by Couplings Type, 2017-2032
Table 28: Asia Pacific Industrial Coupling Market Volume (Units) Forecast by Couplings Type, 2017-2032
Table 29: Asia Pacific Industrial Coupling Market Value (US$ Mn) Forecast by Application , 2017-2032
Table 30: Asia Pacific Industrial Coupling Market Volume (Units) Forecast by Application , 2017-2032
Table 31: MEA Industrial Coupling Market Value (US$ Mn) Forecast by Country, 2017-2032
Table 32: MEA Industrial Coupling Market Volume (Units) Forecast by Country, 2017-2032
Table 33: MEA Industrial Coupling Market Value (US$ Mn) Forecast by Couplings Type, 2017-2032
Table 34: MEA Industrial Coupling Market Volume (Units) Forecast by Couplings Type, 2017-2032
Table 35: MEA Industrial Coupling Market Value (US$ Mn) Forecast by Application , 2017-2032
Table 36: MEA Industrial Coupling Market Volume (Units) Forecast by Application , 2017-2032
Figure 1: Global Industrial Coupling Market Value (US$ Mn) by Couplings Type, 2022-2032
Figure 2: Global Industrial Coupling Market Value (US$ Mn) by Application , 2022-2032
Figure 3: Global Industrial Coupling Market Value (US$ Mn) by Region, 2022-2032
Figure 4: Global Industrial Coupling Market Value (US$ Mn) Analysis by Region, 2017-2032
Figure 5: Global Industrial Coupling Market Volume (Units) Analysis by Region, 2017-2032
Figure 6: Global Industrial Coupling Market Value Share (%) and BPS Analysis by Region, 2022-2032
Figure 7: Global Industrial Coupling Market Y-o-Y Growth (%) Projections by Region, 2022-2032
Figure 8: Global Industrial Coupling Market Value (US$ Mn) Analysis by Couplings Type, 2017-2032
Figure 9: Global Industrial Coupling Market Volume (Units) Analysis by Couplings Type, 2017-2032
Figure 10: Global Industrial Coupling Market Value Share (%) and BPS Analysis by Couplings Type, 2022-2032
Figure 11: Global Industrial Coupling Market Y-o-Y Growth (%) Projections by Couplings Type, 2022-2032
Figure 12: Global Industrial Coupling Market Value (US$ Mn) Analysis by Application , 2017-2032
Figure 13: Global Industrial Coupling Market Volume (Units) Analysis by Application , 2017-2032
Figure 14: Global Industrial Coupling Market Value Share (%) and BPS Analysis by Application , 2022-2032
Figure 15: Global Industrial Coupling Market Y-o-Y Growth (%) Projections by Application , 2022-2032
Figure 16: Global Industrial Coupling Market Attractiveness by Couplings Type, 2022-2032
Figure 17: Global Industrial Coupling Market Attractiveness by Application , 2022-2032
Figure 18: Global Industrial Coupling Market Attractiveness by Region, 2022-2032
Figure 19: North America Industrial Coupling Market Value (US$ Mn) by Couplings Type, 2022-2032
Figure 20: North America Industrial Coupling Market Value (US$ Mn) by Application , 2022-2032
Figure 21: North America Industrial Coupling Market Value (US$ Mn) by Country, 2022-2032
Figure 22: North America Industrial Coupling Market Value (US$ Mn) Analysis by Country, 2017-2032
Figure 23: North America Industrial Coupling Market Volume (Units) Analysis by Country, 2017-2032
Figure 24: North America Industrial Coupling Market Value Share (%) and BPS Analysis by Country, 2022-2032
Figure 25: North America Industrial Coupling Market Y-o-Y Growth (%) Projections by Country, 2022-2032
Figure 26: North America Industrial Coupling Market Value (US$ Mn) Analysis by Couplings Type, 2017-2032
Figure 27: North America Industrial Coupling Market Volume (Units) Analysis by Couplings Type, 2017-2032
Figure 28: North America Industrial Coupling Market Value Share (%) and BPS Analysis by Couplings Type, 2022-2032
Figure 29: North America Industrial Coupling Market Y-o-Y Growth (%) Projections by Couplings Type, 2022-2032
Figure 30: North America Industrial Coupling Market Value (US$ Mn) Analysis by Application , 2017-2032
Figure 31: North America Industrial Coupling Market Volume (Units) Analysis by Application , 2017-2032
Figure 32: North America Industrial Coupling Market Value Share (%) and BPS Analysis by Application , 2022-2032
Figure 33: North America Industrial Coupling Market Y-o-Y Growth (%) Projections by Application , 2022-2032
Figure 34: North America Industrial Coupling Market Attractiveness by Couplings Type, 2022-2032
Figure 35: North America Industrial Coupling Market Attractiveness by Application , 2022-2032
Figure 36: North America Industrial Coupling Market Attractiveness by Country, 2022-2032
Figure 37: Latin America Industrial Coupling Market Value (US$ Mn) by Couplings Type, 2022-2032
Figure 38: Latin America Industrial Coupling Market Value (US$ Mn) by Application , 2022-2032
Figure 39: Latin America Industrial Coupling Market Value (US$ Mn) by Country, 2022-2032
Figure 40: Latin America Industrial Coupling Market Value (US$ Mn) Analysis by Country, 2017-2032
Figure 41: Latin America Industrial Coupling Market Volume (Units) Analysis by Country, 2017-2032
Figure 42: Latin America Industrial Coupling Market Value Share (%) and BPS Analysis by Country, 2022-2032
Figure 43: Latin America Industrial Coupling Market Y-o-Y Growth (%) Projections by Country, 2022-2032
Figure 44: Latin America Industrial Coupling Market Value (US$ Mn) Analysis by Couplings Type, 2017-2032
Figure 45: Latin America Industrial Coupling Market Volume (Units) Analysis by Couplings Type, 2017-2032
Figure 46: Latin America Industrial Coupling Market Value Share (%) and BPS Analysis by Couplings Type, 2022-2032
Figure 47: Latin America Industrial Coupling Market Y-o-Y Growth (%) Projections by Couplings Type, 2022-2032
Figure 48: Latin America Industrial Coupling Market Value (US$ Mn) Analysis by Application , 2017-2032
Figure 49: Latin America Industrial Coupling Market Volume (Units) Analysis by Application , 2017-2032
Figure 50: Latin America Industrial Coupling Market Value Share (%) and BPS Analysis by Application , 2022-2032
Figure 51: Latin America Industrial Coupling Market Y-o-Y Growth (%) Projections by Application , 2022-2032
Figure 52: Latin America Industrial Coupling Market Attractiveness by Couplings Type, 2022-2032
Figure 53: Latin America Industrial Coupling Market Attractiveness by Application , 2022-2032
Figure 54: Latin America Industrial Coupling Market Attractiveness by Country, 2022-2032
Figure 55: Europe Industrial Coupling Market Value (US$ Mn) by Couplings Type, 2022-2032
Figure 56: Europe Industrial Coupling Market Value (US$ Mn) by Application , 2022-2032
Figure 57: Europe Industrial Coupling Market Value (US$ Mn) by Country, 2022-2032
Figure 58: Europe Industrial Coupling Market Value (US$ Mn) Analysis by Country, 2017-2032
Figure 59: Europe Industrial Coupling Market Volume (Units) Analysis by Country, 2017-2032
Figure 60: Europe Industrial Coupling Market Value Share (%) and BPS Analysis by Country, 2022-2032
Figure 61: Europe Industrial Coupling Market Y-o-Y Growth (%) Projections by Country, 2022-2032
Figure 62: Europe Industrial Coupling Market Value (US$ Mn) Analysis by Couplings Type, 2017-2032
Figure 63: Europe Industrial Coupling Market Volume (Units) Analysis by Couplings Type, 2017-2032
Figure 64: Europe Industrial Coupling Market Value Share (%) and BPS Analysis by Couplings Type, 2022-2032
Figure 65: Europe Industrial Coupling Market Y-o-Y Growth (%) Projections by Couplings Type, 2022-2032
Figure 66: Europe Industrial Coupling Market Value (US$ Mn) Analysis by Application , 2017-2032
Figure 67: Europe Industrial Coupling Market Volume (Units) Analysis by Application , 2017-2032
Figure 68: Europe Industrial Coupling Market Value Share (%) and BPS Analysis by Application , 2022-2032
Figure 69: Europe Industrial Coupling Market Y-o-Y Growth (%) Projections by Application , 2022-2032
Figure 70: Europe Industrial Coupling Market Attractiveness by Couplings Type, 2022-2032
Figure 71: Europe Industrial Coupling Market Attractiveness by Application , 2022-2032
Figure 72: Europe Industrial Coupling Market Attractiveness by Country, 2022-2032
Figure 73: Asia Pacific Industrial Coupling Market Value (US$ Mn) by Couplings Type, 2022-2032
Figure 74: Asia Pacific Industrial Coupling Market Value (US$ Mn) by Application , 2022-2032
Figure 75: Asia Pacific Industrial Coupling Market Value (US$ Mn) by Country, 2022-2032
Figure 76: Asia Pacific Industrial Coupling Market Value (US$ Mn) Analysis by Country, 2017-2032
Figure 77: Asia Pacific Industrial Coupling Market Volume (Units) Analysis by Country, 2017-2032
Figure 78: Asia Pacific Industrial Coupling Market Value Share (%) and BPS Analysis by Country, 2022-2032
Figure 79: Asia Pacific Industrial Coupling Market Y-o-Y Growth (%) Projections by Country, 2022-2032
Figure 80: Asia Pacific Industrial Coupling Market Value (US$ Mn) Analysis by Couplings Type, 2017-2032
Figure 81: Asia Pacific Industrial Coupling Market Volume (Units) Analysis by Couplings Type, 2017-2032
Figure 82: Asia Pacific Industrial Coupling Market Value Share (%) and BPS Analysis by Couplings Type, 2022-2032
Figure 83: Asia Pacific Industrial Coupling Market Y-o-Y Growth (%) Projections by Couplings Type, 2022-2032
Figure 84: Asia Pacific Industrial Coupling Market Value (US$ Mn) Analysis by Application , 2017-2032
Figure 85: Asia Pacific Industrial Coupling Market Volume (Units) Analysis by Application , 2017-2032
Figure 86: Asia Pacific Industrial Coupling Market Value Share (%) and BPS Analysis by Application , 2022-2032
Figure 87: Asia Pacific Industrial Coupling Market Y-o-Y Growth (%) Projections by Application , 2022-2032
Figure 88: Asia Pacific Industrial Coupling Market Attractiveness by Couplings Type, 2022-2032
Figure 89: Asia Pacific Industrial Coupling Market Attractiveness by Application , 2022-2032
Figure 90: Asia Pacific Industrial Coupling Market Attractiveness by Country, 2022-2032
Figure 91: MEA Industrial Coupling Market Value (US$ Mn) by Couplings Type, 2022-2032
Figure 92: MEA Industrial Coupling Market Value (US$ Mn) by Application , 2022-2032
Figure 93: MEA Industrial Coupling Market Value (US$ Mn) by Country, 2022-2032
Figure 94: MEA Industrial Coupling Market Value (US$ Mn) Analysis by Country, 2017-2032
Figure 95: MEA Industrial Coupling Market Volume (Units) Analysis by Country, 2017-2032
Figure 96: MEA Industrial Coupling Market Value Share (%) and BPS Analysis by Country, 2022-2032
Figure 97: MEA Industrial Coupling Market Y-o-Y Growth (%) Projections by Country, 2022-2032
Figure 98: MEA Industrial Coupling Market Value (US$ Mn) Analysis by Couplings Type, 2017-2032
Figure 99: MEA Industrial Coupling Market Volume (Units) Analysis by Couplings Type, 2017-2032
Figure 100: MEA Industrial Coupling Market Value Share (%) and BPS Analysis by Couplings Type, 2022-2032
Figure 101: MEA Industrial Coupling Market Y-o-Y Growth (%) Projections by Couplings Type, 2022-2032
Figure 102: MEA Industrial Coupling Market Value (US$ Mn) Analysis by Application , 2017-2032
Figure 103: MEA Industrial Coupling Market Volume (Units) Analysis by Application , 2017-2032
Figure 104: MEA Industrial Coupling Market Value Share (%) and BPS Analysis by Application , 2022-2032
Figure 105: MEA Industrial Coupling Market Y-o-Y Growth (%) Projections by Application , 2022-2032
Figure 106: MEA Industrial Coupling Market Attractiveness by Couplings Type, 2022-2032
Figure 107: MEA Industrial Coupling Market Attractiveness by Application , 2022-2032
Figure 108: MEA Industrial Coupling Market Attractiveness by Country, 2022-2032


Full Research Suite comprises of:
Market outlook & trends analysis
Interviews & case studies
Strategic recommendations
Vendor profiles & capabilities analysis
5-year forecasts
8 regions and 60+ country-level data splits
Market segment data splits
12 months of continuous data updates
DELIVERED AS:
PDF EXCEL ONLINE
Industrial Power Supply Market Size and Share Forecast Outlook 2025 to 2035
Industrial Crystallizer Market Size and Share Forecast Outlook 2025 to 2035
Industrial Counterweight Market Size and Share Forecast Outlook 2025 to 2035
Industrial Gas Market Size and Share Forecast Outlook 2025 to 2035
Industrial Furnace Market Size and Share Forecast Outlook 2025 to 2035
Industrial Weighing Equipment Market Size and Share Forecast Outlook 2025 to 2035
Industrial Drum Market Size and Share Forecast Outlook 2025 to 2035
Industrial Food Slicers Market Size and Share Forecast Outlook 2025 to 2035
Industrial Printer Market Size and Share Forecast Outlook 2025 to 2035
Industrial Fryers Market Size and Share Forecast Outlook 2025 to 2035
Industrial Paper Sacks Market Size and Share Forecast Outlook 2025 to 2035
Industrial Chemical Packaging Market Size and Share Forecast Outlook 2025 to 2035
Industrial Adhesives Market Size and Share Forecast Outlook 2025 to 2035
Industrial Valve Market Size and Share Forecast Outlook 2025 to 2035
Industrial Air Filtration Market Size and Share Forecast Outlook 2025 to 2035
Industrial Phosphates Market Size and Share Forecast Outlook 2025 to 2035
Industrial Elevators Market Size and Share Forecast Outlook 2025 to 2035
Industrial Boilers Market Size and Share Forecast Outlook 2025 to 2035
Industrial Battery Market Size and Share Forecast Outlook 2025 to 2035
Industrial Nailers Market Size and Share Forecast Outlook 2025 to 2035

Thank you!
You will receive an email from our Business Development Manager. Please be sure to check your SPAM/JUNK folder too.
Chat With
MaRIA