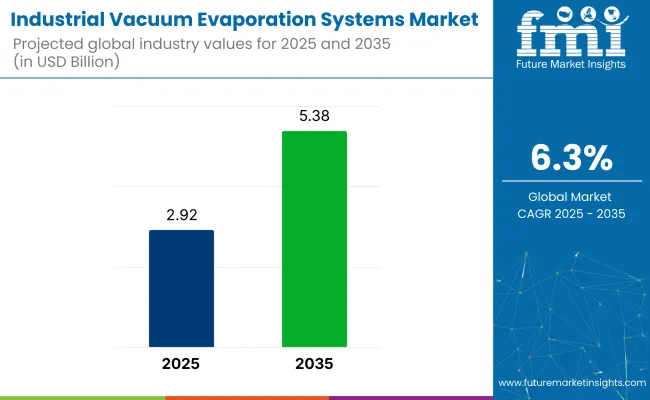
The industrial vacuum evaporation systems market valuation is anticipated to grow substantially, with a valuation of USD 2.92 billion in 2025, expected to reach around USD 5.38 billion by 2035, growing at a CAGR of 6.3%. It is fueled by increasing environmental regulations and the need for sustainable water treatment solutions.
One of the most influential growth forces is the worldwide initiatives taken on wastewater discharge regulations. Ecological authorities are putting more controls on chemical wastes, heavy metals, and organics. Vacuum evaporators help companies meet regulatory requirements by reducing wastewater generation enormously and recovering clean water for recirculation.
These industries are among the major users, including chemical processing, pharmaceuticals, food and beverages, textiles, and metal finishing. These have large volumes of complex effluents containing harmful substances that cannot be treated through conventional filtration or chemical treatment only.
The technologies are particularly useful in closed-loop production facilities, where water recycling is critical. Vacuum evaporation contributes to sustainability goals by recycling treated water and reducing reliance on external supply-a progressively more valuable advantage in water-starved regions or facilities that seek to improve ESG scores.
Technological innovation is also speeding up adoption. Hybrid vacuum evaporators integrating heat pumps, solar energy, or multi-effect distillation are enhancing energy efficiency and economic performance. Advanced automation and remote monitoring solutions are further making processes more convenient and data-orientated.Issues are high capital investment and process complexity, particularly for small and medium-sized businesses. However, reducing equipment costs, rising awareness, and government incentives for sustainable technologies are narrowing the gap and fueling uptake for the whole industrial base.
Europe leads the industry, followed by high EU environmental controls and high take-up of ZLD systems. The Asia-Pacific is also emerging as a key growth region due to industrial expansion in China, India, and Southeast Asia, as well as increasing environmental pressures and investment in sophisticated wastewater treatment. Industrial vacuum evaporation equipment is becoming a central element of eco-efficient processes. With increasing concern regarding water shortage, environmental responsibility, and recovery of resources, such equipment will become central in driving industrial sustainability on a world level.
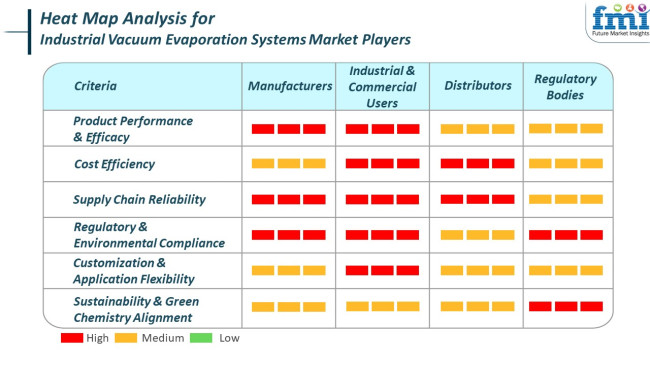
The industrial vacuum evaporation systems industry is growing at a high rate, propelled by rising demand from different sectors like pharmaceutical, chemicals, food and beverage, and power. This is due to the increasing requirement for effective wastewater treatment equipment and government regulatory pressure.
The manufacturers concentrate on crafting high-performance industrial vacuum evaporation systems that satisfy the severe needs of industrial and commercial consumers. They engage in environmentally friendly production processes and strive to deliver an assured supply chain to address increased global demand.
Industrial and commercial users, such as industries in pharmaceuticals, chemicals, food and beverages, and power generation, put most emphasis on cost-effective and efficient industrial vacuum evaporation system solutions that guarantee peak performance across different applications.
Distributors highlight the need to have a stable supply chain to serve the needs of industrial and commercial customers. They concentrate on providing a wide variety of products to suit various applications while providing timely delivery and competitive prices.
Between 2020 and 2024, the industrial vacuum evaporation systems market experienced continuous growth, driven primarily by increased industrial activity and rising interest in wastewater treatment. The pharmaceutical, chemical, and food processing sectors have applied the systems to improve waste disposal regulations and comply with environmental protection regulations.
The use of automation and energy-saving technologies began to gather pace, although the pace of uptake varied by region. North America and Europe led the charge, and Asia-Pacific offered the promise of rapid growth on the back of developing industrial bases.
Over the next 2025 to 2035 horizon period, some remarkable growth driven by technological innovation and improved environmental rules will be seen in the industry. The growth of more sustainable and tailored solutions will address the specific requirements of different industries, particularly in developing economies.
Growing focus on zero liquid discharge (ZLD) systems and reducing environmental footprint will drive demand for advanced vacuum evaporation technologies. Sophisticated equipment to be employed during real-time control and monitoring shall improve operating efficacy as well as regulatory compliance.
Comparative Analysis: 2020 to 2024 vs. 2025 to 2035
| 2020 to 2024 | 2025 to 2035 |
|---|---|
| Market development supports increasing industrial activity and demand for wastewater treatment. | Driven by technological innovation, stricter environmental protection regulations, as well as the requirement for eco-friendly solutions. |
| Adoption of automation and power-saving technologies at an early stage as a part of the technology mix. | Sophisticated deployment of intelligent technologies in real-time management and monitoring. |
| Focus on regulation compliance in mature markets. | Give priority to the development of customized solutions for addressing various industrial needs, especially in the new markets. |
| Implementation leadership from Europe and North America; Asia-Pacific with growth potential. | Enormous growth in the Asia-Pacific region due to increasing industrial processes and green projects. |
| Increasing awareness and early take-up of sustainable technologies. | There is an overwhelming focus on sustainability with the widespread implementation of ZLD systems and green technologies. |
The industrial vacuum evaporation systems industry is witnessing strong growth due to growing demand from various industries like pharmaceuticals, chemicals, and food and beverage. The systems play a critical role in effective concentration, purification, and crystallization processes, as well as meeting strict regulatory demands for product purity and the necessity of sustainable, energy-efficient production processes.
One of the notable current risks faced by the industry is the heavy upfront investment required for sophisticated evaporation systems. The systems tend to require specialized technical expertise to operate and maintain, making them even more costly. Moreover, the industry is also prone to risks such as scaling, intricate designs, and controlling energy usage and environmental effects. These are some of the factors that may demote the use of industrial vacuum evaporation systems, particularly among small and medium-sized businesses.
While the industrial vacuum evaporation systems market shows high growth, investors will have to contend with risks of high capital expenditure, high operational complexity, competition from emerging technologies, raw material price volatility, and geopolitical risks. Strategies that are forward-looking to address these risks will be critical for long-term success in this evolving industry.
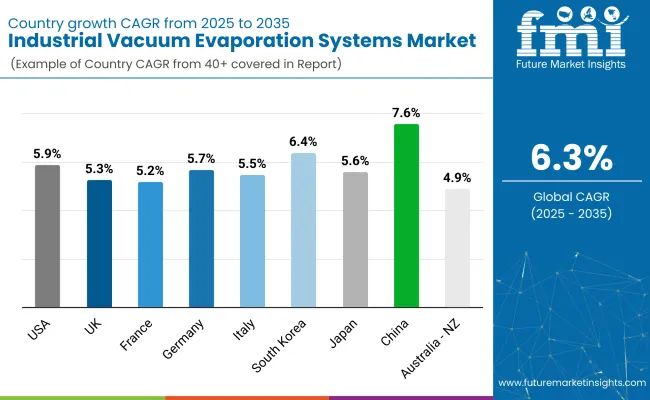
| Countries | CAGR (2025 to 2035) |
|---|---|
| USA | 5.9% |
| UK | 5.3% |
| France | 5.2% |
| Germany | 5.7% |
| Italy | 5.5% |
| South Korea | 6.4% |
| Japan | 5.6% |
| China | 7.6% |
| Australia - NZ | 4.9% |
The USA will expand at 5.9% CAGR between the years of this study. Growing regulatory pressure on wastewater reuse, hazardous waste elimination, and sustainable industrial practices is creating demand for advanced liquid waste treatment technologies, including vacuum evaporation systems. Such systems are increasingly being utilized across industries such as chemical processing, electronics, automotive, food and beverages, and metal finishing.
Growing awareness of water scarcity and resource efficiency is leading USA firms to embrace closed-loop treatment systems, where vacuum evaporators allow for efficient recovery of clean water and concentration of pollutants. Decentralized wastewater treatment facilities in remote areas add to the demand.
Additionally, enhanced technologies in zero-liquid discharge (ZLD) systems, with support from federal and state-level incentives, render vacuum evaporation systems a desirable option. The USA is supported by an established ecosystem of technology providers, integrators, and regulatory aid, maintaining a robust adoption forecast across various sectors.
The UK is anticipated to grow at 5.3% CAGR through the period of study. Industrial waste management in the UK is transforming fast in reaction to stringent environmental regulations and increasing operating expenses for effluent disposal. Vacuum evaporation systems provide an efficient solution to eliminate waste volume and recover water, especially in metal treatment, pharmaceuticals, and electronics manufacturing.
The demand for modular and small solutions is increasing because small and medium-sized enterprises want affordable regulatory discharge compliance. Furthermore, climate targets are propelling environmental legislation that encourages industries to make investments in green, lower-carbon treatment technologies.
The presence of digital monitoring and automation capabilities in vacuum evaporators is another key trend propelling adoption. As industrial sectors expand their efforts to be sustainable and resource-efficient, the UK will tend to record stable growth patterns.
France will register a 5.2% CAGR throughout the study period. France is experiencing increased utilization of industrial vacuum evaporation equipment, driven by water reuse regulatory enforcement and urgency among industries to reduce hazardous effluent discharge. France's chemical and food industry sectors are heavily adopting small-footprint evaporation units for recovering water and concentrating chemical residue.
Government support for incorporating clean technology and industrial waste valorization boosts industry potential. The sustained focus in France on achieving circular economy goals is encouraging industrial parks to adopt advanced treatment technologies that enable water reuse and byproduct recovery.
In addition, improvements in energy efficiency and system automation are also making vacuum evaporators economically feasible. As the interest of manufacturers is focused on clean manufacturing and reducing costs, the significance of vacuum evaporation in water management is also rising across a range of applications.
Germany is expected to clock a 5.7% CAGR during the analysis period. Germany's strong industrial base and global dominance in environmental technology make it a premium region for vacuum evaporation systems.
Key industries like surface treatment, automotive, semiconductors, and specialty chemicals are investing in closed-loop wastewater treatment systems to address stringent environmental regulations and reduce water usage. German experience in engineering has allowed them to design very efficient evaporators with the ability to treat complex waste streams with high reliability.
The deployment of Industry 4.0 standards allows online monitoring and optimization of the efficiency of vacuum systems, reducing operational expenses and optimizing efficiency. Support for sustainability, as well as complying with EU-level policies on discharges into waters, continues to advance technology adoption. With environmental performance as a strategic objective for industrial segments, vacuum evaporation systems are progressively being seen as a sustainable answer to process water management.
Italy is expected to grow at 5.5% CAGR during the forecast period. Italy's industry-based economy, with its strong emphasis on surface finishing, auto components, and food processing, is increasingly reliant upon vacuum evaporation systems for treating high-salinity or high-COD effluents. The ability of these systems to allow near-zero liquid discharge (ZLD) promotes sustainability objectives and compliance with wastewater discharge laws.
As Italian SMEs adopt advanced water treatment technology to compete in global industries, vacuum evaporators are emerging as low-cost and flexible solutions for minimizing fluid waste. The encouragement of energy-efficient industrial upgrading and waste reduction programs by the Italian government also encourages investment in this technology. In addition, Italy's image for environmental and mechanical engineering contributes to ongoing product improvement, which makes vacuum evaporators suitable for modular and energy-efficient processes.
South Korea is expected to grow at 6.4% CAGR over the research period. South Korea's high-tech manufacturing industries, including electronics, semiconductor manufacturing, and petrochemical processing, present huge opportunities for vacuum evaporation systems. Vacuum evaporation systems are widely used for treating highly concentrated or toxic effluents and recovering recoverable water in cleanroom-sensitive processes.
The country's push-green environmental programs and strong support of sustainable, high-tech industrial parks drive the adoption of state-of-the-art wastewater treatment solutions. In addition, the synergy of automation and AI-optimized system optimization is part of South Korea's smart factory initiatives, making vacuum evaporation a natural fit.
As demand increases for efficient wastewater reuse and treatment in city and industrial applications, the technology also picks up in both established industries and new green tech uses. With South Korea emerging as a global hub of innovation and green leadership, vacuum evaporation system installations will expand at a very high rate.
Japan will expand at 5.6% CAGR during the study period. Japan's industrial culture is very much focused on precision and cleanliness, both of which are in favor of the growing use of vacuum evaporation systems in industries such as electronics, pharma, and fine chemicals. The technology is especially valued for its ability to minimize waste discharge and recover purified water from concentrated waste streams.
With Japan moving towards low-impact and sustainable production technologies, advanced liquid treatment equipment with an efficient and reliable nature is highly sought after. Vacuum evaporators are also gaining popularity in disaster preparedness applications as well as in mobile units to be used for remote installations.
Energy-efficient designs with aspects of heat recovery and low-temperature processing will appeal to Japan's innovation-driven and operational sustainability focus. With increasing demand for high-performance, space-saving wastewater systems as a result of an aging infrastructure and increasing environmental regulation, the demand is fueling steady sales growth.
China will grow at 7.6% CAGR during the research period. As the world's largest industrial producer, China is facing increasing challenges in wastewater creation and disposal of toxic effluent. In response to this, the use of high-efficiency closed-loop technologies such as vacuum evaporation has risen to gain water reuse and also meet regulatory standards. Vacuum evaporation technologies have gained a significant following across sectors like electroplating, mining, and chemical industries where standard treatment methods prove insufficient.
Water conservation policies by the government with emphasis on zero-liquid discharge and sustainable production also spur the industry further. Urbanization and clustering of industry are good conditions for the local buildup of wastewater treatment plants. In addition, locally made equipment manufacturers are creating novel solutions to satisfy demand for low-cost, automated vacuum evaporation system units.
The Australia-NZ region is expected to progress at 4.9% CAGR during the research period. Industrial vacuum evaporation systems are gradually gaining acceptance in Australia and New Zealand as industries deal with stringent environmental regulations and water scarcity concerns. These systems are particularly useful in offsite or water-short locations where conventional wastewater treatment is not practical.
Applications in mining, food processing, and agriculture are among the early adopters, using vacuum evaporation for concentration of brine, treatment of leachate, and clean water recovery. Governments' clean technologies and circular economy efforts are also forcing companies to invest in high-end effluent treatment technologies.
Adoption has now been focused on individual applications, but the growing need for sustainable water management in different industries will contribute to steady demand. Modular, skid-mounted, and energy-efficient configurations are likely to dominate future growth in the region.
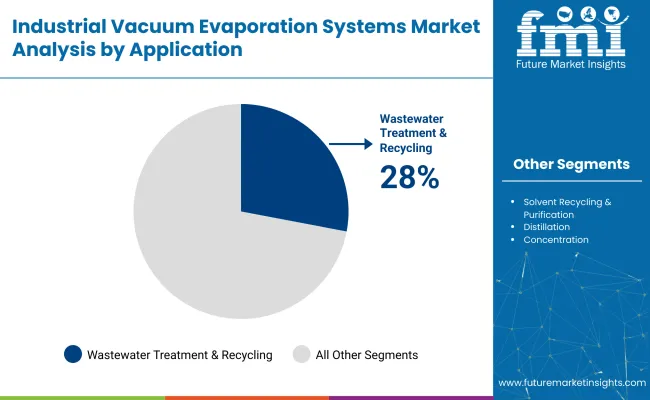
By application, the industrial vacuum evaporation systems market is segmented into wastewater treatment & recycling, which is expected to represent about 28% of the overall share, andsolvent recycling & purification segment, which covers around 18% of the overall industry.
The high percentage of this segment can be mainly attributed to numerous regulations imposed globally on effluent discharge, coupled with increasing demand from both regulatory and market drives toward sustainable closed-loop water management characteristics found in metallurgy and surface treatment. Such vacuum evaporation can readily separate water from contaminants with great energy efficiency.
It is thereby best suited for reducing wastewater volumes and recovering reusable water. Industry leaders like Veolia Water Technologies develop systems such as Evaled vacuum evaporators, which are used widely for industrial wastewater recovery in sectors like electroplating, automotive, and pharmaceutical manufacturing. Another company, CondorchemEnvitech, manufactures modular vacuum evaporators designed for ZLD solutions in chemical processing plants.
This segment has an 18% share of the industry and is steadily growing due to the rising costs of solvents and increasing regulatory pressures to get rid of hazardous waste. Industries like paint & coatings, pharmaceuticals, and electronics consume huge quantities of solvents, which creates demand for efficient recovery systems.
Vacuum evaporators purify used solvents such as acetone, isopropanol, or MEK without degradation so that they can be reused more effectively and with lower environmental impact. OFRU Recycling and DürrEcoclean are examples of companies offering high-performance evaporative recovery systems used in industrial labs and production units to distill and reuse costly solvents.
Both capital cities are benefiting from a transition taking place across the industry, which is increasingly tending toward green technologies and lower operational costs while agreeing with international waste and emissions standards.
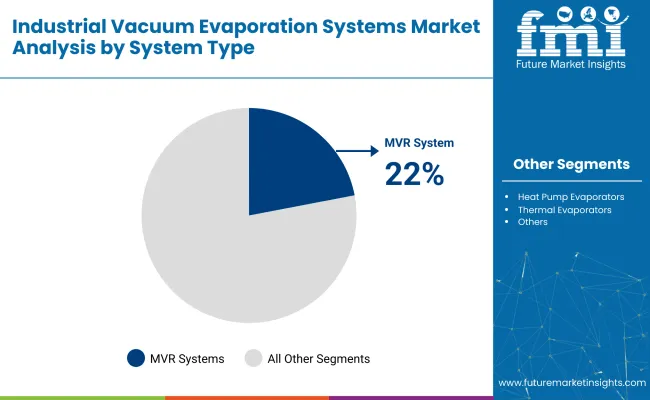
By system type, Mechanical Vapour Recompression (MVR) systems will account for 22% share, while Rotary Evaporators will represent about 20%.
MVR systems are increasingly well-regarded for their energy efficiency. By recycling latent heat from evaporated vapor, MVR cuts energy consumption down to an absolute minimum, thereby making it suitable for the treatment of very large volumes of wastewater in industries such as textile, pulp & paper, and food processing.
These MVR units have become established in the treatment of effluents in the galvanization sector and chemical sector, such as the ENVIDEST units of CondorchemEnvitech. Most MVR technology from Veolia’s Evaled RV series is utilized for surface treatment and pharmaceutical plants, consequently assisting clients in adhering to strict liquid waste discharge regulations while delivering drastic operational cost savings.
60% of the MVR systems segment is attributed to rotary evaporators, which are mostly used for laboratory and small-scale applications in industrial processes. This is useful in chemical synthesis, extraction of food ingredients, and R&D activities in pharmaceuticals since it enables very accurate control over the rate of evaporation under vacuum.
For example, the Rotavapor series from BUCHI is the world leader in laboratories and is often used in flavor product development and active ingredient purification. A second major vendor is Heidolph Instruments, which offers rotary evaporators adapted for optimal high-throughput workflows across biopharma and cannabis extraction industries.
While the MVR system is for high-volume industrial operations that aim to do so in a sustainable manner, rotary evaporators, in this case, remain indispensable in very specific applications. Together, both systems favor solvent recovery, process optimization, and environmentally conscious waste management, further cementing their standing in the industry. The demand for both, thus, correlates to the growing need for more flexible and efficient evaporation technologies across sectors.
The industrial vacuum evaporation systems industry is extremely competitive, led by leaders such as GEA Group, SUEZ, Veolia, PRAB, and BÜCHI Labortechnik AG, continuously advancing their technologies, increasing their reach strategically, as well as innovating in sustainability. These companies enhance energy efficiency, decrease operation costs, and improve automation across their product lines to keep their competitive edge.
GEA Group expanded its presence with an extensive product portfolio with advanced automation and IoT-driven monitoring in its vacuum evaporation solutions. SUEZ and Veolia tailor customized wastewater evaporation systems to meet current demands in pharmaceuticals, chemicals, and food processing. Both companies continue to acquire smaller firms across the world to complement their resources and expand their global footprint and technological capabilities.
PRAB has launched high-efficiency closed-loop vacuum evaporators dealing with waste discharge cost reductions, mainly focusing on the metalworking, aerospace, and automotive sectors. Other business focuses of BÜCHI Labortechnik AG are modular system designs that lend to small- to large-scale industrial applications for scalable solutions.
Heidolph Instruments GmbH and Company KG and GEMÜ Group, increasingly becoming well known, focus on energy-efficient and low-maintenance vacuum evaporation systems that directly target laboratories and research facilities. The applications of companies such as CondorchemEnvitech and ENCON Evaporators are strengthened with the launch of their multi-effect evaporation systems, which are designed to enhance the water recovery rates during industrial effluent treatment.
Sustainability and efficiency remain key drivers of competition, with companies investing in green technologies, low-carbon emission designs, and AI-driven monitoring systems to enhance productivity and compliance with stringent environmental regulations. The competitive landscape continues to evolve as emerging players integrate advanced automation and digital process optimization.
Market Share Analysis by Company
| Company Name | Market Share (%) |
|---|---|
| GEA Group | 15-20% |
| SUEZ | 12-16% |
| Veolia | 10-14% |
| PRAB | 8-12% |
| BÜCHI Labortechnik AG | 7-10% |
| Other Players | 40-50% |
| Company Name | Offerings & Activities |
|---|---|
| GEA Group | Expanding automated vacuum evaporation systems with IoT -driven efficiency optimization. |
| SUEZ | Offering advanced wastewater treatment solutions with enhanced water recovery rates. |
| Veolia | Strengthening industrial effluent evaporation solutions through acquisitions and R&D investments. |
| PRAB | Introducing high-efficiency closed-loop vacuum evaporators for waste cost reduction. |
| BÜCHI Labortechnik AG | Focusing on modular and scalable evaporation systems for industrial and laboratory applications. |
Key Company Insights
GEA Group (15-20%)
A leader in automated vacuum evaporation solutions, integrating IoT-driven performance monitoring for optimized wastewater treatment efficiency.
SUEZ (12-16%)
Expanding its sustainable industrial evaporation solutions, with a focus on high-efficiency multi-effect evaporators for water reuse.
Veolia (10-14%)
Getting stronger through strategic acquisitions, reinforcing its expertise in wastewater evaporation and industrial effluent recovery.
PRAB (8-12%)
Innovating in the metalworking and aerospace sectors with energy-efficient, cost-reducing closed-loop evaporation technologies.
BÜCHI Labortechnik AG (7-10%)
Focusing on scalability and modularity, enabling efficient vacuum evaporation solutions tailored for both small and large-scale applications.
Other Key Players
The segmentation is into Wastewater Treatment & Recycling, Solvent Recycling & Purification, Distillation, Synthesis, Concentration, Drying, and Recrystallization.
The segmentation is into Mechanical Vapour Recompression Evaporators, Heat Pump Evaporators, Co-Generation Hot & Cold Evaporators, Rotary Evaporators, and Thermal Evaporators. Thermal Evaporators are further segmented into Multiple Effect and Single Effect.
The segmentation is into Up to 100 Ltr/Day, 150 to 500 Ltr/Day, 500 to 1000 Ltr/Day, 1000 to 2000 Ltr/Day, 2000 to 4000 Ltr/Day, 4000 to 8000 Ltr/Day, 8000 to 20000 Ltr/Day, and 20000 to 50000 Ltr/Day.
The segmentation is into Pharmaceuticals, Chemicals, Metallurgy, Printing & Textiles, Oil & Petrochemicals, Food & Beverages, Semiconductors, Power Generation, and Medical & Research Laboratories.
The report covers North America, Latin America, Europe, Asia Pacific, and Middle East & Africa (MEA).
The industry valuation is estimated to reach USD 2.92 billion by 2025.
The industry is projected to grow to USD 5.38 billion by 2035.
China is expected to grow at a rate of 7.6%, supported by rapid industrialization and advancements in manufacturing technologies.
The wastewater treatment & recycling segment leads the application segment by accounting for a 28% share.
Key players in this industry include GEA Group, SUEZ, Veolia, PRAB, BÜCHI Labortechnik AG, Heidolph Instruments GmbH & CO. KG, GEMÜ Group, Condorchem Envitech, ENCON Evaporators, Eco-Techno SRL.


Our Research Products

The "Full Research Suite" delivers actionable market intel, deep dives on markets or technologies, so clients act faster, cut risk, and unlock growth.

The Leaderboard benchmarks and ranks top vendors, classifying them as Established Leaders, Leading Challengers, or Disruptors & Challengers.

Locates where complements amplify value and substitutes erode it, forecasting net impact by horizon

We deliver granular, decision-grade intel: market sizing, 5-year forecasts, pricing, adoption, usage, revenue, and operational KPIs—plus competitor tracking, regulation, and value chains—across 60 countries broadly.

Spot the shifts before they hit your P&L. We track inflection points, adoption curves, pricing moves, and ecosystem plays to show where demand is heading, why it is changing, and what to do next across high-growth markets and disruptive tech

Real-time reads of user behavior. We track shifting priorities, perceptions of today’s and next-gen services, and provider experience, then pace how fast tech moves from trial to adoption, blending buyer, consumer, and channel inputs with social signals (#WhySwitch, #UX).

Partner with our analyst team to build a custom report designed around your business priorities. From analysing market trends to assessing competitors or crafting bespoke datasets, we tailor insights to your needs.
Supplier Intelligence
Discovery & Profiling
Capacity & Footprint
Performance & Risk
Compliance & Governance
Commercial Readiness
Who Supplies Whom
Scorecards & Shortlists
Playbooks & Docs
Category Intelligence
Definition & Scope
Demand & Use Cases
Cost Drivers
Market Structure
Supply Chain Map
Trade & Policy
Operating Norms
Deliverables
Buyer Intelligence
Account Basics
Spend & Scope
Procurement Model
Vendor Requirements
Terms & Policies
Entry Strategy
Pain Points & Triggers
Outputs
Pricing Analysis
Benchmarks
Trends
Should-Cost
Indexation
Landed Cost
Commercial Terms
Deliverables
Brand Analysis
Positioning & Value Prop
Share & Presence
Customer Evidence
Go-to-Market
Digital & Reputation
Compliance & Trust
KPIs & Gaps
Outputs
Full Research Suite comprises of:
Market outlook & trends analysis
Interviews & case studies
Strategic recommendations
Vendor profiles & capabilities analysis
5-year forecasts
8 regions and 60+ country-level data splits
Market segment data splits
12 months of continuous data updates
DELIVERED AS:
PDF EXCEL ONLINE
Assessing Industrial Vacuum Cleaner Market Share & Trends
Industrial Vacuum Cleaners Market Growth - Trends & Forecast 2025 to 2035
Industrial Cooling Systems Market Size and Share Forecast Outlook 2025 to 2035
Industrial Embedded Systems Market Size and Share Forecast Outlook 2025 to 2035
Fire Protection Systems for Industrial Cooking Market Growth - Trends & Forecast 2025 to 2035
Industrial Grade Electrochemical CO Sensor Market Size and Share Forecast Outlook 2025 to 2035
Vacuum Heat Shrink Film Market Size and Share Forecast Outlook 2025 to 2035
Industrial Bench Scale Market Size and Share Forecast Outlook 2025 to 2035
Industrial Low Profile Floor Scale Market Size and Share Forecast Outlook 2025 to 2035
Vacuum Products for Emergency Services Market Size and Share Forecast Outlook 2025 to 2035
Industrial Sand Mill Market Size and Share Forecast Outlook 2025 to 2035
Industrial Control Network Modules Market Size and Share Forecast Outlook 2025 to 2035
Vacuum Fiber Feedthrough Flanges Market Size and Share Forecast Outlook 2025 to 2035
Industrial Precision Oven Market Size and Share Forecast Outlook 2025 to 2035
Industrial Water Chiller for PCB Market Size and Share Forecast Outlook 2025 to 2035
Vacuum Tension Rolls Market Size and Share Forecast Outlook 2025 to 2035
Industrial & Commercial HVLS Fans Market Size and Share Forecast Outlook 2025 to 2035
Industrial Robot Controller Market Size and Share Forecast Outlook 2025 to 2035
Industrial Wired Routers Market Size and Share Forecast Outlook 2025 to 2035
Industrial Evaporative Condensers Market Size and Share Forecast Outlook 2025 to 2035

Thank you!
You will receive an email from our Business Development Manager. Please be sure to check your SPAM/JUNK folder too.
Chat With
MaRIA