Reports

- Global Locations -

Headquarters

Future Market Insights, Inc.

Christiana Corporate, 200
Continental Drive, Suite 401,
Newark, Delaware - 19713,
United States

T: +1-845-579-5705

Americas

Future Market Insights, Inc.

616 Corporate Way, Suite 2-9018,
Valley Cottage, NY 10989, United States

T: +1-347-918-3531

MEA

Future Market Insights

1602-6 Jumeirah Bay X2 Tower, Plot No: JLT-PH2-X2A,
Jumeirah Lakes Towers, Dubai,
United Arab Emirates

Europe

Future Market Insights

3rd Floor, 207 Regent Street,
W1B 3HH London
United Kingdom

T: + 44 (0) 20 8123 9659
D: +44 (0) 20 3287 4268

Asia Pacific

Future Market Insights

IndiaLand Global Tech Park, Unit UG-1, Behind Grand HighStreet, Phase 1, Hinjawadi, MH, Pune – 411057, India

Long-term Care Software Market Outlook (2022-2032)

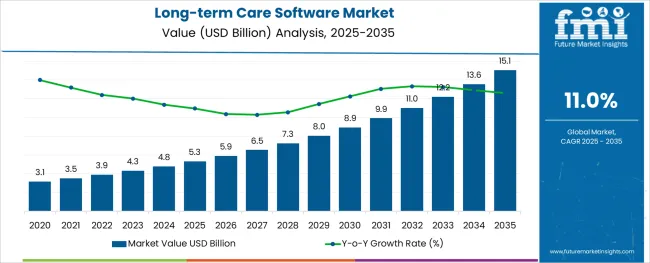
[304 Pages Report] The global long-term care software market size is estimated to be valued at US$ 3,877 Mn in 2022 and is anticipated to surpass US$ 10,988 Mn by 2032, with a CAGR of 11% during the forecast period (2022-2032).

Report Attribute Details
Long-term Care Software Market Value (2022) US$ 3,877 million
Long-term Care Software Market Anticipated Forecast Value (2032) US$ 10,988 million
Long-term Care Software Market Projected Growth Rate (2022-2032) 11%

The long-term care software market share is anticipated to be driven by increasing elderly population.

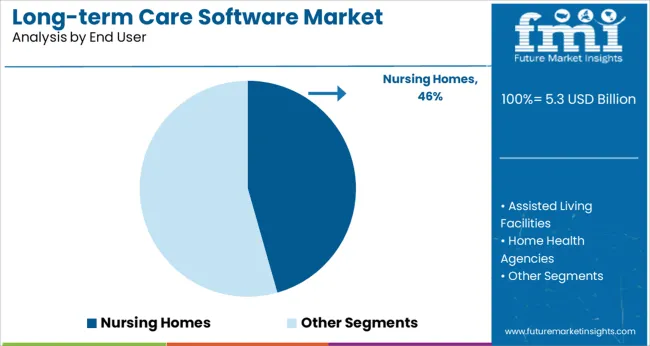
Furthermore, the sales of long-term care software are projected to grow in hospitals, home care settings, nursing homes, and other healthcare delivery settings.

Long-term care software is a technical service or solution that is utilized to address the clinical and non-clinical demands of patients and healthcare professionals. Due to these factors the demand for long-term care software is anticipated to grow during the forecast period.

The long-term care software programs make operating healthcare facilities simpler and more effective, which lowers healthcare expenses and improves efficiency.

The vital factor accelerating the demand for long-term care software is the rise in chronically ill patients as a result of the aging population.

Other factors propelling the demand for long-term care software include the need for lower healthcare costs, more nursing staff and doctors, more healthcare reforms and government initiatives.

Furthermore, the long-term care software market size is projected to grow due to the aging population, and the rising shortage of skilled staff and professionals for the provision of proper healthcare services.

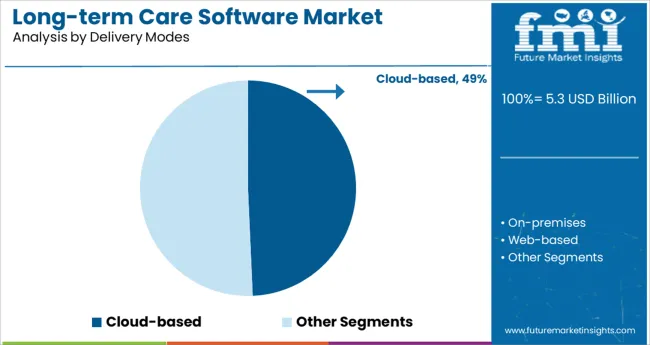
Additionally, the industry is seeing increased remote patient monitoring, and the long-term care software market is expected to see increased demand for cloud-based software throughout the anticipated period of 2022–2032.

Don't pay for what you don't need

Customize your report by selecting specific countries or regions and save 30%!

What are Some of the Prominent Drivers & Restraints in the Long-term Care Software Market?

The demand for long-term care software is expanding as a result of the digitalization of healthcare technologies. The long-term care software market's primary growth drivers include changing healthcare infrastructure, a staffing shortage, and the use of technological solutions in healthcare institutions.

The sales of long-term care software are also expanding due to a shortage of healthcare professionals and various efforts made by governments around the world to lower medical costs.

In addition, the rising use of mobile devices in healthcare organizations and the rise in the number of healthcare organizations are the major drivers of the long-term care software market expansion.

Due to advancements in the effectiveness and safety of drug treatment over the past few years, long-term care software has attracted a great deal of attention.

The primary reason driving the increase in demand for long-term care software is the growing requirement for healthcare IT solutions to boost long-term care facilities' operational effectiveness.

The long-term care software market outlook is expanding due to numerous government initiatives taken by governments around the world to reduce the rising expense of healthcare.

Applications of long-term care software, such the long-term care software, can manage remote patient video conferencing, scheduling, and messaging, analyze millions of data records, and swiftly identify possible difficulties before they become problems.

The primary factor that could hinder the growth of the long-term care software market in the near future is the high cost of software maintenance.

Furthermore, another possible challenge impeding the growth of the long-term care software industry in the near future is the resistance of the traditional long-term care providers to adopt new software.
What is the Regional Analysis of Long-term Care Software Market?

Due to the widespread use of long-term care software in this region, North America dominates the global long-term care software market with a share of 30.0%.

Due to the healthcare sector's rapid development and the widespread use of web-based and cloud-based long-term care software in developing nations, Europe is one of the regions with the highest expectations for growth in the long-term care software market.

Europe is anticipated to hold 19.7% of the overall long-term care software market share. Due to the healthcare industry's rapid infrastructure development, Europe's long-term care software market is anticipated to increase its share significantly throughout 2032.

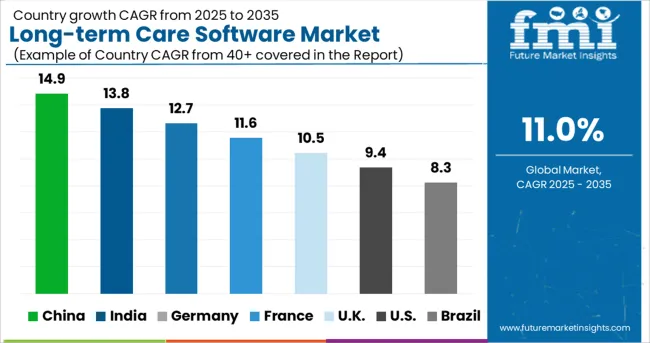
Additionally, due to government initiatives in the healthcare sector by emerging economies like India, China, and Japan, APAC is anticipated to have the greatest growth in the long-term care software market.

The National Institute on Aging (NIA) supports and assists in undertaking research on aging, as well as the health and wellbeing of senior citizens.

The National Association of States United for Aging and Disabilities (NASUAD), the Long-Term Care Choices Navigator in Minnesota, the Massachusetts Department of Elder Affairs, and the Georgia Department of Human Services (DHS) Division of Aging Services are just a few of the state-level initiatives.

Due to the advancement of digital technologies and the rising use of mobile devices in the region's healthcare industry, the long-term care software market in Latin America and MEA is anticipated to experience rapid expansion over the next years.
Sudip Saha
Sudip Saha

Principal Consultant

Talk to Analyst

Find your sweet spots for generating winning opportunities in this market.

Who are Some of the Prominent Players in the Long-term Care Software Market?

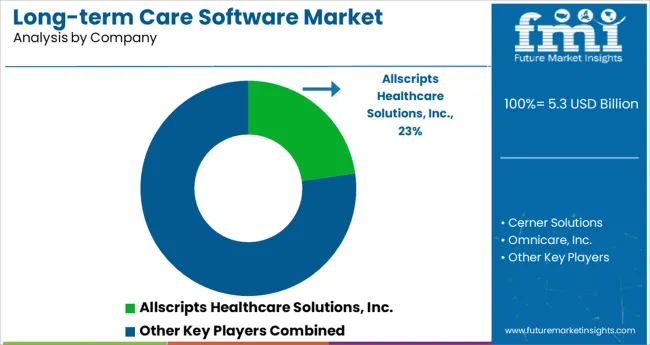
Allscripts Healthcare Solutions, Inc., Cerner Solutions, Omnicare, Inc., Omnicell, Inc., HealthMEDX, LLC, McKesson Corporation, Optimus EMR, Inc., PointClickCare, MatrixCare, and SigmaCare are some of the key players in long-term care software market.

Recent Developments in Long-term Care Software Market

  • By integrating TeleHealth Solution with PointClickCare's EHR Platform, which enables bidirectional data exchange, the two companies engaged into a cooperation in October 2020 to serve long-term care patients.
  • The SafeBeing platform was introduced by Somatix in March 2020 to assist caregivers in continuously monitoring and real-timely analyzing patients' daily routines in long-term nursing homes.

Get the data you need at a Fraction of the cost

Personalize your report by choosing insights you need
and save 40%!

Report Scope

Report Attribute Details
Growth Rate CAGR of 11% from 2022 to 2032
Base Year for Estimation 2021
Historical Data 2014-2020
Forecast Period 2022-2032
Quantitative Units Revenue in USD Million and CAGR from 2022-2032
Report Coverage Revenue Forecast, Volume Forecast, Company Ranking, Competitive Landscape, Growth Factors, Trends and Pricing Analysis
Segments Covered
  • Delivery modes
  • End-users
  • Region
Regions Covered
  • North America
  • Latin America
  • Europe
  • East Asia
  • South Asia
  • Oceania
  • Middle East and Africa
Key Countries Profiled
  • USA
  • Canada
  • Brazil
  • Argentina
  • Germany
  • UK
  • France
  • Spain
  • Italy
  • Nordics
  • BENELUX
  • Australia & New Zealand
  • China
  • India
  • ASEAN
  • GCC
  • South Africa
Key Companies Profiled
  • Cerner Corporation
  • Omnicare Inc
  • AOD Software
  • Kronos
  • PointClickCare
  • Omnicell, Inc
  • McKesson Corporation
  • Allscripts Healthcare Solutions, Inc.
  • MatrixCare
  • SigmaCare
  • Optimus EMR
  • HealthMEDX LLC.
Customization Available Upon Request

Key Segments

By Delivery Modes:

  • Cloud-based
  • On-premises
  • Web-based

By End User:

  • Assisted Living Facilities
  • Home Health Agencies
  • Nursing Homes

By Region:

  • North America
  • Latin America
  • Asia Pacific
  • Europe
  • MEA

Frequently Asked Questions

What is the Growth Outlook for the Long-term Care Software Market?

The global long-term care software market is set to advance at a CAGR of 11% from 2022 to 2032.

Which is the Estimated Long-term Care Software Market Share of North America?

North America is anticipated to hold a long-term care software market share of 30%.

Who is the Future of the Long-term Care Software Market?

The long-term care software market is likely to account for US$ 10,988 Mn by 2032.

Table of Content

1. Executive Summary

    1.1. Global Market Outlook

    1.2. Demand-side Trends

    1.3. Supply-side Trends

    1.4. Technology Roadmap Analysis

    1.5. Analysis and Recommendations

2. Market Overview

    2.1. Market Coverage / Taxonomy

    2.2. Market Definition / Scope / Limitations

3. Market Background

    3.1. Market Dynamics

        3.1.1. Drivers

        3.1.2. Restraints

        3.1.3. Opportunity

        3.1.4. Trends

    3.2. Scenario Forecast

        3.2.1. Demand in Optimistic Scenario

        3.2.2. Demand in Likely Scenario

        3.2.3. Demand in Conservative Scenario

    3.3. Opportunity Map Analysis

    3.4. Investment Feasibility Matrix

    3.5. PESTLE and Porter’s Analysis

    3.6. Regulatory Landscape

        3.6.1. By Key Regions

        3.6.2. By Key Countries

    3.7. Regional Parent Market Outlook

4. Global Market Analysis 2017-2021 and Forecast, 2022-2032

    4.1. Historical Market Size Value (US$ Mn) Analysis, 2017-2021

    4.2. Current and Future Market Size Value (US$ Mn) Projections, 2022-2032

        4.2.1. Y-o-Y Growth Trend Analysis

        4.2.2. Absolute $ Opportunity Analysis

5. Global Market Analysis 2017-2021 and Forecast 2022-2032, By Delivery Mode

    5.1. Introduction / Key Findings

    5.2. Historical Market Size Value (US$ Mn) Analysis By Delivery Mode, 2017-2021

    5.3. Current and Future Market Size Value (US$ Mn) Analysis and Forecast By Delivery Mode, 2022-2032

        5.3.1. On-premise

        5.3.2. Cloud-based

    5.4. Y-o-Y Growth Trend Analysis By Delivery Mode, 2017-2021

    5.5. Absolute $ Opportunity Analysis By Delivery Mode, 2022-2032

6. Global Market Analysis 2017-2021 and Forecast 2022-2032, By End-users

    6.1. Introduction / Key Findings

    6.2. Historical Market Size Value (US$ Mn) Analysis By End-users, 2017-2021

    6.3. Current and Future Market Size Value (US$ Mn) Analysis and Forecast By End-users, 2022-2032

        6.3.1. Home Healthcare Agencies

        6.3.2. Nursing Homes

        6.3.3. Hospice Care Facilities Provider

    6.4. Y-o-Y Growth Trend Analysis By End-users, 2017-2021

    6.5. Absolute $ Opportunity Analysis By End-users, 2022-2032

7. Global Market Analysis 2017-2021 and Forecast 2022-2032, By Region

    7.1. Introduction

    7.2. Historical Market Size Value (US$ Mn) Analysis By Region, 2017-2021

    7.3. Current Market Size Value (US$ Mn) Analysis and Forecast By Region, 2022-2032

        7.3.1. North America

        7.3.2. Latin America

        7.3.3. Europe

        7.3.4. Asia Pacific

        7.3.5. MEA

    7.4. Market Attractiveness Analysis By Region

8. North America Market Analysis 2017-2021 and Forecast 2022-2032, By Country

    8.1. Historical Market Size Value (US$ Mn) Trend Analysis By Market Taxonomy, 2017-2021

    8.2. Market Size Value (US$ Mn) Forecast By Market Taxonomy, 2022-2032

        8.2.1. By Country

            8.2.1.1. U.K.

            8.2.1.2. Canada

        8.2.2. By Delivery Mode

        8.2.3. By End-users

    8.3. Market Attractiveness Analysis

        8.3.1. By Country

        8.3.2. By Delivery Mode

        8.3.3. By End-users

    8.4. Key Takeaways

9. Latin America Market Analysis 2017-2021 and Forecast 2022-2032, By Country

    9.1. Historical Market Size Value (US$ Mn) Trend Analysis By Market Taxonomy, 2017-2021

    9.2. Market Size Value (US$ Mn) Forecast By Market Taxonomy, 2022-2032

        9.2.1. By Country

            9.2.1.1. Brazil

            9.2.1.2. Mexico

            9.2.1.3. Rest of Latin America

        9.2.2. By Delivery Mode

        9.2.3. By End-users

    9.3. Market Attractiveness Analysis

        9.3.1. By Country

        9.3.2. By Delivery Mode

        9.3.3. By End-users

    9.4. Key Takeaways

10. Europe Market Analysis 2017-2021 and Forecast 2022-2032, By Country

    10.1. Historical Market Size Value (US$ Mn) Trend Analysis By Market Taxonomy, 2017-2021

    10.2. Market Size Value (US$ Mn) Forecast By Market Taxonomy, 2022-2032

        10.2.1. By Country

            10.2.1.1. Germany

            10.2.1.2. U.K.

            10.2.1.3. France

            10.2.1.4. Spain

            10.2.1.5. Italy

            10.2.1.6. Rest of Europe

        10.2.2. By Delivery Mode

        10.2.3. By End-users

    10.3. Market Attractiveness Analysis

        10.3.1. By Country

        10.3.2. By Delivery Mode

        10.3.3. By End-users

    10.4. Key Takeaways

11. Asia Pacific Market Analysis 2017-2021 and Forecast 2022-2032, By Country

    11.1. Historical Market Size Value (US$ Mn) Trend Analysis By Market Taxonomy, 2017-2021

    11.2. Market Size Value (US$ Mn) Forecast By Market Taxonomy, 2022-2032

        11.2.1. By Country

            11.2.1.1. China

            11.2.1.2. Japan

            11.2.1.3. South Korea

            11.2.1.4. Malaysia

            11.2.1.5. Singapore

            11.2.1.6. Australia

            11.2.1.7. Rest of Asia Pacific

        11.2.2. By Delivery Mode

        11.2.3. By End-users

    11.3. Market Attractiveness Analysis

        11.3.1. By Country

        11.3.2. By Delivery Mode

        11.3.3. By End-users

    11.4. Key Takeaways

12. MEA Market Analysis 2017-2021 and Forecast 2022-2032, By Country

    12.1. Historical Market Size Value (US$ Mn) Trend Analysis By Market Taxonomy, 2017-2021

    12.2. Market Size Value (US$ Mn) Forecast By Market Taxonomy, 2022-2032

        12.2.1. By Country

            12.2.1.1. GCC Countries

            12.2.1.2. South Africa

            12.2.1.3. Israel

            12.2.1.4. Rest of MEA

        12.2.2. By Delivery Mode

        12.2.3. By End-users

    12.3. Market Attractiveness Analysis

        12.3.1. By Country

        12.3.2. By Delivery Mode

        12.3.3. By End-users

    12.4. Key Takeaways

13. Key Countries Market Analysis

    13.1. U.K.

        13.1.1. Pricing Analysis

        13.1.2. Market Share Analysis, 2021

            13.1.2.1. By Delivery Mode

            13.1.2.2. By End-users

    13.2. Canada

        13.2.1. Pricing Analysis

        13.2.2. Market Share Analysis, 2021

            13.2.2.1. By Delivery Mode

            13.2.2.2. By End-users

    13.3. Brazil

        13.3.1. Pricing Analysis

        13.3.2. Market Share Analysis, 2021

            13.3.2.1. By Delivery Mode

            13.3.2.2. By End-users

    13.4. Mexico

        13.4.1. Pricing Analysis

        13.4.2. Market Share Analysis, 2021

            13.4.2.1. By Delivery Mode

            13.4.2.2. By End-users

    13.5. Rest of Latin America

        13.5.1. Pricing Analysis

        13.5.2. Market Share Analysis, 2021

            13.5.2.1. By Delivery Mode

            13.5.2.2. By End-users

    13.6. Germany

        13.6.1. Pricing Analysis

        13.6.2. Market Share Analysis, 2021

            13.6.2.1. By Delivery Mode

            13.6.2.2. By End-users

    13.7. U.K.

        13.7.1. Pricing Analysis

        13.7.2. Market Share Analysis, 2021

            13.7.2.1. By Delivery Mode

            13.7.2.2. By End-users

    13.8. France

        13.8.1. Pricing Analysis

        13.8.2. Market Share Analysis, 2021

            13.8.2.1. By Delivery Mode

            13.8.2.2. By End-users

    13.9. Spain

        13.9.1. Pricing Analysis

        13.9.2. Market Share Analysis, 2021

            13.9.2.1. By Delivery Mode

            13.9.2.2. By End-users

    13.10. Italy

        13.10.1. Pricing Analysis

        13.10.2. Market Share Analysis, 2021

            13.10.2.1. By Delivery Mode

            13.10.2.2. By End-users

    13.11. Rest of Europe

        13.11.1. Pricing Analysis

        13.11.2. Market Share Analysis, 2021

            13.11.2.1. By Delivery Mode

            13.11.2.2. By End-users

    13.12. China

        13.12.1. Pricing Analysis

        13.12.2. Market Share Analysis, 2021

            13.12.2.1. By Delivery Mode

            13.12.2.2. By End-users

    13.13. Japan

        13.13.1. Pricing Analysis

        13.13.2. Market Share Analysis, 2021

            13.13.2.1. By Delivery Mode

            13.13.2.2. By End-users

    13.14. South Korea

        13.14.1. Pricing Analysis

        13.14.2. Market Share Analysis, 2021

            13.14.2.1. By Delivery Mode

            13.14.2.2. By End-users

    13.15. Malaysia

        13.15.1. Pricing Analysis

        13.15.2. Market Share Analysis, 2021

            13.15.2.1. By Delivery Mode

            13.15.2.2. By End-users

    13.16. Singapore

        13.16.1. Pricing Analysis

        13.16.2. Market Share Analysis, 2021

            13.16.2.1. By Delivery Mode

            13.16.2.2. By End-users

    13.17. Australia

        13.17.1. Pricing Analysis

        13.17.2. Market Share Analysis, 2021

            13.17.2.1. By Delivery Mode

            13.17.2.2. By End-users

    13.18. Rest of Asia Pacific

        13.18.1. Pricing Analysis

        13.18.2. Market Share Analysis, 2021

            13.18.2.1. By Delivery Mode

            13.18.2.2. By End-users

    13.19. GCC Countries

        13.19.1. Pricing Analysis

        13.19.2. Market Share Analysis, 2021

            13.19.2.1. By Delivery Mode

            13.19.2.2. By End-users

    13.20. South Africa

        13.20.1. Pricing Analysis

        13.20.2. Market Share Analysis, 2021

            13.20.2.1. By Delivery Mode

            13.20.2.2. By End-users

    13.21. Israel

        13.21.1. Pricing Analysis

        13.21.2. Market Share Analysis, 2021

            13.21.2.1. By Delivery Mode

            13.21.2.2. By End-users

    13.22. Rest of MEA

        13.22.1. Pricing Analysis

        13.22.2. Market Share Analysis, 2021

            13.22.2.1. By Delivery Mode

            13.22.2.2. By End-users

14. Market Structure Analysis

    14.1. Competition Dashboard

    14.2. Competition Benchmarking

    14.3. Market Share Analysis of Top Players

        14.3.1. By Regional

        14.3.2. By Delivery Mode

        14.3.3. By End-users

15. Competition Analysis

    15.1. Competition Deep Dive

        15.1.1. Allscripts Healthcare Solutions, Inc.

            15.1.1.1. Overview

            15.1.1.2. Product Portfolio

            15.1.1.3. Profitability by Market Segments

            15.1.1.4. Sales Footprint

            15.1.1.5. Strategy Overview

                15.1.1.5.1. Marketing Strategy

        15.1.2. Cerner Solutions

            15.1.2.1. Overview

            15.1.2.2. Product Portfolio

            15.1.2.3. Profitability by Market Segments

            15.1.2.4. Sales Footprint

            15.1.2.5. Strategy Overview

                15.1.2.5.1. Marketing Strategy

        15.1.3. Omnicare, Inc.

            15.1.3.1. Overview

            15.1.3.2. Product Portfolio

            15.1.3.3. Profitability by Market Segments

            15.1.3.4. Sales Footprint

            15.1.3.5. Strategy Overview

                15.1.3.5.1. Marketing Strategy

        15.1.4. Omnicell, Inc.

            15.1.4.1. Overview

            15.1.4.2. Product Portfolio

            15.1.4.3. Profitability by Market Segments

            15.1.4.4. Sales Footprint

            15.1.4.5. Strategy Overview

                15.1.4.5.1. Marketing Strategy

        15.1.5. HealthMEDX, LLC

            15.1.5.1. Overview

            15.1.5.2. Product Portfolio

            15.1.5.3. Profitability by Market Segments

            15.1.5.4. Sales Footprint

            15.1.5.5. Strategy Overview

                15.1.5.5.1. Marketing Strategy

        15.1.6. McKesson Corporation

            15.1.6.1. Overview

            15.1.6.2. Product Portfolio

            15.1.6.3. Profitability by Market Segments

            15.1.6.4. Sales Footprint

            15.1.6.5. Strategy Overview

                15.1.6.5.1. Marketing Strategy

        15.1.7. Optimus EMR

            15.1.7.1. Overview

            15.1.7.2. Product Portfolio

            15.1.7.3. Profitability by Market Segments

            15.1.7.4. Sales Footprint

            15.1.7.5. Strategy Overview

                15.1.7.5.1. Marketing Strategy

        15.1.8. PointClickCare

            15.1.8.1. Overview

            15.1.8.2. Product Portfolio

            15.1.8.3. Profitability by Market Segments

            15.1.8.4. Sales Footprint

            15.1.8.5. Strategy Overview

                15.1.8.5.1. Marketing Strategy

        15.1.9. MatrixCare

            15.1.9.1. Overview

            15.1.9.2. Product Portfolio

            15.1.9.3. Profitability by Market Segments

            15.1.9.4. Sales Footprint

            15.1.9.5. Strategy Overview

                15.1.9.5.1. Marketing Strategy

        15.1.10. SigmaCare

            15.1.10.1. Overview

            15.1.10.2. Product Portfolio

            15.1.10.3. Profitability by Market Segments

            15.1.10.4. Sales Footprint

            15.1.10.5. Strategy Overview

                15.1.10.5.1. Marketing Strategy

16. Assumptions & Acronyms Used

17. Research Methodology

Don't pay for what you don't need

Customize your report by selecting specific countries or regions and save 30%!

List of Tables

Table 1: Global Market Value (US$ Mn) Forecast by Region, 2017-2032

Table 2: Global Market Value (US$ Mn) Forecast by Delivery Mode, 2017-2032

Table 3: Global Market Value (US$ Mn) Forecast by End-users, 2017-2032

Table 4: North America Market Value (US$ Mn) Forecast by Country, 2017-2032

Table 5: North America Market Value (US$ Mn) Forecast by Delivery Mode, 2017-2032

Table 6: North America Market Value (US$ Mn) Forecast by End-users, 2017-2032

Table 7: Latin America Market Value (US$ Mn) Forecast by Country, 2017-2032

Table 8: Latin America Market Value (US$ Mn) Forecast by Delivery Mode, 2017-2032

Table 9: Latin America Market Value (US$ Mn) Forecast by End-users, 2017-2032

Table 10: Europe Market Value (US$ Mn) Forecast by Country, 2017-2032

Table 11: Europe Market Value (US$ Mn) Forecast by Delivery Mode, 2017-2032

Table 12: Europe Market Value (US$ Mn) Forecast by End-users, 2017-2032

Table 13: Asia Pacific Market Value (US$ Mn) Forecast by Country, 2017-2032

Table 14: Asia Pacific Market Value (US$ Mn) Forecast by Delivery Mode, 2017-2032

Table 15: Asia Pacific Market Value (US$ Mn) Forecast by End-users, 2017-2032

Table 16: MEA Market Value (US$ Mn) Forecast by Country, 2017-2032

Table 17: MEA Market Value (US$ Mn) Forecast by Delivery Mode, 2017-2032

Table 18: MEA Market Value (US$ Mn) Forecast by End-users, 2017-2032
Sudip Saha
Sudip Saha

Principal Consultant

Talk to Analyst

Find your sweet spots for generating winning opportunities in this market.

List of Charts

Figure 1: Global Market Value (US$ Mn) by Delivery Mode, 2022-2032

Figure 2: Global Market Value (US$ Mn) by End-users, 2022-2032

Figure 3: Global Market Value (US$ Mn) by Region, 2022-2032

Figure 4: Global Market Value (US$ Mn) Analysis by Region, 2017-2032

Figure 5: Global Market Value Share (%) and BPS Analysis by Region, 2022-2032

Figure 6: Global Market Y-o-Y Growth (%) Projections by Region, 2022-2032

Figure 7: Global Market Value (US$ Mn) Analysis by Delivery Mode, 2017-2032

Figure 8: Global Market Value Share (%) and BPS Analysis by Delivery Mode, 2022-2032

Figure 9: Global Market Y-o-Y Growth (%) Projections by Delivery Mode, 2022-2032

Figure 10: Global Market Value (US$ Mn) Analysis by End-users, 2017-2032

Figure 11: Global Market Value Share (%) and BPS Analysis by End-users, 2022-2032

Figure 12: Global Market Y-o-Y Growth (%) Projections by End-users, 2022-2032

Figure 13: Global Market Attractiveness by Delivery Mode, 2022-2032

Figure 14: Global Market Attractiveness by End-users, 2022-2032

Figure 15: Global Market Attractiveness by Region, 2022-2032

Figure 16: North America Market Value (US$ Mn) by Delivery Mode, 2022-2032

Figure 17: North America Market Value (US$ Mn) by End-users, 2022-2032

Figure 18: North America Market Value (US$ Mn) by Country, 2022-2032

Figure 19: North America Market Value (US$ Mn) Analysis by Country, 2017-2032

Figure 20: North America Market Value Share (%) and BPS Analysis by Country, 2022-2032

Figure 21: North America Market Y-o-Y Growth (%) Projections by Country, 2022-2032

Figure 22: North America Market Value (US$ Mn) Analysis by Delivery Mode, 2017-2032

Figure 23: North America Market Value Share (%) and BPS Analysis by Delivery Mode, 2022-2032

Figure 24: North America Market Y-o-Y Growth (%) Projections by Delivery Mode, 2022-2032

Figure 25: North America Market Value (US$ Mn) Analysis by End-users, 2017-2032

Figure 26: North America Market Value Share (%) and BPS Analysis by End-users, 2022-2032

Figure 27: North America Market Y-o-Y Growth (%) Projections by End-users, 2022-2032

Figure 28: North America Market Attractiveness by Delivery Mode, 2022-2032

Figure 29: North America Market Attractiveness by End-users, 2022-2032

Figure 30: North America Market Attractiveness by Country, 2022-2032

Figure 31: Latin America Market Value (US$ Mn) by Delivery Mode, 2022-2032

Figure 32: Latin America Market Value (US$ Mn) by End-users, 2022-2032

Figure 33: Latin America Market Value (US$ Mn) by Country, 2022-2032

Figure 34: Latin America Market Value (US$ Mn) Analysis by Country, 2017-2032

Figure 35: Latin America Market Value Share (%) and BPS Analysis by Country, 2022-2032

Figure 36: Latin America Market Y-o-Y Growth (%) Projections by Country, 2022-2032

Figure 37: Latin America Market Value (US$ Mn) Analysis by Delivery Mode, 2017-2032

Figure 38: Latin America Market Value Share (%) and BPS Analysis by Delivery Mode, 2022-2032

Figure 39: Latin America Market Y-o-Y Growth (%) Projections by Delivery Mode, 2022-2032

Figure 40: Latin America Market Value (US$ Mn) Analysis by End-users, 2017-2032

Figure 41: Latin America Market Value Share (%) and BPS Analysis by End-users, 2022-2032

Figure 42: Latin America Market Y-o-Y Growth (%) Projections by End-users, 2022-2032

Figure 43: Latin America Market Attractiveness by Delivery Mode, 2022-2032

Figure 44: Latin America Market Attractiveness by End-users, 2022-2032

Figure 45: Latin America Market Attractiveness by Country, 2022-2032

Figure 46: Europe Market Value (US$ Mn) by Delivery Mode, 2022-2032

Figure 47: Europe Market Value (US$ Mn) by End-users, 2022-2032

Figure 48: Europe Market Value (US$ Mn) by Country, 2022-2032

Figure 49: Europe Market Value (US$ Mn) Analysis by Country, 2017-2032

Figure 50: Europe Market Value Share (%) and BPS Analysis by Country, 2022-2032

Figure 51: Europe Market Y-o-Y Growth (%) Projections by Country, 2022-2032

Figure 52: Europe Market Value (US$ Mn) Analysis by Delivery Mode, 2017-2032

Figure 53: Europe Market Value Share (%) and BPS Analysis by Delivery Mode, 2022-2032

Figure 54: Europe Market Y-o-Y Growth (%) Projections by Delivery Mode, 2022-2032

Figure 55: Europe Market Value (US$ Mn) Analysis by End-users, 2017-2032

Figure 56: Europe Market Value Share (%) and BPS Analysis by End-users, 2022-2032

Figure 57: Europe Market Y-o-Y Growth (%) Projections by End-users, 2022-2032

Figure 58: Europe Market Attractiveness by Delivery Mode, 2022-2032

Figure 59: Europe Market Attractiveness by End-users, 2022-2032

Figure 60: Europe Market Attractiveness by Country, 2022-2032

Figure 61: Asia Pacific Market Value (US$ Mn) by Delivery Mode, 2022-2032

Figure 62: Asia Pacific Market Value (US$ Mn) by End-users, 2022-2032

Figure 63: Asia Pacific Market Value (US$ Mn) by Country, 2022-2032

Figure 64: Asia Pacific Market Value (US$ Mn) Analysis by Country, 2017-2032

Figure 65: Asia Pacific Market Value Share (%) and BPS Analysis by Country, 2022-2032

Figure 66: Asia Pacific Market Y-o-Y Growth (%) Projections by Country, 2022-2032

Figure 67: Asia Pacific Market Value (US$ Mn) Analysis by Delivery Mode, 2017-2032

Figure 68: Asia Pacific Market Value Share (%) and BPS Analysis by Delivery Mode, 2022-2032

Figure 69: Asia Pacific Market Y-o-Y Growth (%) Projections by Delivery Mode, 2022-2032

Figure 70: Asia Pacific Market Value (US$ Mn) Analysis by End-users, 2017-2032

Figure 71: Asia Pacific Market Value Share (%) and BPS Analysis by End-users, 2022-2032

Figure 72: Asia Pacific Market Y-o-Y Growth (%) Projections by End-users, 2022-2032

Figure 73: Asia Pacific Market Attractiveness by Delivery Mode, 2022-2032

Figure 74: Asia Pacific Market Attractiveness by End-users, 2022-2032

Figure 75: Asia Pacific Market Attractiveness by Country, 2022-2032

Figure 76: MEA Market Value (US$ Mn) by Delivery Mode, 2022-2032

Figure 77: MEA Market Value (US$ Mn) by End-users, 2022-2032

Figure 78: MEA Market Value (US$ Mn) by Country, 2022-2032

Figure 79: MEA Market Value (US$ Mn) Analysis by Country, 2017-2032

Figure 80: MEA Market Value Share (%) and BPS Analysis by Country, 2022-2032

Figure 81: MEA Market Y-o-Y Growth (%) Projections by Country, 2022-2032

Figure 82: MEA Market Value (US$ Mn) Analysis by Delivery Mode, 2017-2032

Figure 83: MEA Market Value Share (%) and BPS Analysis by Delivery Mode, 2022-2032

Figure 84: MEA Market Y-o-Y Growth (%) Projections by Delivery Mode, 2022-2032

Figure 85: MEA Market Value (US$ Mn) Analysis by End-users, 2017-2032

Figure 86: MEA Market Value Share (%) and BPS Analysis by End-users, 2022-2032

Figure 87: MEA Market Y-o-Y Growth (%) Projections by End-users, 2022-2032

Figure 88: MEA Market Attractiveness by Delivery Mode, 2022-2032

Figure 89: MEA Market Attractiveness by End-users, 2022-2032

Figure 90: MEA Market Attractiveness by Country, 2022-2032

Recommendations

Healthcare

Healthcare IT Outsourcing Market

Published : August 2023

Healthcare

Long Term Post-Acute Care Software Market

Published : March 2023

Healthcare

Healthcare Interoperability Solutions Market

Published : February 2023

Explore Technology Insights

View Reports

Long-term Care Software Market