The Ops shrink label market is expected to grow from USD 437.8 million in 2025 to USD 713 million by 2035, reflecting a CAGR of 5%. Market growth is driven by increasing demand for flexible packaging solutions across industries, particularly in food and beverage, consumer goods, and pharmaceuticals. Ops shrink labels are widely used for product labeling and branding because they conform tightly to product contours, offering both functional and aesthetic benefits. The growth in consumer demand for convenient, visually appealing, and easy-to-use packaging is supporting the widespread adoption of shrink labels. In addition, the growing trend toward sustainability in packaging, with a focus on reducing plastic waste and improving recyclability, is driving the use of eco-friendly shrink label materials. As manufacturers seek innovative ways to enhance brand visibility, improve packaging efficiency, and improve product security, demand for Ops shrink labels will continue to rise.
Technological advancements in printing, materials science, and automation are also expected to drive market expansion. The use of advanced inks and printing techniques enables high-quality graphics on shrink labels, enhancing their appeal to both consumers and retailers. Additionally, the growing adoption of smart packaging solutions, such as labels with QR codes and RFID technology, will further enhance the market potential for Ops shrink labels. These innovations make it easier for companies to track product authenticity, increase consumer engagement, and provide additional product information. As packaging needs evolve, especially in developing economies with expanding retail sectors, the market for Ops shrink labels is poised to benefit from the growing trend toward customized packaging solutions.
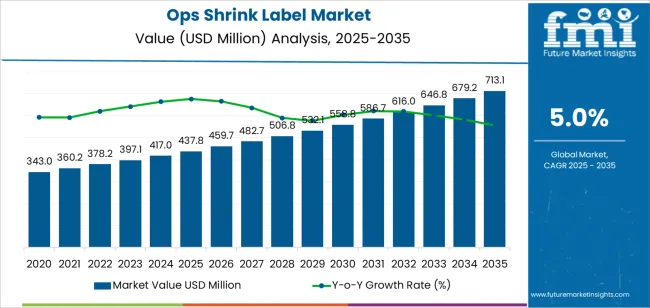
From 2025 to 2030, the market is projected to grow from USD 437.8 million to USD 558.7 million, an increase of USD 120.9 million. This growth will be driven by the expanding use of Ops shrink labels in consumer goods, food and beverage, and pharmaceutical packaging. The continued demand for high-quality packaging that is both functional and visually appealing will significantly boost the adoption of shrink labels. As consumer preferences for product differentiation and innovative packaging designs grow, manufacturers will increasingly rely on shrink labels to meet these needs, thereby driving market expansion.
Between 2030 and 2035, the market will expand from USD 558.7 million to USD 713 million, adding USD 154.3 million in value. This growth will be supported by the continued demand for eco-friendly and cost-effective packaging solutions, alongside the rise of smart packaging technologies. As sustainability remains a focal point for both consumers and regulatory bodies, manufacturers will increasingly adopt biodegradable and recyclable shrink label materials, further fueling the market. Additionally, the adoption of automation in packaging lines and increased focus on brand security will lead to further expansion of the Ops shrink label market through 2035.
| Metric | Value |
|---|---|
| Market Value (2025) | USD 437.8 million |
| Market Forecast Value (2035) | USD 713 million |
| Forecast CAGR (2025-2035) | 5% |
The OPS shrink label market is growing due to the increasing demand for enhanced packaging solutions in various industries such as food and beverage, personal care, and consumer goods. Shrink labels are popular for their ability to conform to the shape of the container, providing an attractive and secure packaging solution. The food and beverage sector, which accounts for 50% of the market share, drives much of the demand as companies seek packaging solutions that improve product visibility, branding effectiveness, and shelf appeal. The rising focus on sustainability and eco-friendly packaging also contributes to the adoption of shrink labels, particularly in the form of transparent and recyclable shrink films.
The market is expected to grow across emerging markets in Asia-Pacific, especially in China and India, where rising disposable income and urbanization are driving demand for packaged consumer goods. Moreover, the global trend towards premium and differentiated packaging is fueling the demand for shrink labels that offer high-quality designs and vibrant colors. As more industries look to enhance their product packaging, the OPS shrink label market is expected to continue its steady growth, particularly with the increased adoption of sustainable and customizable packaging solutions.
The OPS shrink label market is segmented by label classification and application, both of which reflect different needs in the global packaging industry. By classification, the market includes coloring and transparent labels, with coloring labels holding a dominant market share. By application, the market is divided into food and beverage, personal care, and other industries, with the food and beverage sector accounting for the largest portion of the market share. These segments vary in demand depending on industry needs and regional preferences, with growth driven largely by sustainability trends, customized packaging, and the desire for visually appealing labels that enhance product presentation.
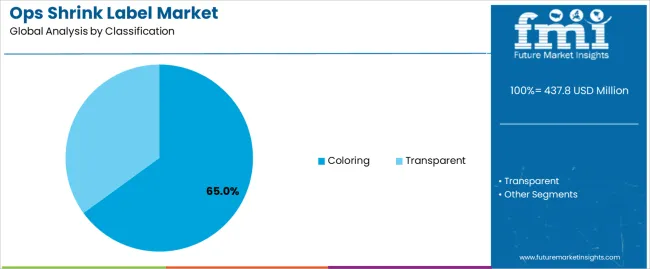
The coloring segment is the leading force in the OPS shrink label market, holding 65% of the total market share. This dominance is largely driven by the increasing demand for vibrant, visually striking labels that help products stand out in crowded retail environments. In industries like food and beverage, cosmetics, and personal care, brands rely heavily on colorful labels to enhance brand identity and attract consumer attention. Coloring shrink labels are preferred because they can be produced with high-quality graphics, offering superior visual appeal, which is essential in competitive markets where consumer engagement is key. As branding becomes increasingly important for businesses, companies are opting for customized labels that represent their unique identity, and the coloring segment offers versatility in design, texture, and print options. Moreover, the growing focus on eco-friendly packaging is pushing manufacturers to offer sustainable, recyclable shrink labels while maintaining their color intensity and design. With the expansion of the food and beverage industry, which constitutes the majority of the market, the coloring segment is expected to continue its dominance in the coming years as the demand for attractive and functional packaging solutions grows.
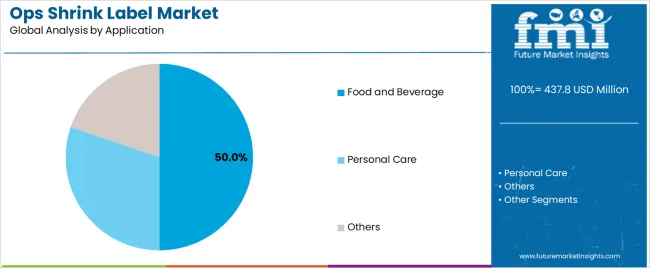
The food and beverage industry is the largest segment in the OPS shrink label market, holding 50% of the market share. This is primarily due to the high demand for packaging solutions that provide both aesthetic appeal and functional benefits. Shrink labels in the food and beverage industry are crucial for ensuring product visibility, enhancing branding efforts, and offering a tamper-proof seal. Coloring shrink labels are particularly popular in this sector, as they help create unique designs that can attract consumers in competitive retail environments. Additionally, shrink labels are ideal for sustainable packaging, as they are lightweight and can be made from recyclable materials, aligning with the growing consumer demand for eco-conscious products. As the global food and beverage market continues to grow, particularly in developing regions like Asia-Pacific, the demand for shrink labels that are visually appealing, functional, and environmentally responsible will increase. Furthermore, the rise of premium food products and limited edition packaging has boosted the need for custom shrink labels that offer a high-quality finish and can accommodate intricate designs. With the increasing importance of branding and differentiation in the food and beverage sector, the food and beverage application segment will continue to drive market growth, making it the largest contributor to the OPS shrink label market.
The OPS shrink label market is driven by growing demand for sustainable packaging and the increasing need for innovative and eye-catching designs in industries like food and beverage and personal care. Coloring labels continue to dominate due to their ability to enhance product visibility and brand recognition. The rising emphasis on eco-friendly materials, along with the increasing focus on energy-efficient and customized packaging solutions, drives the market further. Regions like China and India are rapidly adopting these packaging solutions due to their growing industrial sectors.
Key drivers of the OPS shrink label market include increasing demand for vibrant, customized packaging solutions that cater to brand differentiation and consumer engagement in industries such as food and beverage. The shift toward sustainable packaging solutions and eco-friendly materials is pushing more manufacturers to adopt shrink labels. In addition, automation and smart packaging technologies are facilitating the production of shrink labels with enhanced performance and aesthetics. Regulatory pressures to reduce environmental impact are also contributing to the adoption of more sustainable and recyclable shrink films.
Despite strong growth, the OPS shrink label market faces challenges such as the high cost of raw materials, particularly for high-quality, sustainable labels. Additionally, the complexity of regulatory compliance related to packaging materials in different regions may hinder the entry of some small players into the market. Manufacturing constraints and the need for specialized machinery to produce high-volume shrink labels can be limiting factors, especially for companies in developing regions. Furthermore, price sensitivity in some industries may result in slower adoption of more premium or sustainable shrink labeling solutions.
Key trends in the OPS shrink label market include the growing preference for sustainable and eco-friendly packaging solutions to meet consumer demands for environmentally responsible products. The rise of smart packaging and intelligent labeling with QR codes, digital integration, and brand authentication is also shaping the market. Additionally, the increasing focus on personalized and customized packaging for food and beverage products, driven by the need to stand out in competitive markets, is a major trend. Furthermore, automation in the production of shrink labels is enabling faster, cost-effective manufacturing processes, driving industry growth.
The global shrink label market is experiencing diverse growth rates across various countries. Shrink labels are widely used in packaging across numerous industries, including food and beverages, personal care, and pharmaceuticals. This report provides a detailed country-wise analysis of the Compound Annual Growth Rates (CAGR) for the shrink label market in different nations. Understanding these growth trends helps businesses identify opportunities for expansion, assess market potential, and guide strategic investments. By focusing on the top-performing countries, companies can position themselves effectively to capitalize on emerging trends and increase their market share.
Each country presents unique drivers and challenges, influencing their respective CAGRs. Economic growth, packaging innovation, consumer demand, and regional industry developments contribute to the varied performance of the shrink label market worldwide. This analysis highlights key markets and provides insights into the growth dynamics that will shape the industry in the coming years.
| Country | CAGR (2025-2035) |
|---|---|
| China | 6.8% |
| India | 6.3% |
| Germany | 5.8% |
| Brazil | 5.3% |
| USA | 4.8% |
| United Kingdom | 4.3% |
| Japan | 3.8% |
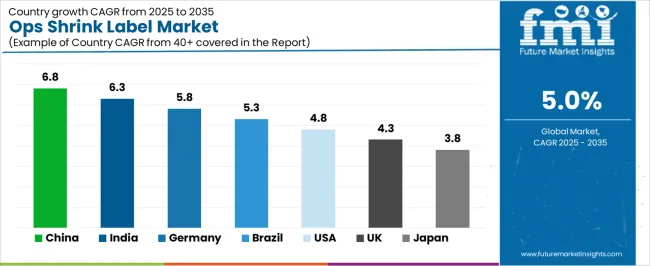
China, with an impressive CAGR of 6.8%, is leading the way in the global shrink label market. The country’s rapid industrialization, expansive manufacturing capabilities, and increasing demand for packaging solutions are key factors driving the growth of shrink labels. The growing consumer base, combined with a rise in packaged food and beverage products, has fueled the need for innovative labeling solutions. China's robust e-commerce industry also contributes to the demand for shrink labels, as packaging plays a significant role in the marketing and protection of products during shipping.
China's manufacturing sector continues to evolve, with a focus on sustainable packaging solutions and advanced technology in printing and labeling. The government’s push for environmental sustainability and the shift towards eco-friendly products are also encouraging the adoption of more efficient and recyclable packaging materials, including shrink labels. The country's leading position in production and consumption makes it a significant player in the global shrink label market, with continued growth expected in the near future.
India is witnessing strong growth in the shrink label market, with a projected CAGR of 6.3%. The country’s expanding middle class, rising disposable incomes, and increasing demand for packaged goods are major contributors to this growth. India’s food and beverage sector, in particular, is a significant driver of the shrink label market, as consumers demand more convenient and ready-to-eat options. As the country modernizes, the demand for visually appealing and informative packaging also rises, making shrink labels a popular choice among manufacturers.
India’s growing retail sector, both in physical stores and online, requires packaging that is both functional and aesthetically pleasing, further fueling the market for shrink labels. Additionally, the country's growing focus on sustainability and environmental concerns has led to the development of more eco-friendly shrink label solutions. This focus on packaging innovation and sustainability is expected to drive continued growth in the shrink label market in India, positioning it as a key market in the global landscape.
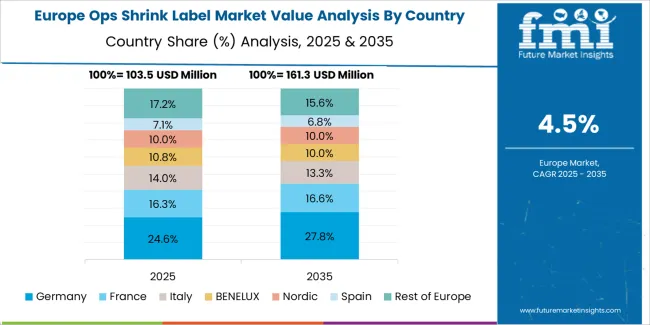
Germany, with a CAGR of 5.8%, holds a strong position in the European shrink label market. The country is known for its advanced manufacturing technologies and high-quality packaging standards, which are essential for the growth of the shrink label market. Germany's well-established automotive, consumer goods, and pharmaceutical industries contribute significantly to the demand for shrink labels. These sectors require packaging that meets high standards of durability, security, and branding, all of which are provided by shrink labels.
Germany’s emphasis on sustainability and the growing trend of eco-conscious consumerism are fostering the development of environmentally friendly shrink labeling solutions. The market for shrink labels in Germany is expected to remain strong, driven by innovation in packaging and increasing demand for high-quality, sustainable products. The country’s competitive industrial sector, combined with a focus on green technologies, positions Germany as a leading market for shrink labels in Europe.
Brazil is experiencing steady growth in the shrink label market, with a projected CAGR of 5.3%. As the largest economy in South America, Brazil’s expanding middle class and growing consumer market are key drivers of this growth. The country’s food and beverage industry, in particular, is increasingly relying on shrink labels for packaging, as manufacturers look for cost-effective, visually appealing, and functional solutions. Brazil’s diverse population and vibrant retail sector further contribute to the demand for shrink labels.
In addition to the growing consumer demand, Brazil’s focus on improving its packaging standards and reducing environmental impact is shaping the future of the shrink label market. The need for sustainable and recyclable packaging materials is growing, prompting innovation in the shrink label sector. Despite challenges like economic volatility and political instability, Brazil’s shrinking label market is poised for continued growth, especially as sustainability trends gain more traction in the country.
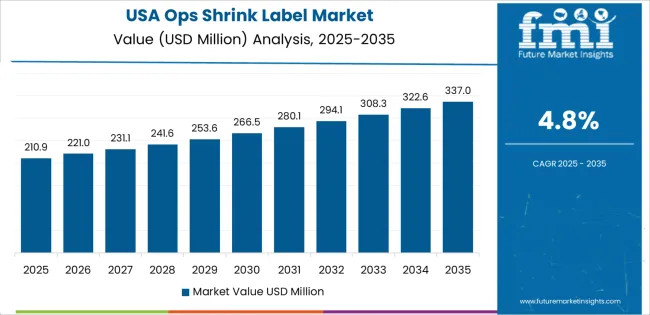
The United States, with a CAGR of 4.8%, represents a mature but growing market for shrink labels. The country's vast consumer market and demand for convenience in food, beverages, and personal care products continue to drive the growth of shrink labels. In particular, the food and beverage industry remains one of the largest sectors utilizing shrink labels for packaging purposes, driven by the increasing preference for ready-to-consume and pre-packaged items.
Technological advancements in printing and labeling, as well as the growing shift toward sustainable packaging, are also influencing the growth of shrink labels in the USA The demand for more eco-friendly and recyclable packaging solutions is prompting manufacturers to seek innovative shrink label options that align with these sustainability goals. While the USA market may not grow as quickly as emerging markets, the steady demand for shrink labels, driven by both consumer preferences and sustainability concerns, ensures a stable outlook for the future.
In the United Kingdom, the shrink label market is projected to grow at a CAGR of 4.3%. The UK’s highly developed retail and consumer goods sectors are key drivers behind the demand for shrink labels, particularly in food, beverages, and personal care packaging. Packaging plays a crucial role in marketing and product differentiation in the competitive UK market, which is why shrink labels are a popular choice for their aesthetic appeal and functionality.
The UK is increasingly focusing on sustainability, with regulations and consumer demand pushing for greener packaging solutions. The country's strong interest in reducing waste and increasing recycling rates is contributing to the adoption of eco-friendly shrink label options. While the UK faces challenges such as economic uncertainty post-Brexit, its commitment to innovation and sustainability will likely drive continued growth in the shrink label market.
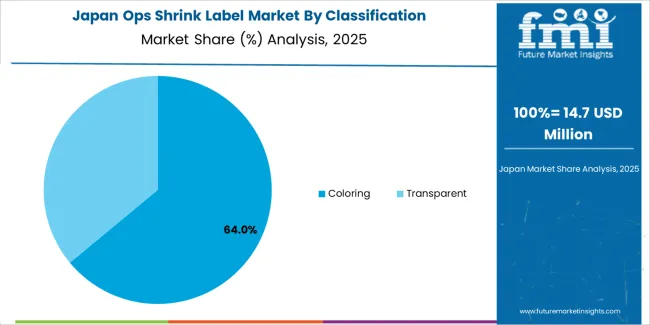
Japan’s shrink label market is projected to grow at a CAGR of 3.8%. Despite having a more mature economy, Japan’s demand for shrink labels remains steady, driven by industries such as food and beverages, pharmaceuticals, and consumer electronics. Packaging is an essential aspect of product marketing in Japan, where aesthetics and quality are highly valued by consumers.
Japan’s commitment to innovation, particularly in packaging technologies, is fostering the development of advanced shrink labels that offer better functionality and sustainability. As Japanese consumers become increasingly eco-conscious, there is a growing demand for recyclable and environmentally friendly packaging solutions. Despite challenges such as a shrinking population and slower economic growth, Japan’s focus on technological innovation and sustainability positions it for continued, albeit moderate, growth in the shrink label market.
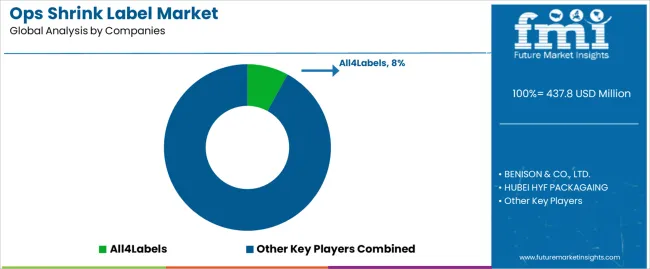
The OPS shrink label market is competitive, with several well-established global players, such as All4Labels, BENISON & CO., LTD., and HUBEI HYF Packaging, leading the market. These companies are highly focused on offering innovative, customizable shrink label solutions that meet the diverse needs of industries like food and beverage, personal care, and consumer goods. Their expertise in producing high-quality, eco-friendly, and cost-effective labels gives them a competitive edge. Market leaders are also investing in sustainability and recyclable shrink films to cater to the growing consumer demand for eco-conscious packaging. Additionally, these companies are expanding their regional presence, particularly in emerging markets such as Asia-Pacific, where rapid industrial growth and increasing demand for consumer goods are driving significant market opportunities.
Smaller, regional players like TPL Transparent Paper are also carving out a niche in the OPS shrink label market by providing specialized, cost-effective solutions and focusing on specific local demands. These companies leverage their ability to offer more personalized services and cater to the needs of smaller enterprises or regional markets. They often emphasize fast turnaround times, competitive pricing, and the ability to deliver tailored shrink labeling solutions. As competition increases, innovation in material usage, sustainability, and advanced printing technologies will be key drivers for companies seeking to maintain or enhance their market share. The global competitive landscape is expected to intensify as demand for high-quality, customizable, eco-friendly shrink labels continues to grow across multiple industries.
| Items | Details |
|---|---|
| Quantitative Units | USD Million |
| Regions Covered | North America, Europe, Asia Pacific, Latin America, Middle East & Africa |
| Classification | Coloring, Transparent |
| Application | Food and Beverage, Personal Care, Others |
| Key Companies Profiled | All4Labels, BENISON & CO., LTD., HUBEI HYF PACKAGING, TPL Transparent Paper |
| Additional Attributes | The market analysis includes dollar sales by classification and application categories. It also covers regional adoption trends across major markets such as North America, Europe, and Asia Pacific. The competitive landscape highlights key players in the OPS shrink label industry, focusing on innovations in labeling solutions for food, beverage, and personal care packaging. Trends in sustainability, material innovations, and the growing demand for labeling efficiency in packaging are explored. |
The global OPS shrink label market is estimated to be valued at USD 437.8 million in 2025.
The market size for the OPS shrink label market is projected to reach USD 713.1 million by 2035.
The OPS shrink label market is expected to grow at a 5.0% CAGR between 2025 and 2035.
The key product types in OPS shrink label market are coloring and transparent.
In terms of application, food and beverage segment to command 50.0% share in the OPS shrink label market in 2025.


Our Research Products

The "Full Research Suite" delivers actionable market intel, deep dives on markets or technologies, so clients act faster, cut risk, and unlock growth.

The Leaderboard benchmarks and ranks top vendors, classifying them as Established Leaders, Leading Challengers, or Disruptors & Challengers.

Locates where complements amplify value and substitutes erode it, forecasting net impact by horizon

We deliver granular, decision-grade intel: market sizing, 5-year forecasts, pricing, adoption, usage, revenue, and operational KPIs—plus competitor tracking, regulation, and value chains—across 60 countries broadly.

Spot the shifts before they hit your P&L. We track inflection points, adoption curves, pricing moves, and ecosystem plays to show where demand is heading, why it is changing, and what to do next across high-growth markets and disruptive tech

Real-time reads of user behavior. We track shifting priorities, perceptions of today’s and next-gen services, and provider experience, then pace how fast tech moves from trial to adoption, blending buyer, consumer, and channel inputs with social signals (#WhySwitch, #UX).

Partner with our analyst team to build a custom report designed around your business priorities. From analysing market trends to assessing competitors or crafting bespoke datasets, we tailor insights to your needs.
Supplier Intelligence
Discovery & Profiling
Capacity & Footprint
Performance & Risk
Compliance & Governance
Commercial Readiness
Who Supplies Whom
Scorecards & Shortlists
Playbooks & Docs
Category Intelligence
Definition & Scope
Demand & Use Cases
Cost Drivers
Market Structure
Supply Chain Map
Trade & Policy
Operating Norms
Deliverables
Buyer Intelligence
Account Basics
Spend & Scope
Procurement Model
Vendor Requirements
Terms & Policies
Entry Strategy
Pain Points & Triggers
Outputs
Pricing Analysis
Benchmarks
Trends
Should-Cost
Indexation
Landed Cost
Commercial Terms
Deliverables
Brand Analysis
Positioning & Value Prop
Share & Presence
Customer Evidence
Go-to-Market
Digital & Reputation
Compliance & Trust
KPIs & Gaps
Outputs
Full Research Suite comprises of:
Market outlook & trends analysis
Interviews & case studies
Strategic recommendations
Vendor profiles & capabilities analysis
5-year forecasts
8 regions and 60+ country-level data splits
Market segment data splits
12 months of continuous data updates
DELIVERED AS:
PDF EXCEL ONLINE
Hops Essential Oil Market Size and Share Forecast Outlook 2025 to 2035
Market Share Distribution Among Hops Manufacturers
AIOps Platform Market Forecast and Outlook 2025 to 2035
Biopsy Device Market Forecast and Outlook 2025 to 2035
Biopsy Guidance System Market Size and Share Forecast Outlook 2025 to 2035
NetOps Market Size and Share Forecast Outlook 2025 to 2035
RevOps Platform Market Insights – Growth & Forecast 2023-2033
DataOps Platform Market Size and Share Forecast Outlook 2025 to 2035
DevSecOps Market Size and Share Forecast Outlook 2025 to 2035
Waterstops Market Size and Share Forecast Outlook 2025 to 2035
Microbiopsy Market Size and Share Forecast Outlook 2025 to 2035
Lung Biopsy Systems Market Size and Share Forecast Outlook 2025 to 2035
Robot Mops Market
Breast Biopsy Market Size and Share Forecast Outlook 2025 to 2035
Cancer Biopsy Market - Growth & Technological Innovations 2025 to 2035
Breast Biopsy Devices Market Analysis - Innovations & Forecast 2025 to 2035
Liquid Biopsy Market Analysis - Size, Share, and Forecast Outlook 2025 to 2035
Flavor Drops Market Growth - Beverage & Functional Trends 2025 to 2035
Fischer-Tropsch (FT) Wax Market Size and Share Forecast Outlook 2025 to 2035
Nannochloropsis Market Size and Share Forecast Outlook 2025 to 2035

Thank you!
You will receive an email from our Business Development Manager. Please be sure to check your SPAM/JUNK folder too.
Chat With
MaRIA