

- Market Size (2026)
- USD 656.6 Mn
- Forecast (2036)
- USD 1328.3 Mn
- CAGR (2026 to 2036)
- 7.3%
Quick-Access Maintenance-Friendly Interior Panel Systems Market Outlook for 2026 to 2036
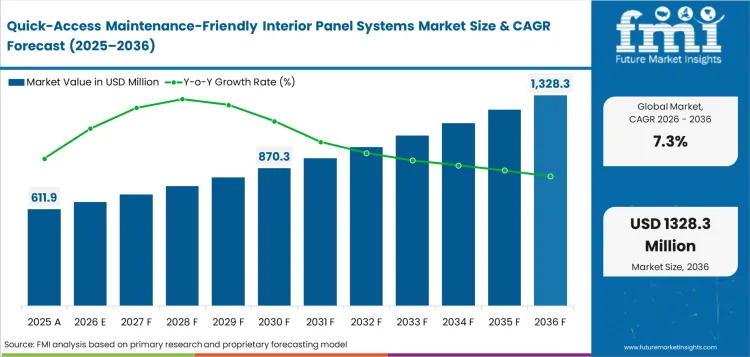
Quick-access maintenance-friendly interior panel systems demand was valued at USD 611.9 million in 2025 and is projected to reach USD 656.6 million in 2026. It is forecast to reach USD 1,328.3 million by 2036 at 7.3% CAGR. Sidewall panels are projected to lead panel position demand with 38.0% share in 2026. Honeycomb composite panels are expected to account for 51.0% share of material system demand in 2026.
Airline cabin work is favoring panels that reduce downtime during inspection and repair. Airbus delivered 793 commercial aircraft in 2025 and closed the year with a backlog of 8,754 aircraft. The Airbus backlog keeps new cabin fit and later access needs visible. Boeing reported 600 commercial deliveries in 2025 and a backlog of over 6,100 commercial airplanes. Narrowbody cabin programs remain a large source of panel demand. Delivery and backlog signals support closer links between aircraft cabin interiors and cabin reconfiguration and retrofit MRO services across airline fleets.
Summary of the Quick-Access Maintenance-Friendly Interior Panel Systems Market
- Demand and Growth Drivers
- Airlines are shortening cabin access time as maintenance teams inspect wiring and ducts behind panels.
- Interior modification shops are shifting toward modular panel kits that fit scheduled heavy checks.
- Fire-rated lightweight panels are gaining attention as operators try to control weight and maintenance labor.
- Aftermarket spares are rising in value as fleets stay active for longer periods before replacement.
- Product and Segment View
- Sidewall panels are projected to lead the panel position segment with 38.0% share in 2026 since they carry frequent access points.
- Honeycomb composite panels are expected to lead the material system segment with 51.0% share due to weight and stiffness needs.
- Quarter-turn hardware is anticipated to lead access hardware with 47.0% share in 2026 as mechanics need repeatable fast opening.
- Retrofit kits are projected to hold 45.0% share in 2026 when airlines upgrade cabins during planned checks.
- Aircraft floor panels remain adjacent to panel systems because load paths and access points often share cabin work packages.
- Geography and Competitive Outlook
- India is forecast at 9.1% CAGR by 2036 as aircraft additions create new cabin panel and spares needs.
- China is projected at 8.3% CAGR by 2036 as passenger volumes and fleet growth support line-fit demand.
- Collins Aerospace and Safran Cabin shape global cabin system supply with broad airline and OEM access.
- Diehl Aviation and FACC are established in cabin modules where panel design and certified production meet.
- Jamco and The Gill Corporation serve defined interior equipment and panel material needs across aviation fleets.
- Analyst Opinion
- Nikhil Kaitwade, Principal Consultant at Future Market Insights says, “The opportunity in quick-access maintenance-friendly interior panel systems is more than the panel surface. The real value comes from faster removaland repeat access during cabin checks. Suppliers that combine certified panels with reliable hardware and kit support are expected gain more airline work as fleets run tighter maintenance schedules.”
- Quick-Access Maintenance-Friendly Interior Panel Systems Market Value Analysis
- Supplier focus is moving from replacement panels to access-ready kits that reduce maintenance labor during inspections.
- Line-fit demand adds value because single-aisle production creates repeat panel and hardware needs.
- Aftermarket work creates margin because airline checks often need fast spares and certified repair data.
- Cabin suppliers that combine panels and latches can price against time saved during scheduled maintenance.
Key Takeaways, Market Size, and Forecast
- The quick-access maintenance-friendly interior panel systems market was valued at USD 611.9 million in 2025.
- By 2036, the market is expected to reach USD 1,328.3 million as retrofit kits move into airline maintenance planning.
- From 2026 to 2036, the market is projected to expand at 7.3% CAGR across commercial aviation programs.
- The market is projected to create an incremental opportunity of USD 671.7 million between 2026 and 2036.
- Sidewall panels are projected to account for 38.0% share of panel position demand in 2026 because sidewalls face frequent cabin access needs.
- Honeycomb composite panels are expected to hold 51.0% share of material system demand in 2026 because weight and fire performance guide selection.
- India at 9.1% CAGR and China at 8.3% CAGR are forecast to record faster expansion as fleet additions raise cabin work.
Quick-Access Maintenance-Friendly Interior Panel Systems Market Definition
The quick-access maintenance-friendly interior panel systems market covers aircraft cabin and cargo interior panels designed for faster removal, inspection and reinstallation. Scope includes sidewall panels, ceiling panels, passenger service unit panels and cargo panels with access hardware. Revenue covers panel assemblies, retrofit kits, spare panels and line-fit modules. The market links with aerospace interior programs and quick-release aircraft interior fasteners where certified access hardware is part of the panel system. The broader aircraft cabin interior supply base is referenced only when panels support faster service access.
Quick-Access Maintenance-Friendly Interior Panel Systems Market Inclusions
Market scope includes certified cabin panels, cargo linings and aircraft interior access assemblies that are sold as panel systems. Included products cover sidewall sections, ceiling sections and passenger service unit surrounds. The scope includes hardware integrated into panels, retrofit kits and replacement spares used by airlines, original equipment manufacturers and maintenance shops. Adjacent items such as aircraft interior lighting and aircraft seats are included only when the panel assembly is sold with access-ready integration. Adjacent aircraft seating work is counted only when seat-side panel access is part of the supplied package.
Quick-Access Maintenance-Friendly Interior Panel Systems Market Exclusions
The market excludes decorative films, standard seat covers, galley inserts, loose fasteners and structural airframe panels sold without cabin access function. Soft goods such as aircraft curtains are excluded unless sold within a panel access assembly.
Quick-Access Maintenance-Friendly Interior Panel Systems Market Research Methodology
- Primary Research: FMI analysts reviewed airline maintenance needs, cabin supplier portfolios and distributor practices for aircraft interior spares. The review focused on how operators select panels during heavy checks and retrofit programs.
- Desk Research: The study used aviation authority data, aircraft delivery records and official company releases. The analysis covered cabin safety, fleet expansion and supplier activity in certified interiors.
- Market Sizing and Forecasting: The model combined aircraft fleet counts, delivery programs and replacement panel use rates. Average panel pricing was adjusted by aircraft class and sales route.
- Data Validation: Forecasts were checked against aircraft delivery backlogs, airline fleet expansion and company developments. Segment shares were cross-checked with cabin layout frequency and maintenance access needs.
Why is the Quick-Access Maintenance-Friendly Interior Panel Systems Market Growing?
- Maintenance teams need faster panel access as more wiring and duct checks sit behind cabin surfaces.
- Airlines use retrofit windows to replace worn panels and add cleaner access points during heavy checks.
- OEM cabin programs need repeatable access hardware so panels can be removed without cosmetic damage.
- Lightweight panels support cabin weight control as operators add more passenger comfort features.
Fleet size is a primary driver which is projected to propel industry growth during the forecast period. The International Air Transport Association Annual Review 2025 said its global aviation data system covered over 8 million flights and 500,000 incidents in 2024. Operating scale points to large volumes of line maintenance events and cabin checks. Quick-access panels let technicians reach hidden service areas with fewer trim removals. The practical effect is lower labor time during planned maintenance and fewer delays from damaged interior parts.
Safety and reliability checks are also pushing the demand for quick-access maintenance-friendly interior panel systems. The European Union Aviation Safety Agency reported over 7.7 million European flights operated by 623 air operator certificate holders in 2024. That operating scale keeps pressure on airlines to maintain interiors without stretching aircraft ground time. Access-ready panels support inspections around wiring, lighting and passenger service units. Suppliers with proven fit and fire performance gain an advantage when airlines want fewer repeat shop visits.
Market Segmentation Analysis
- Sidewall panels are projected to account for 38.0% share in 2026 as walls carry frequent service access points.
- Quarter-turn hardware is expected to hold 47.0% share in 2026 as mechanics value fast opening cycles.
- Narrowbody aircraft are forecast to account for 54.0% share in 2026 due to high single-aisle production.
- Retrofit kits are estimated to capture 45.0% share in 2026 as airlines link panel work with cabin upgrades.
- Honeycomb composite panels are projected to represent 51.0% share in 2026 with light weight and fire rating needs.
The market is divided into five primary segment groups based on panel position, access hardware, aircraft class, sales route and material system. Panel position explains where the product is placed inside the cabin or cargo area. Access hardware shows how the panel opens during service work. Aircraft class and sales route explain whether demand comes from new aircraft, retrofit programs or replacement spares.
Insights into the Sidewall Panels Segment
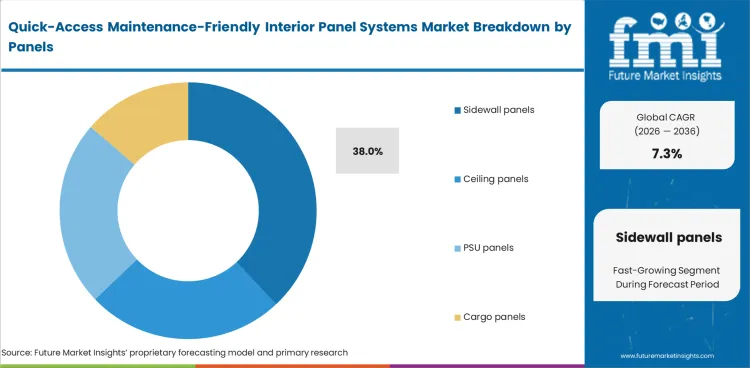
- Sidewall panels are projected to account for 38.0% share of panel position demand in 2026 as walls carry frequent inspection and repair access.
- Airlines prefer sidewall sections with stronger edge protection because repeated removal can damage trims around windows and service runs.
Insights into the Quarter-turn Access Hardware Segment
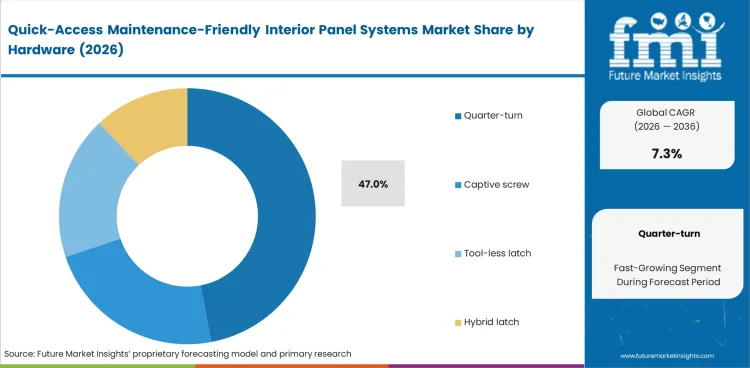
- Quarter-turn hardware is expected to represent 47.0% share in 2026 as mechanics need quick repeat opening.
- Captive screw designs remain useful where vibration control is more important than speed during daily cabin checks.
Insights into the Narrowbody Aircraft Class Segment
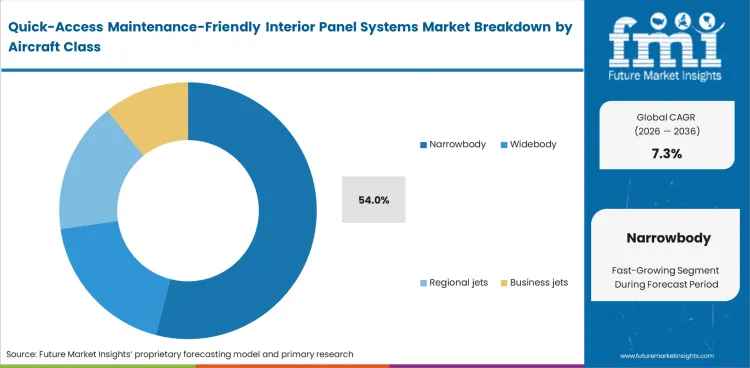
- Narrowbody aircraft are forecast to account for 54.0% share of aircraft class demand in 2026 with high A320 and 737 family activity.
- Panel suppliers serve narrowbody programs with repeatable kits because cabin layouts are copied across many aircraft in one fleet.
Insights into the Retrofit Kits Sales Route Segment
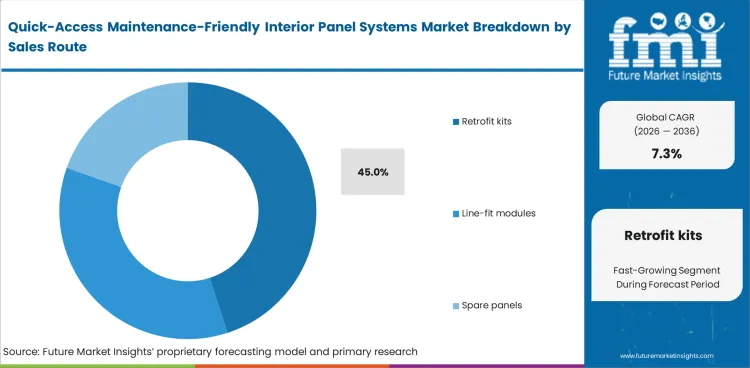
- Retrofit kits are projected to hold 45.0% share of sales route demand in 2026 as airlines combine panel access with cabin refresh work.
- Aftermarket distributors gain value when kit paperwork and spares support help maintenance shops complete work during fixed check windows.
Insights into the Honeycomb Composite Material System Segment
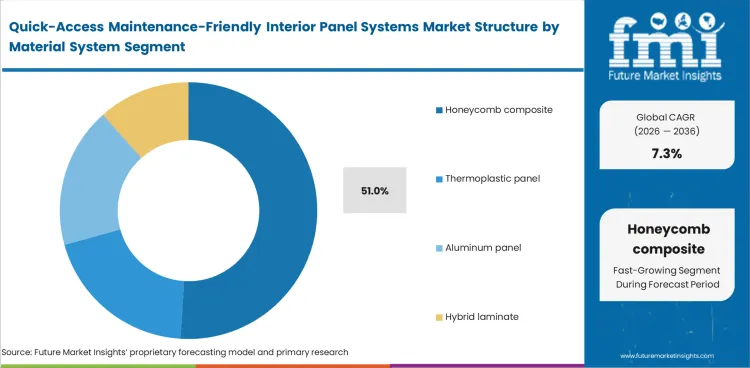
- Honeycomb composite panels are anticipated to account for 51.0% share of material system demand in 2026 due to low weight and stiffness.
- Suppliers use aerospace composite materials and advanced composites knowledge to balance weight with fire performance.
Quick-Access Maintenance-Friendly Interior Panel Systems Market Drivers, Restraints, and Opportunities
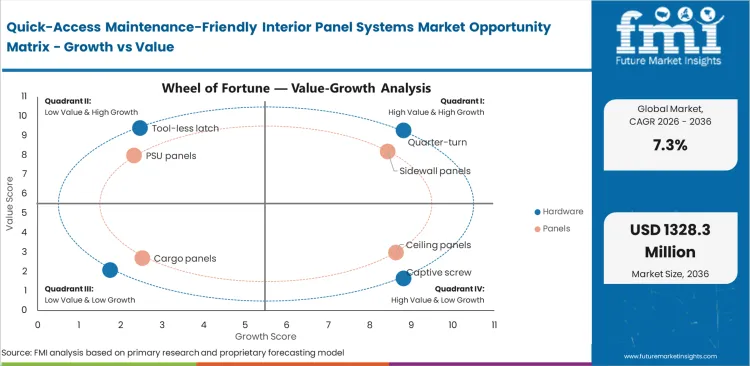
- Cabin access labor is raising demand for panels that open quickly during planned checks.
- Certification cost slows supplier entry because aircraft interiors need fire and smoke performance proof.
- Retrofit kit packaging creates opportunity as airlines buy matched panels, latches and documents together.
Maintenance access is one of the prominent driver because airlines need faster work during short aircraft ground windows. The United States commercial fleet is forecast by the Federal Aviation Administration to reach 10,607 aircraft by 2045 from 7,387 in 2024. Fleet expansion raises the long-run pool for cabin inspection and panel spares. Quick-access designs reduce repeated trim damage and speed the route to hidden systems. The larger fleet pool supports demand for certified panel kits rather than simple cosmetic replacements.
Certification Cost Limits Smaller Suppliers
A restraint is the cost of proving interior safety for every material and finish change. 14 Code of Federal Regulations § 25.853 covers compartment interior material requirements for transport aircraft. Certification needs make proof packages a core buying factor for airlines and maintenance shops. Smaller suppliers can win niche work, but they often lose larger contracts when they cannot supply test data and approved repair instructions. The market therefore favors suppliers with proven material systems and program references.
Retrofit Kits Create Aftermarket Value
The strongest opportunity comes from packaged retrofit kits that combine panels and access hardware. Aircraft cabin work overlaps more often with aircraft refurbishing and aerospace lightweight materials selection. Airlines want parts that fit existing interiors and reduce repeat engineering work. Suppliers that include drawings and repair notes can protect margins. Retrofit packaging changes the product from a panel sale into a service-ready cabin package.
Analysis of Quick-Access Maintenance-Friendly Interior Panel Systems Market by Key Countries
.webp "Top Country Growth Comparison Quick Access Maintenance Friendly Interior Panel Systems Market Cagr (2026 2036)")
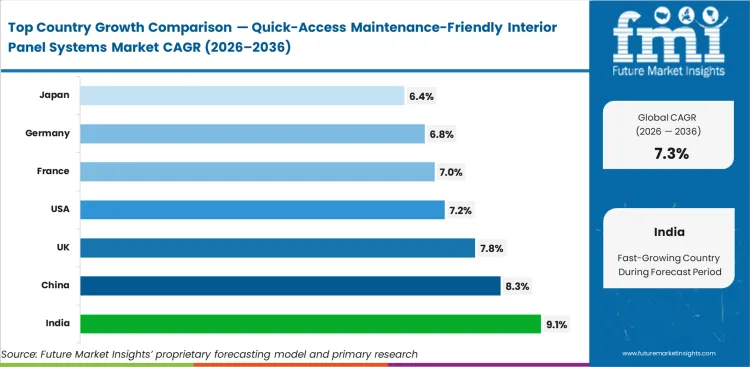
| Country | CAGR |
|---|---|
| United States | 7.2% |
| China | 8.3% |
| India | 9.1% |
| Germany | 6.8% |
| France | 7.0% |
| Japan | 6.4% |
| United Kingdom | 7.8% |
Source: Future Market Insights, 2026.
Regional Market Analysis
- India is forecast at 9.1% CAGR by 2036 as large aircraft orders widen the future cabin panel pool.
- China is projected at 8.3% CAGR by 2036 as passenger traffic and local aircraft programs support cabin work.
- The United Kingdom is expected to post 7.8% CAGR by 2036 as record passenger traffic lifts refurbishment pressure.
- The United States at 7.2% CAGR remains a major value market due to fleet size and airline maintenance depth.
- Germany and Japan hold lower but steady CAGRs because mature fleets rely on certified replacement and retrofit demand.
Demand for quick-access maintenance-friendly interior panel systems is forecast to rise at 7.3% CAGR from 2026 to 2036. Country analysis covers major aircraft manufacturing, airline fleet and cabin maintenance markets. The strongest countries combine delivery exposure with airline retrofit activity. Mature markets keep value because older aircraft need more cabin access and spare panel support.
Demand Outlook for Quick-Access Maintenance-Friendly Interior Panel Systems in the United States
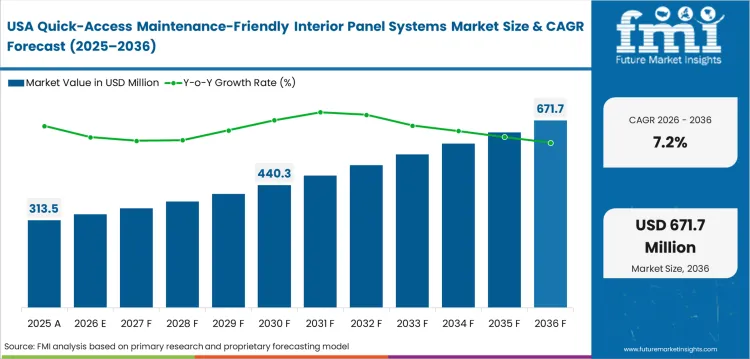
Large fleet replacement keeps interior access work steady in the United States, with 7.2% CAGR projected through 2036. The Federal Aviation Administration forecast shows the United States commercial aircraft fleet increasing from 7,387 aircraft in 2024 to 10,607 in 2045. Fleet growth gives cabin suppliers a larger pool for access panels and spare assemblies. Airlines in Texas, Georgia and Washington need repeatable panels for narrowbody checks and cabin refresh work. The practical result is steady demand for certified kits that fit existing aircraft layouts.
- Texas maintenance shops need sidewall and ceiling kits that reduce trim damage during heavy checks.
- Georgia airline hubs create steady need for spare panels tied to narrowbody aircraft utilization.
- Washington and Kansas suppliers can support Boeing-linked cabin work with certified panel and fastener data.
Sales Analysis of Quick-Access Maintenance-Friendly Interior Panel Systems in China
China is expected to expand at 8.3% CAGR through 2036 as passenger traffic and aircraft deliveries support cabin line-fit work. The Civil Aviation Administration of China reported airport passenger traffic of 1.460 billion in 2024, up 15.9% year on year. Passenger traffic scale raises cabin wear and supports replacement panel planning. Aircraft programs and airline expansion in Shanghai, Tianjin and Chengdu provide routes for access-ready interior modules. Suppliers that meet local certification and volume needs can win line-fit and retrofit orders.
- Shanghai airline groups need quick panel access around high-use passenger cabins.
- Tianjin assembly activity supports local checks for interior panel fit and rework.
- Chengdu maintenance clusters can use modular cargo panels for faster service access.
Demand Outlook for Quick-Access Maintenance-Friendly Interior Panel Systems in India
India is forecast to grow at 9.1% CAGR through 2036 as aircraft orders increase the need for locally supported cabin panels. India is anticipated to observe significant demand because its fleet pipeline is large. The Press Information Bureau of India stated in May 2026 that the commercial aircraft fleet is expected to reach 1,100 aircraft by 2027 and over 2,250 by 2035. The fleet pipeline expands the future need for cabin spares and panel replacement. Gujarat, Delhi NCR and Hyderabad are likely to be key locations for kit supply and maintenance support.
- Delhi NCR airline bases need faster panel removal around passenger service units during scheduled checks.
- Hyderabad aerospace suppliers can support cabin spares as local aviation services expand.
- Gujarat leasing and finance activity can raise demand for cabin return-condition work on aircraft assets.
Opportunity Analysis of Quick-Access Maintenance-Friendly Interior Panel Systems in Germany
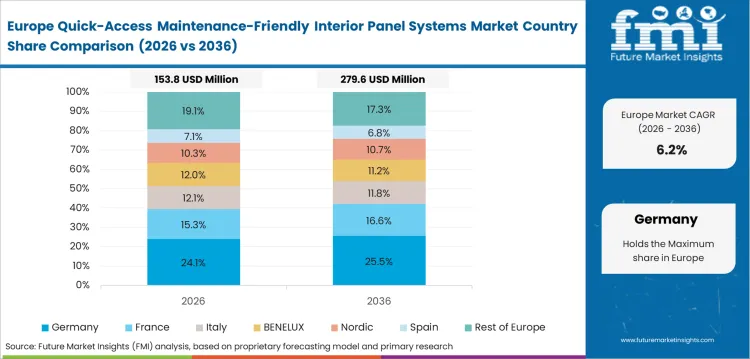
Germany is expected to advance at 6.8% CAGR through 2036 as interiors engineering and airline modification work support qualified panel suppliers. Germany is important market as cabin engineering and interior certification work are concentrated around Hamburg and Bavaria. The Federal Statistical Office of Germany reported aviation tax payable for roughly 84.0 million air passengers in 2025. The traffic base keeps cabin wear and refurbishment relevant for airlines serving German airports. Panel suppliers linked to Hamburg interiors work can convert design changes into certified kits for European fleets.
- Hamburg interiors teams can test access panels for ceiling and sidewall retrofit work.
- Bavaria aerospace suppliers support tooling and composite panel qualification for aircraft programs.
- Frankfurt airline operations create demand for replacement panels that reduce downtime during checks.
Future Outlook for Quick-Access Maintenance-Friendly Interior Panel Systems in France
Airbus and Safran cabin programs place France at 7.0% CAGR through 2036. France supports the market through aircraft production and cabin system supply. Airbus delivered 793 commercial aircraft in 2025 and reported a year-end backlog of 8,754 aircraft. The Airbus backlog supports future cabin line-fit demand and later maintenance work across global fleets. Companies such as Toulouse and Normandy give suppliers access to aircraft programs and composites capability. The country remains a steady source of qualified panel demand.
- Toulouse aircraft programs need panel suppliers that can support line-fit schedules and cabin changes.
- Paris-area cabin engineering work creates demand for certified access hardware and documentation.
- Normandy composites suppliers can support lightweight panels for cabin and cargo applications.
Future Outlook for Quick-Access Maintenance-Friendly Interior Panel Systems in Japan
Japan is forecast at 6.4% CAGR through 2036 as Jamco and dense airline operations support replacement panels. Japan has a mature airline fleet and a specialized cabin interiors supplier base. Japan Transport Safety Board reporting in 2025 keeps safety and inspection discipline visible across aviation operations. Safety reporting supports careful qualification for panel replacement and cabin access work. Demand expands moderately, with steady replacement work supporting the forecast.
- Tokyo airline maintenance teams need certified interior spares for high-frequency domestic operations.
- Niigata cabin manufacturing links support parts for galleys and access panels.
- Osaka maintenance and overhaul work can use spare panel packages tied to fleet interior refresh cycles.
Sales Analysis of Quick-Access Maintenance-Friendly Interior Panel Systems in the United Kingdom
Record passenger traffic places the United Kingdom at 7.8% CAGR through 2036 as cabin wear and retrofit activity increases. The United Kingdom Civil Aviation Authority reported 302 million airport passengers in 2025, up from 295 million in 2024. Higher aircraft use raises the need for clean cabin maintenance and replacement panels. London, Manchester and Bristol support airline operations and cabin modification activity. Suppliers that work through approved maintenance channels can gain retrofit and spare panel demand.
- London airport operations create steady need for panel spares tied to high aircraft use.
- Manchester maintenance activity supports cabin refresh kits for narrowbody and leisure fleets.
- Bristol aerospace engineering can support panel design reviews and material qualification work.
Competitive Landscape and Strategic Positioning
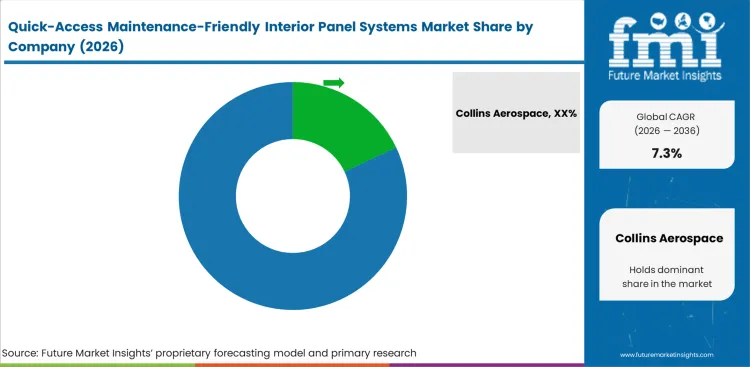
- The market is moderately concentrated because certified cabin panel work favors suppliers with approved data and program references.
- Global cabin groups hold an advantage through OEM links and broad interior portfolios.
- Specialist material suppliers compete in panel cores and fire-rated surface systems.
- Entry barriers include flammability proof and spare part support across multiple aircraft types.
Competition in the sector is focused on the ability to deliver certified panels with matching hardware and paperwork. Collins Aerospace and Safran Cabin have broad access to airline and original equipment manufacturer programs. Safran won a Crystal Cabin Award in April 2025 for Connected Interiors. The award shows how cabin suppliers are using data to improve maintenance decisions. The award signal applies for quick-access panels because the product value is tied to inspection speed and repair readiness.
Cabin module suppliers secure consistent work if they can turn panel design into production-ready kits. Diehl Aviation was selected by Eve Air Mobility in July 2024 to develop the entire electric vertical takeoff and landing interior including side panels, ceiling panels and floor panels. Material and tooling capability is a second competitive filter. Honeycomb cores, edge close-outs and latch areas must hold shape after repeated opening cycles. Suppliers with composite airframes knowledge and composite tooling discipline can support tighter tolerances. Fit tolerance is most relevant where panels are near service runs or passenger service units. A poor fit can turn a maintenance-saving product into a repeat rework problem.
Aftermarket support separates established suppliers from small custom shops. Jamco announced in April 2026 that Proponent became its exclusive aftermarket spare parts distributor. The partnership improves global part availability for airlines and maintenance partners. Distributor support can strengthen quick-access panel programs because airlines need replacement parts during fixed check windows. Adjacent cabins such as electric vertical takeoff and landing rapid-clean cabin surface systems add future test cases for fast service interiors.
Key Companies in the Quick-Access Maintenance-Friendly Interior Panel Systems Market
Competition is clearer by role because panel systems combine cabin integration, composite production and aftermarket support.
- Cabin Systems Integrators: Collins Aerospace and Safran Cabin lead with broad cabin portfolios, airline relationships and original equipment manufacturer access. Collins connects seating and monuments with cabin architecture.
- Panel and Composite Specialists: Diehl Aviation, FACC and The Gill Corporation compete through certified interior modules and panel material depth.
- Aftermarket and Kit Support: Jamco Corporation and AVIC Cabin Systems serve interior equipment and regional cabin supply needs. Jamco gains aftermarket reach through its Proponent spare parts partnership.
Competitive Benchmarking: Quick-Access Maintenance-Friendly Interior Panel Systems Market
| Company | Certified Panel Portfolio Depth | Quick-Access Hardware Integration | Aftermarket Kit Support | Geographic Footprint |
|---|---|---|---|---|
| Collins Aerospace | High | Strong | Strong | Global with North America and Europe depth |
| Safran Cabin | High | Strong | Strong | Global with France and United States depth |
| Diehl Aviation | High | Strong | Medium | Europe centered with global aircraft programs |
| FACC | Medium | Medium | Medium | Europe centered with business jet and OEM work |
| Jamco Corporation | Medium | Medium | Strong | Japan and North America with aftermarket expansion |
| AVIC Cabin Systems | Medium | Medium | Medium | China and Europe with global cabin links |
| The Gill Corporation | High | Low | Medium | North America centered with global material supply |
| SEKISUI KYDEX | Medium | Low | Medium | North America and Europe material supply |
Source: Future Market Insights competitive analysis, 2026. Ratings reflect relative positioning based on certified panel portfolio depth, quick-access hardware integration and aftermarket kit support.
Key Developments in Quick-Access Maintenance-Friendly Interior Panel Systems Market
- In April 2026, Collins Aerospace secured three launch customers for Helix seating across nearly 200 A320 and 737 aircraft. The award supports narrowbody cabin upgrade activity.
- In April 2026, Diehl Aviation reported progress at its Craiova production facility in Romania after breaking ground in July 2025. The site adds cabin component capacity.
- In February 2026, FACC was selected by Embraer to develop and manufacture new interior components for Praetor 600E and 500E aircraft.
Key Players in the Quick-Access Maintenance-Friendly Interior Panel Systems Market
Cabin Systems Integrators:
- Collins Aerospace
- Safran Cabin
- Diehl Aviation
- FACC
Panel and Material Specialists:
- The Gill Corporation
- SEKISUI KYDEX
- AVIC Cabin Systems
Aftermarket and Interior Equipment Participants:
- Jamco Corporation
- Proponent
Report Scope and Coverage
| Parameter | Details |
|---|---|
| Quantitative Units | USD 656.6 million to USD 1,328.3 million, at a CAGR of 7.3% |
| Market Definition | Aircraft cabin and cargo interior panels designed for faster removal, inspection and reinstallation |
| Panel Position | Sidewall panels, Ceiling panels, PSU panels, Cargo panels |
| Access Hardware | Quarter-turn, Captive screw, Tool-less latch, Hybrid latch |
| Aircraft Class | Narrowbody, Widebody, Regional jets, Business jets |
| Sales Route | Retrofit kits, Line-fit modules, Spare panels |
| Material System | Honeycomb composite, Thermoplastic panel, Aluminum panel, Hybrid laminate |
| Regions Covered | North America, Latin America, Europe, East Asia, South Asia and Pacific, Middle East and Africa |
| Countries Covered | United States, China, India, Germany, France, Japan, United Kingdom, and 30+ countries |
| Key Companies Profiled | Collins Aerospace, Safran Cabin, Diehl Aviation, FACC, Jamco Corporation, AVIC Cabin Systems, The Gill Corporation |
| Forecast Period | 2026 to 2036 |
| Approach | Hybrid bottom-up and top-down methodology using aircraft fleet, delivery, retrofit and supplier activity signals |
Source: Future Market Insights, 2026.
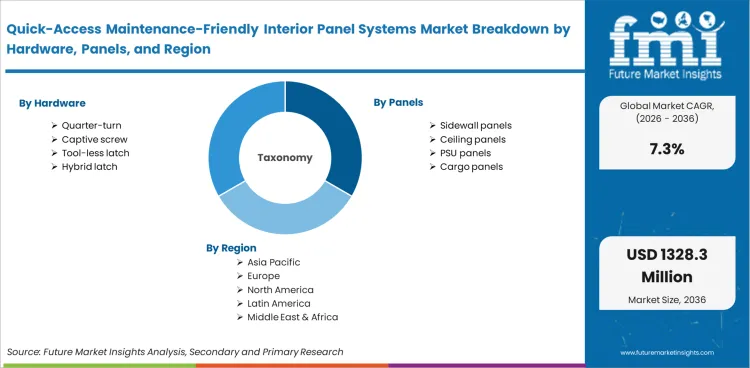
Quick-Access Maintenance-Friendly Interior Panel Systems Market Breakdown by Panel Position, Access Hardware, Aircraft Class, Sales Route, Material System, and Region
Quick-Access Maintenance-Friendly Interior Panel Systems Market Segmented by Panel Position:
- Sidewall panels
- Ceiling panels
- PSU panels
- Cargo panels
Quick-Access Maintenance-Friendly Interior Panel Systems Market Segmented by Access Hardware:
- Quarter-turn
- Captive screw
- Tool-less latch
- Hybrid latch
Quick-Access Maintenance-Friendly Interior Panel Systems Market Segmented by Aircraft Class:
- Narrowbody
- Widebody
- Regional jets
- Business jets
Quick-Access Maintenance-Friendly Interior Panel Systems Market Segmented by Sales Route:
- Retrofit kits
- Line-fit modules
- Spare panels
Quick-Access Maintenance-Friendly Interior Panel Systems Market Segmented by Material System:
- Honeycomb composite
- Thermoplastic panel
- Aluminum panel
- Hybrid laminate
Quick-Access Maintenance-Friendly Interior Panel Systems Market by Region:
- North America
- United States
- Canada
- Mexico
- Latin America
- Brazil
- Chile
- Rest of Latin America
- Western Europe
- Germany
- United Kingdom
- Italy
- Spain
- France
- Nordic
- BENELUX
- Rest of Western Europe
- Eastern Europe
- Russia
- Poland
- Hungary
- Balkan and Baltic
- Rest of Eastern Europe
- East Asia
- China
- Japan
- South Korea
- South Asia and Pacific
- India
- ASEAN
- Australia and New Zealand
- Rest of South Asia and Pacific
- Middle East and Africa
- Kingdom of Saudi Arabia
- Other GCC Countries
- Turkiye
- South Africa
- Other African Union
- Rest of Middle East and Africa
Research Sources and Bibliography
- Airbus. (2026, January 12). Airbus reports 793 commercial aircraft deliveries in 2025. Airbus.
- The Boeing Company. (2026, January 27). Boeing reports fourth quarter results. Boeing Newsroom.
- Federal Aviation Administration. (2025, June). FAA aerospace forecast fiscal years 2025 to 2045. United States Department of Transportation.
- International Air Transport Association. (2025, June). IATA annual review 2025. IATA.
- European Union Aviation Safety Agency. (2025, August 26). EASA publishes annual safety review 2025. EASA.
- Civil Aviation Administration of China. (2025, December). China civil aviation annual report 2024. CAAC.
- Press Information Bureau. (2026, May 9). India aircraft leasing and financing summit 2.0. Government of India.
- Federal Statistical Office of Germany. (2026, April 1). 2.1 billion euros of aviation tax declared in 2025. Destatis.
- United Kingdom Civil Aviation Authority. (2026, February 24). UK aviation officially breaks records with over 300m passenger journeys in 2025. CAA.
- Japan Transport Safety Board. (2025, March). Japan Transport Safety Board annual report 2025. Ministry of Land, Infrastructure, Transport and Tourism.
- Safran. (2025, April 10). Safran wins 16th Crystal Cabin Award with Connected Interiors. Safran Group.
- Diehl Aviation. (2024, July 22). Diehl Aviation selected by Eve Air Mobility to design and produce electric vertical takeoff and landing interiors. Diehl.
- Diehl Aviation. (2025, April 10). Diehl Aviation’s eDecor redefines aircraft cabin customization. Diehl.
- Diehl Aviation. (2026, April 9). Diehl Aviation reports progress at new production facility in Craiova, Romania. Diehl.
- FACC. (2026, February 27). FACC develops and manufactures new cabin components for Embraer Praetor 600E and Praetor 500E. FACC.
- RTX. (2026, April 15). RTX’s Collins Aerospace secures three airline launch customers for its Helix main cabin seat. RTX.
- Jamco Corporation. (2025, December 2). Jamco announces acquisition of Iacobucci HF Aerospace. Jamco.
- Jamco Corporation. (2026, April 14). Jamco appoints Proponent as exclusive aftermarket spare parts distributor. Jamco.
- Electronic Code of Federal Regulations. (2026). 14 CFR § 25.853: Compartment interiors. United States Government Publishing Office.
- The Gill Corporation. (2025, May 6). The Gill Corporation releases new airplane product call-out video. The Gill Corporation.
The bibliography is provided for reader reference and uses primary government, regulatory, company and official trade sources relevant to aircraft cabin interiors.
This Report Answers
- What is the current and future size of the quick-access maintenance-friendly interior panel systems market?
- How fast is the quick-access maintenance-friendly interior panel systems market expected to expand between 2026 and 2036?
- Which panel position is expected to lead quick-access maintenance-friendly interior panel systems demand by 2026?
- Which access hardware type is projected to account for the leading quick-access interior panel share in 2026?
- Why do airlines need quick-access maintenance-friendly interior panel systems for cabin checks?
- How do certification and fire performance needs affect supplier selection in this market?
- Which countries are projected to record faster expansion during the forecast period?
- Who are the main companies active in quick-access maintenance-friendly interior panel systems?
- How does FMI define the quick-access maintenance-friendly interior panel systems scope?
- How does FMI estimate and validate the quick-access maintenance-friendly interior panel systems forecast?
Frequently Asked Questions
What is the global market demand for Quick-Access Maintenance-Friendly Interior Panel Systems in 2026?
In 2026, the global market is expected to be worth USD 656.6 million as retrofit kits enter planned cabin work.
How big will the Quick-Access Maintenance-Friendly Interior Panel Systems Market be in 2036?
By 2036, the market is expected to reach USD 1,328.3 million as access-ready panels gain wider airline use.
How much will demand for Quick-Access Maintenance-Friendly Interior Panel Systems expand from 2026 to 2036?
Demand is projected to expand at 7.3% CAGR from 2026 to 2036 as cabin access work becomes more planned.
Which panel position is expected to lead the Quick-Access Maintenance-Friendly Interior Panel Systems Market by 2026?
Sidewall panels are projected to lead panel position demand with 38.0% share in 2026 as walls need frequent service access.
Which access hardware type is expected to lead Quick-Access Maintenance-Friendly Interior Panel Systems demand in 2026?
Quarter-turn hardware is expected to lead access hardware demand with 47.0% share in 2026 as mechanics need faster opening cycles.
Which country is forecast to grow fastest in the Quick-Access Maintenance-Friendly Interior Panel Systems Market?
India is forecast at 9.1% CAGR through 2036 as airline fleet expansion raises future cabin panel and spares needs.
What does the Quick-Access Maintenance-Friendly Interior Panel Systems Market include?
The market includes cabin and cargo panels designed for faster removal, inspection and reinstallation during aircraft maintenance checks.
How does FMI estimate the Quick-Access Maintenance-Friendly Interior Panel Systems Market forecast?
FMI uses aircraft fleet data, delivery signals, panel pricing and retrofit demand checks to estimate the market forecast.
How do airlines choose quick-access interior panel systems?
Airlines usually check certification, fit accuracy and spare part availability first because poor panel fit can extend aircraft downtime.
Why are quick-access interior panels useful during aircraft maintenance?
Quick-access panels reduce repeated trim removal and help technicians reach wiring, ducts and service areas during planned checks.
Preview the report firsthand - request a free sample
Get SampleGet the brochure for pricing and purchase details.
Get PDFTable of Content
- Key Takeaways
- Market Size and CAGR
- Top Growth Driver
- Fastest Growing Segment
- Leading Region
- Key Companies
- Emerging Opportunities
- Executive Summary
- Global Market Outlook
- Demand-side Trends
- Supply-side Trends
- Technology Roadmap Analysis
- Analysis and Recommendations
- Analyst Perspective (What is happening? Why now? What should investors know?)
- Key Questions Answered
- How large is the market?
- What is the CAGR?
- What are key trends?
- Which region dominates?
- Who are the leaders?
- Market Overview
- Market Coverage / Taxonomy
- Market Definition / Scope / Limitations
- Research Methodology
- Chapter Orientation
- Analytical Lens and Working Hypotheses
- Market Structure, Signals, and Trend Drivers
- Benchmarking and Cross-market Comparability
- Market Sizing, Forecasting, and Opportunity Mapping
- Research Design and Evidence Framework
- Desk Research Programme (Secondary Evidence)
- Expert Input and Fieldwork (Primary Evidence)
- Tooling, Models, and Reference Databases
- Data Engineering and Model Build
- Quality Assurance and Audit Trail
- Market Background
- Market Dynamics (Drivers, Restraints, Opportunity, Trends)
- Scenario Forecast (Optimistic, Likely, Conservative)
- Impact Analysis
- AI Impact
- Sustainability Impact
- Regulatory Impact
- Technology Impact
- Consumer / Buyer Analysis
- Purchase Drivers
- Adoption Barriers
- Buyer Journey
- Opportunity Map Analysis
- Product Life Cycle Analysis
- Supply Chain Analysis
- Investment Feasibility Matrix
- Value Chain Analysis
- PESTLE and Porter's Analysis
- Regulatory Landscape
- Regional Parent Market Outlook
- Production and Consumption Statistics
- Import and Export Statistics
- Global Market Analysis and Forecast, 2021 to 2036
- Historical Market Size Value (USD Million) & Volume (Unit) Analysis, 2021 to 2025
- Current and Future Market Size Value (USD Million) & Volume (Unit) Projections, 2026 to 2036
- Y-o-Y Growth Trend Analysis
- Absolute $ Opportunity Analysis
- Global Market Pricing Analysis, 2021 to 2036
- Global Market Analysis and Forecast, By Panel Position, 2021 to 2036
- Introduction / Key Findings
- Historical Market Size Value (USD Million) & Volume (Unit) Analysis By Panel Position, 2021 to 2025
- Current and Future Market Size Value (USD Million) & Volume (Unit) Analysis and Forecast By Panel Position, 2026 to 2036
- Sidewall panels
- Ceiling panels
- PSU panels
- Cargo panels
- Sidewall panels
- Y-o-Y Growth Trend Analysis By Panel Position, 2021 to 2025
- Absolute $ Opportunity Analysis By Panel Position, 2026 to 2036
- Global Market Analysis and Forecast, By Access Hardware, 2021 to 2036
- Introduction / Key Findings
- Historical Market Size Value (USD Million) & Volume (Unit) Analysis By Access Hardware, 2021 to 2025
- Current and Future Market Size Value (USD Million) & Volume (Unit) Analysis and Forecast By Access Hardware, 2026 to 2036
- Quarter-turn
- Captive screw
- Tool-less latch
- Hybrid latch
- Quarter-turn
- Y-o-Y Growth Trend Analysis By Access Hardware, 2021 to 2025
- Absolute $ Opportunity Analysis By Access Hardware, 2026 to 2036
- Global Market Analysis and Forecast, By Aircraft Class, 2021 to 2036
- Introduction / Key Findings
- Historical Market Size Value (USD Million) & Volume (Unit) Analysis By Aircraft Class, 2021 to 2025
- Current and Future Market Size Value (USD Million) & Volume (Unit) Analysis and Forecast By Aircraft Class, 2026 to 2036
- Narrowbody
- Widebody
- Regional jets
- Business jets
- Narrowbody
- Y-o-Y Growth Trend Analysis By Aircraft Class, 2021 to 2025
- Absolute $ Opportunity Analysis By Aircraft Class, 2026 to 2036
- Global Market Analysis and Forecast, By Sales Route, 2021 to 2036
- Introduction / Key Findings
- Historical Market Size Value (USD Million) & Volume (Unit) Analysis By Sales Route, 2021 to 2025
- Current and Future Market Size Value (USD Million) & Volume (Unit) Analysis and Forecast By Sales Route, 2026 to 2036
- Retrofit kits
- Line-fit modules
- Spare panels
- Retrofit kits
- Y-o-Y Growth Trend Analysis By Sales Route, 2021 to 2025
- Absolute $ Opportunity Analysis By Sales Route, 2026 to 2036
- Global Market Analysis and Forecast, By Material System, 2021 to 2036
- Introduction / Key Findings
- Historical Market Size Value (USD Million) & Volume (Unit) Analysis By Material System, 2021 to 2025
- Current and Future Market Size Value (USD Million) & Volume (Unit) Analysis and Forecast By Material System, 2026 to 2036
- Honeycomb composite
- Thermoplastic panel
- Aluminum panel
- Hybrid laminate
- Honeycomb composite
- Y-o-Y Growth Trend Analysis By Material System, 2021 to 2025
- Absolute $ Opportunity Analysis By Material System, 2026 to 2036
- Global Market Analysis and Forecast, By Region, 2021 to 2036
- Introduction
- Historical Market Size Value (USD Million) & Volume (Unit) Analysis By Region, 2021 to 2025
- Current Market Size Value (USD Million) & Volume (Unit) Analysis and Forecast By Region, 2026 to 2036
- North America
- Latin America
- Western Europe
- Eastern Europe
- East Asia
- South Asia and Pacific
- Middle East & Africa
- Market Attractiveness Analysis By Region
- North America Market Analysis and Forecast, By Country, 2021 to 2036
- Historical Market Size Value (USD Million) & Volume (Unit) Trend Analysis By Market Taxonomy, 2021 to 2025
- Market Size Value (USD Million) & Volume (Unit) Forecast By Market Taxonomy, 2026 to 2036
- By Country
- USA
- Canada
- Mexico
- By Panel Position
- By Access Hardware
- By Aircraft Class
- By Sales Route
- By Material System
- By Country
- Market Attractiveness Analysis
- By Country
- By Panel Position
- By Access Hardware
- By Aircraft Class
- By Sales Route
- By Material System
- Key Takeaways
- Latin America Market Analysis and Forecast, By Country
- Historical Market Size Value (USD Million) & Volume (Unit) Trend Analysis By Market Taxonomy, 2021 to 2025
- Market Size Value (USD Million) & Volume (Unit) Forecast By Market Taxonomy, 2026 to 2036
- By Country
- Brazil
- Chile
- Rest of Latin America
- By Panel Position
- By Access Hardware
- By Aircraft Class
- By Sales Route
- By Material System
- By Country
- Market Attractiveness Analysis
- By Country
- By Panel Position
- By Access Hardware
- By Aircraft Class
- By Sales Route
- By Material System
- Key Takeaways
- Western Europe Market Analysis and Forecast, By Country
- Historical Market Size Value (USD Million) & Volume (Unit) Trend Analysis By Market Taxonomy, 2021 to 2025
- Market Size Value (USD Million) & Volume (Unit) Forecast By Market Taxonomy, 2026 to 2036
- By Country
- Germany
- UK
- Italy
- Spain
- France
- Nordic
- BENELUX
- Rest of Western Europe
- By Panel Position
- By Access Hardware
- By Aircraft Class
- By Sales Route
- By Material System
- By Country
- Market Attractiveness Analysis
- By Country
- By Panel Position
- By Access Hardware
- By Aircraft Class
- By Sales Route
- By Material System
- Key Takeaways
- Eastern Europe Market Analysis and Forecast, By Country
- Historical Market Size Value (USD Million) & Volume (Unit) Trend Analysis By Market Taxonomy, 2021 to 2025
- Market Size Value (USD Million) & Volume (Unit) Forecast By Market Taxonomy, 2026 to 2036
- By Country
- Russia
- Poland
- Hungary
- Balkan & Baltic
- Rest of Eastern Europe
- By Panel Position
- By Access Hardware
- By Aircraft Class
- By Sales Route
- By Material System
- By Country
- Market Attractiveness Analysis
- By Country
- By Panel Position
- By Access Hardware
- By Aircraft Class
- By Sales Route
- By Material System
- Key Takeaways
- East Asia Market Analysis and Forecast, By Country
- Historical Market Size Value (USD Million) & Volume (Unit) Trend Analysis By Market Taxonomy, 2021 to 2025
- Market Size Value (USD Million) & Volume (Unit) Forecast By Market Taxonomy, 2026 to 2036
- By Country
- China
- Japan
- South Korea
- By Panel Position
- By Access Hardware
- By Aircraft Class
- By Sales Route
- By Material System
- By Country
- Market Attractiveness Analysis
- By Country
- By Panel Position
- By Access Hardware
- By Aircraft Class
- By Sales Route
- By Material System
- Key Takeaways
- South Asia and Pacific Market Analysis and Forecast, By Country
- Historical Market Size Value (USD Million) & Volume (Unit) Trend Analysis By Market Taxonomy, 2021 to 2025
- Market Size Value (USD Million) & Volume (Unit) Forecast By Market Taxonomy, 2026 to 2036
- By Country
- India
- ASEAN
- Australia & New Zealand
- Rest of South Asia and Pacific
- By Panel Position
- By Access Hardware
- By Aircraft Class
- By Sales Route
- By Material System
- By Country
- Market Attractiveness Analysis
- By Country
- By Panel Position
- By Access Hardware
- By Aircraft Class
- By Sales Route
- By Material System
- Key Takeaways
- Middle East & Africa Market Analysis and Forecast, By Country
- Historical Market Size Value (USD Million) & Volume (Unit) Trend Analysis By Market Taxonomy, 2021 to 2025
- Market Size Value (USD Million) & Volume (Unit) Forecast By Market Taxonomy, 2026 to 2036
- By Country
- Kingdom of Saudi Arabia
- Other GCC Countries
- Türkiye
- South Africa
- Other African Union
- Rest of Middle East & Africa
- By Panel Position
- By Access Hardware
- By Aircraft Class
- By Sales Route
- By Material System
- By Country
- Market Attractiveness Analysis
- By Country
- By Panel Position
- By Access Hardware
- By Aircraft Class
- By Sales Route
- By Material System
- Key Takeaways
- Key Countries Market Analysis
- USA
- Pricing Analysis
- Market Share Analysis, 2025
- By Panel Position
- By Access Hardware
- By Aircraft Class
- By Sales Route
- By Material System
- Canada
- Pricing Analysis
- Market Share Analysis, 2025
- By Panel Position
- By Access Hardware
- By Aircraft Class
- By Sales Route
- By Material System
- Mexico
- Pricing Analysis
- Market Share Analysis, 2025
- By Panel Position
- By Access Hardware
- By Aircraft Class
- By Sales Route
- By Material System
- Brazil
- Pricing Analysis
- Market Share Analysis, 2025
- By Panel Position
- By Access Hardware
- By Aircraft Class
- By Sales Route
- By Material System
- Chile
- Pricing Analysis
- Market Share Analysis, 2025
- By Panel Position
- By Access Hardware
- By Aircraft Class
- By Sales Route
- By Material System
- Germany
- Pricing Analysis
- Market Share Analysis, 2025
- By Panel Position
- By Access Hardware
- By Aircraft Class
- By Sales Route
- By Material System
- UK
- Pricing Analysis
- Market Share Analysis, 2025
- By Panel Position
- By Access Hardware
- By Aircraft Class
- By Sales Route
- By Material System
- Italy
- Pricing Analysis
- Market Share Analysis, 2025
- By Panel Position
- By Access Hardware
- By Aircraft Class
- By Sales Route
- By Material System
- Spain
- Pricing Analysis
- Market Share Analysis, 2025
- By Panel Position
- By Access Hardware
- By Aircraft Class
- By Sales Route
- By Material System
- France
- Pricing Analysis
- Market Share Analysis, 2025
- By Panel Position
- By Access Hardware
- By Aircraft Class
- By Sales Route
- By Material System
- India
- Pricing Analysis
- Market Share Analysis, 2025
- By Panel Position
- By Access Hardware
- By Aircraft Class
- By Sales Route
- By Material System
- ASEAN
- Pricing Analysis
- Market Share Analysis, 2025
- By Panel Position
- By Access Hardware
- By Aircraft Class
- By Sales Route
- By Material System
- Australia & New Zealand
- Pricing Analysis
- Market Share Analysis, 2025
- By Panel Position
- By Access Hardware
- By Aircraft Class
- By Sales Route
- By Material System
- China
- Pricing Analysis
- Market Share Analysis, 2025
- By Panel Position
- By Access Hardware
- By Aircraft Class
- By Sales Route
- By Material System
- Japan
- Pricing Analysis
- Market Share Analysis, 2025
- By Panel Position
- By Access Hardware
- By Aircraft Class
- By Sales Route
- By Material System
- South Korea
- Pricing Analysis
- Market Share Analysis, 2025
- By Panel Position
- By Access Hardware
- By Aircraft Class
- By Sales Route
- By Material System
- Russia
- Pricing Analysis
- Market Share Analysis, 2025
- By Panel Position
- By Access Hardware
- By Aircraft Class
- By Sales Route
- By Material System
- Poland
- Pricing Analysis
- Market Share Analysis, 2025
- By Panel Position
- By Access Hardware
- By Aircraft Class
- By Sales Route
- By Material System
- Hungary
- Pricing Analysis
- Market Share Analysis, 2025
- By Panel Position
- By Access Hardware
- By Aircraft Class
- By Sales Route
- By Material System
- Kingdom of Saudi Arabia
- Pricing Analysis
- Market Share Analysis, 2025
- By Panel Position
- By Access Hardware
- By Aircraft Class
- By Sales Route
- By Material System
- Türkiye
- Pricing Analysis
- Market Share Analysis, 2025
- By Panel Position
- By Access Hardware
- By Aircraft Class
- By Sales Route
- By Material System
- South Africa
- Pricing Analysis
- Market Share Analysis, 2025
- By Panel Position
- By Access Hardware
- By Aircraft Class
- By Sales Route
- By Material System
- USA
- Market Structure Analysis
- Competition Dashboard
- Competition Benchmarking
- Market Share Analysis of Top Players
- By Regional
- By Panel Position
- By Access Hardware
- By Aircraft Class
- By Sales Route
- By Material System
- Emerging Startups
- Innovation Benchmarking
- Competition Analysis
- Competition Deep Dive
- Collins Aerospace
- Overview
- Product Portfolio
- Profitability by Market Segments (Product/Region/Sales Channel)
- Sales Footprint
- Strategy Overview
- Marketing Strategy
- Product Strategy
- Channel Strategy
- Safran Cabin
- Diehl Aviation
- FACC
- The Gill Corporation
- SEKISUI KYDEX
- AVIC Cabin Systems
- Jamco Corporation
- Proponent
- Collins Aerospace
- Case Studies
- Success Stories
- Recent Developments
- Competition Deep Dive
- Assumptions & Acronyms Used


