

- Market Size (2026)
- USD 640.6 Mn
- Forecast (2036)
- USD 1488.9 Mn
- CAGR (2026 to 2036)
- 8.8%
How big is the Vehicle Banksman Systems Market in 2026?
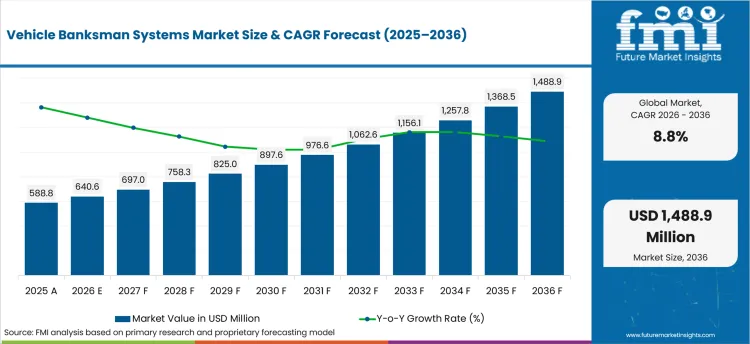
USD 640.6 million in 2026 and USD 1,488.9 million by 2036 at an 8.8% CAGR.
Sales of vehicle banksman systems are estimated to rise at an 8.8% CAGR through 2036, increasing valuation from USD 640.6 million in 2026 to USD 1,488.9 million by 2036. Construction fleets place workers near reversing plant where blind zones change with attachments and vehicle position. The U.S. Bureau of Labor Statistics reported in February 2026 that 369 pedestrian fatalities involved motorized land vehicles in 2024. Investment in construction worker safety is projected to keep proximity alerts and camera-backed warnings under review where physical separation does not cover changing vehicle paths.
India and China are projected to favor retrofit systems that fit mixed construction fleets and local service networks. United States and Germany fleet accounts are expected to place more weight on integrated video records and documented alarm performance during fleet review. Engineering teams compare detection range and nuisance-alarm control before approving systems across excavators or loaders. Procurement teams are expected to compare installation support with off-highway telematics where incident review is part of fleet management. Safe Work Australia reported in October 2025 that machinery operators and drivers accounted for 32% of worker fatalities in 2024. The exposure profile is projected to keep operator alert design and pedestrian warning rules central during site trials. Final approval is expected to turn on whether crews trust the alert during real reversing work.
| Metric | Value |
|---|---|
| 2025 Market Size | USD 588.8 million |
| 2026 Market Size | USD 640.6 million |
| 2036 Market Size | USD 1,488.9 million |
| Forecast CAGR (2026-2036) | 8.8% |
| Leading System Type | Vehicle-mounted Proximity Systems |
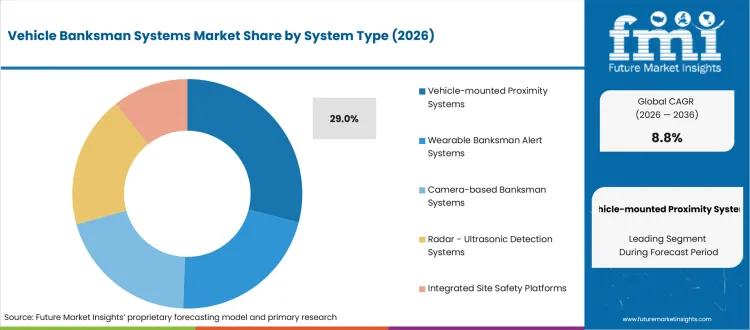
| Vehicle-mounted Proximity Systems Share (2026) | 29.0% |
| Leading Detection Technology | RFID or BLE |
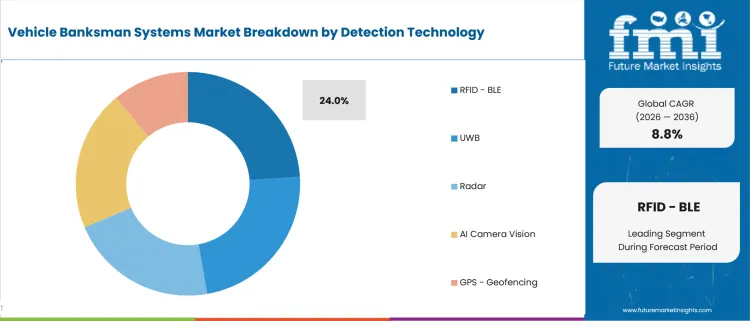
| RFID or BLE Share (2026) | 24.0% |
| Leading Vehicle Type | Excavators |
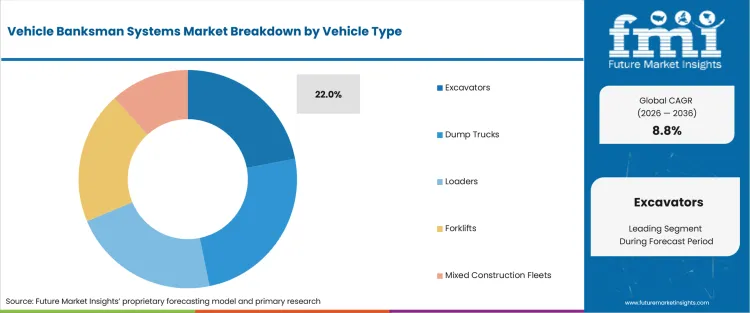
| Excavators Share (2026) | 22.0% |
| Fastest-growing Country | India |
| India CAGR by 2036 | 10.8% |
Summary of the Vehicle Banksman Systems Market
| Market Signal | Commercial Impact |
|---|---|
| Demand and Growth Drivers | Vehicle movement near pedestrians is expected to keep site safety teams focused on earlier warning inside blind zones. Procurement attention is projected to increase where operators need repeatable alerts before a banksman becomes hidden by vehicle movement or site geometry.
|
| Product and Segment View | Vehicle-mounted proximity systems are projected to remain central because warning hardware stays with the machine and is expected to support repeatable alert zones. Detection choices are anticipated to reflect whether sites rely on tagged workers or camera review during close vehicle-pedestrian interaction.
|
| Geography and Growth Outlook | India and China are projected to support retrofit demand through equipment activity and infrastructure work. Growth conditions are expected to favor suppliers that combine fleet compatibility with local installation support and practical service access.
|
| Competitive Landscape | Competition is expected to separate along detection method and the workflow used to review warnings across mixed fleets. Fleet teams are projected to compare alarm reliability and event evidence before extending systems across additional vehicles. Local support is expected to shape final supplier approval.
|
| Analyst Perspective | Mixed fleets expose a weakness when hardware works well on one vehicle brand but not another. The commercial test is expected to be consistent warning behavior across varied vehicle types and changing site layouts.
- Nikhil Kaitwade, Analyst at Future Market Insights |
Source: FMI's proprietary forecasting model and primary research
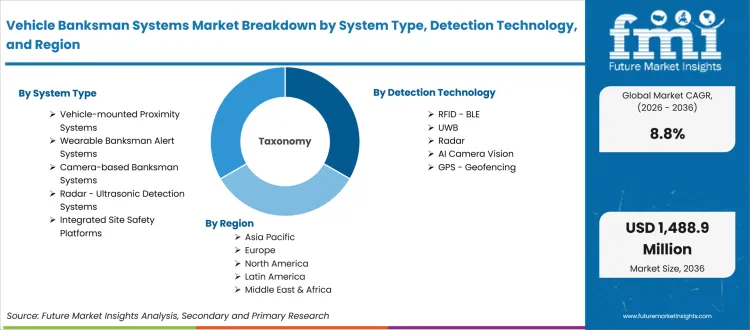
< class="report_content_title">How is the vehicle banksman systems market segmented?The vehicle banksman systems industry is segmented by system type, detection technology, vehicle type, application, sales model, and region.
Five parent categories define the vehicle banksman systems market and guide the scope used in this article. System type covers wearable banksman alert systems, vehicle-mounted proximity systems, camera-based banksman systems, radar or ultrasonic detection systems, and integrated site safety platforms. Detection technology includes RFID or BLE, UWB, radar, AI camera vision, and GPS or geofencing, while vehicle type covers excavators through mixed construction fleets. Application covers reversing safety, blind spot alerts, exclusion zone control, and site traffic management, while sales models extend from hardware sales to fleet safety service. Regional scope follows North America through Oceania and other covered regions while construction equipment telematics provides an adjacent connected-fleet reference.
What supports demand for vehicle-mounted proximity systems within the system type category?
Busy work zones change shape as excavators and dump trucks move between loading or reversing tasks. Brigade joined CLOCS-A as a Tier One partner in July 2025 and tied vehicle safety technology to construction transport risk controls. Fleet safety managers are expected to assess vehicle-mounted warning systems where a banksman cannot stay inside the operator's line of sight throughout every maneuver.
- Based on system type, vehicle-mounted proximity systems are projected to account for 29.0% in 2026 due to direct warning at the vehicle. The U.S. Bureau of Labor Statistics reported in February 2026 that transportation incidents caused 1,937 fatalities in 2024. Fleet managers are expected to keep warning coverage close to mobile plant where transport hazards dominate work exposure.
- Demand for vehicle-mounted proximity systems is expected to grow among construction contractors because hired plant changes between projects and needs quick retrofit checks. SiteZone Safety updated its dashboard in April 2026 to help users review detections against runtime and site activity. The link between field alerts and proximity sensing systems is projected to support trial evaluation before broader fleet fitting.
How do site safety teams evaluate RFID or BLE within the detection technology category?
RFID or BLE systems depend on tagged people and defined vehicle detection zones instead of a camera interpreting every scene. ZoneSafe published a November 2025 comparison of tag-based RFID and non-tag UWB approaches for the people-plant interface. Site safety teams are expected to review worker tagging discipline and blind-corner behavior before choosing this detection route for busy warehouses or large quarries.
- By detection technology, RFID or BLE is estimated to hold 24.0% in 2026 due to two-way warning and known tag workflows. DGUV reported in October 2025 that industrial trucks and material transport carts accounted for 15.6% of internal transport accidents in 2024. The exposure is expected to keep tagged pedestrian alerts relevant where vehicles share constrained travel paths.
- Site safety teams are expected to favor RFID or BLE in controlled zones due to worker identification and repeatable detection boundaries. SiteZone Safety stated in May 2026 that its technology was used on more than 220 sites. Accounts reviewing material handling equipment are projected to compare tag issue procedures with alert reliability before extending coverage across more vehicles.
What drives excavator demand within the vehicle type category?
Excavator blind zones change when the upper structure slews and attachments block the operator view. MoRTH inserted rule 125-O through G.S.R. 721(E) and required electric construction equipment vehicles to meet AIS-174 from January 2025. Fleet engineering teams are expected to treat warning-system fit as a machine integration task because cable routing and sensor position must survive digging cycles.
- In 2026, excavators are expected to lead vehicle type with 22.0% share because slew movement creates changing sight lines around the machine. CEMA reported in April 2026 that FY2025 overseas construction equipment shipments increased 0.6%, while hydraulic excavator shipments rose 10.1%. Equipment movement at that scale is projected to keep retrofit compatibility and dealer support central to safety-system review.
- Purchase activity for excavator warning systems is anticipated to rise in infrastructure work because mobile plant frequently operates near ground crews. India's Border Roads Organisation reported in December 2025 that it completed about 1,125 km of road construction during the current review period. Contractors comparing wheel excavators are expected to value warning systems designed to move from roadwork to utility excavation without changing the operator workflow.
What are the drivers, restraints, and opportunities in the vehicle banksman systems market?
Near-term purchases are projected to reflect blind-zone exposure and site approval burden. Linking warning events with fleet records is forecast to create a service and review opportunity.
- Driver: Site safety teams are expected to purchase earlier-warning systems where reversing plant and pedestrians share changing work zones.
- Restraint: Where alarm evidence or installation ownership remains unclear, fleet approval is anticipated to slow across mixed hired equipment.
- Opportunity: Integrated warning and incident review are projected to open account access for vendors that link cab alerts with fleet records.
Construction and quarry fleets are expected to place more attention on warning systems that close the gap between detection and driver response. Matrix Design Group wrote in March 2026 that integrated safety platforms influence machine behavior through functions such as automatic speed reduction in high-risk areas. Engineering teams are projected to look beyond stand-alone audible alerts where vehicle interfaces support deeper integration. Procurement review is expected to focus on mixed-fleet compatibility and clear ownership of installation and service responsibilities.
Approval burden is anticipated to remain a restraint when site rules and installation records do not identify who owns each control. HSE fined Jack Moody Landscaping and Civil Engineering in June 2026 after a reversing flat-bed truck injured an employee, and the enforcement action reinforced the financial exposure linked to weak control of reversing vehicles. Safety managers are projected to demand clear commissioning records before fitting systems across recurring fleet hires.
Fleet data is projected to create an opening where site teams need evidence after the warning event. Matrix Design Group published a June 2025 analysis of inexperienced-worker risk and paired early detection with targeted intervention in high-risk workplaces. Vendors that connect collision alerts with construction fleet software are expected to receive closer review from contractors managing separate worksites. The commercial opening is forecast to depend on whether event records help supervisors change routes and work-zone rules.
Which country CAGRs are profiled in the vehicle banksman systems market?
.webp "Top Country Growth Comparison Vehicle Banksman Systems Market Cagr (2026 2036)")
| Country | CAGR |
|---|---|
| United States | 7.7% |
| China | 10.1% |
| India | 10.8% |
| Germany | 7.2% |
| United Kingdom | 8.0% |
| Japan | 6.8% |
| Australia | 8.3% |
Source: FMI's proprietary forecasting model and primary research
How do country-level CAGRs compare in the vehicle banksman systems market?
Country growth is expected to split between retrofit demand from active infrastructure work and fleet approval based on documentation. India and China are projected to expand through active equipment use and local service channels. The United States and European countries are anticipated to place greater weight on incident records and defined installation responsibility. MoRTH reported in December 2025 that India completed 10,660 km of National Highway construction in FY2024-25. Japan and Australia are forecast to base purchases on equipment use patterns and local service coverage across dispersed work locations.
- A USA road-work statistic keeps the vehicle-pedestrian interface close to contractor safety reviews during active lane and utility work. The United States vehicle banksman systems sector is projected to record 7.7% CAGR during the assessment period due to roadwork exposure and rental fleet accountability. BLS reported in February 2026 that 61 road-work-zone pedestrian fatalities involved motorized vehicles in 2024. OSHA and contractor safety teams are expected to examine reversing controls beside operator visibility during pre-task planning and site reviews. Rental companies serving telehandler fleets are projected to value systems that retain installation records across recurring hires. The next procurement question is expected to be whether warning evidence travels with the machine between sites.
- China entered late 2025 with heavy excavator sales moving through domestic and export channels across an active equipment base. Vehicle banksman systems demand in China is forecast to rise at 10.1% CAGR over the forecast period driven by active equipment fleets and local retrofit channels. The China Construction Machinery Association reported in November 2025 that 192,135 excavators were sold during January through October 2025. CCMA member companies and regional dealers are expected to influence access to machine-specific installation support. Fleet owners are anticipated to compare alarm coverage with cost control across mixed excavator brands. Domestic service depth is expected to decide whether pilot systems expand across contractor project fleets.
- India now combines a broad road network with rapid project turnover across highways and urban utilities. The Ministry of Road Transport and Highways reported 146,560 km of National Highways in December 2025. India's vehicle banksman systems outlook is anticipated to advance at 10.8% CAGR over the assessment period supported by infrastructure work and formal contractor safety controls. MoRTH specifications and local equipment dealers are expected to shape fitment choices across hired plant. Site managers are projected to favor systems designed for quick installation and checking between contracts. Service coverage beyond major cities remains the commercial test for wider account expansion across regional infrastructure projects.
- Germany's internal transport accident record keeps vehicle-pedestrian separation under close workplace review across plants and material handling areas. DGUV reported in October 2025 that 32,652 accidents in 2024 involved industrial trucks and material transport carts within internal transport activity. Fleet safety teams are expected to bring the same attention to warning reliability around mobile plant and loading areas. Adoption of vehicle banksman systems in Germany is estimated to expand at 7.2% CAGR through 2036 supported by documented risk controls and technical review. DGUV guidance and local system integrators are anticipated to influence commissioning records during site approval and fleet renewal decisions. Procurement is expected to favor suppliers that explain alarm zones in plain operating terms before site approval.
- Britain's latest fatal injury release keeps moving vehicles visible in workplace safety decisions across construction and industrial sites. HSE reported in June 2026 that 24 worker deaths during 2025/26 involved workers struck by moving vehicles. Vehicle banksman systems sales in the United Kingdom are forecast to expand at 8.0% CAGR by 2036 supported by construction transport controls and rental service accountability. Current HSE guidance expects banksmen to remain visible to drivers where reversing cannot be avoided during site operations. UK contractors and hire fleets are projected to compare camera evidence with proximity alerts during site trials. Adoption is expected to depend on whether fitting support keeps pace with short rental cycles.
- Japan's construction equipment base remains commercially relevant because domestic fleets rely on disciplined dealer support and compact worksite layouts. CEMA reported in April 2026 that FY2025 domestic construction equipment shipments declined 5.3%, while overseas shipments increased 0.6%. Local OEMs and rental operators are expected to base safety reviews on machine fit and documented maintenance. In Japan, vehicle banksman systems demand is anticipated to advance at 6.8% CAGR through 2036 due to fleet renewal and formal installation practices. CEMA members and dealer service networks are projected to influence approved retrofit routes through machine-specific installation support. The practical advantage is expected to come from systems that fit compact equipment without adding cab clutter.
- Australia's worker fatality record gives vehicle interaction a clear place in construction and mining safety reviews. Safe Work Australia reported in October 2025 that vehicle incidents caused 79 worker fatalities in 2024. Remote projects then add a service challenge because equipment and technicians are often separated by long travel distances. Australia is estimated to post 8.3% CAGR over the forecast period due to fleets serving mines and infrastructure maintenance. State safety regulators and rental groups are expected to demand dependable commissioning support before systems move across remote project fleets. Accounts comparing wheel loaders are projected to value warning systems that retain useful alerts during dust and changing haul routes. Regional service reach remains the deciding tension for remote fleet expansion across mining and infrastructure accounts.
Who are the notable companies in the vehicle banksman systems market?
Brigade Electronics, Hexagon, Matrix Design Group, Avonwood Developments (ZoneSafe), VisionTrack, Spillard Safety Systems, and SiteZone Safety are the notable companies shaping this market.
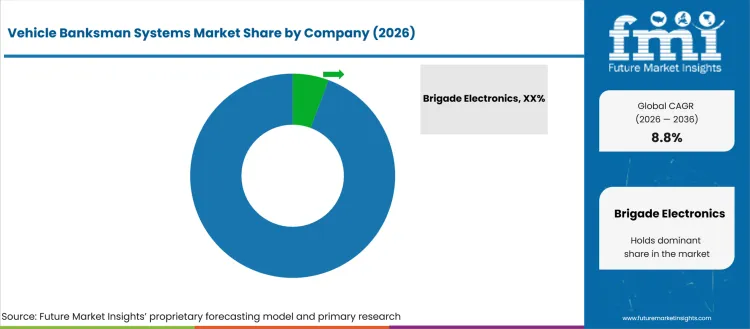
Competition is expected to center on how well a warning system fits the actual vehicle route and the site control plan. HSE updated its vehicle movement guidance in April 2025 and continued to emphasize visibility between drivers and banksmen during reversing work. Fleet safety teams are projected to compare detection method with alarm trust and installation support. Alert and video data access is expected to carry more weight where incident review crosses several active sites and mixed fleets. Vendors that connect warning hardware with fleet control platforms are anticipated to compete for accounts that need one review process across mixed fleets.
- Brigade Electronics and Avonwood Developments through ZoneSafe are expected to address different proximity warning needs. Brigade Electronics' radar and camera options cover mobile plant while ZoneSafe uses RFID tags and UWB.
- Fleet managers are anticipated to review VisionTrack and Spillard Safety Systems where immediate warnings need incident evidence. VisionTrack supports video review while Spillard supplies camera and detection systems for construction and industrial vehicles.
- Mining accounts are projected to compare Hexagon and Matrix Design Group where collision avoidance connects with operating data. Hexagon integrates operator alertness with collision avoidance while Matrix offers proximity detection for powered haulage. Site trials are expected to examine alert timing and fit with existing fleet controls before wider deployment.
- SiteZone Safety is expected to compete where managers want proximity alerts translated into location-specific changes. Site managers are anticipated to assess it differently from video platforms because review begins with pedestrian interaction around plant.
Competitive Benchmarking: Vehicle Banksman Systems Market
| Company | Detection Portfolio Fit | Fleet Data Fit | Specification Support | Service Reach |
|---|---|---|---|---|
| Brigade Electronics | High | Medium | High | Global |
| Hexagon | High | High | High | Global |
| Matrix Design Group | High | High | High | Global |
| Avonwood Developments (ZoneSafe) | High | Medium | High | Regional; Europe |
| VisionTrack | Medium | High | High | Global |
| Spillard Safety Systems | High | High | High | Regional; United Kingdom |
| SiteZone Safety | High | High | High | Regional; Europe |
Source: Future Market Insights competitive analysis, 2026. Ratings reflect relative portfolio relevance and workflow fit. Service capability and geographic reach shape the remaining comparison.
Key Developments in the Vehicle Banksman Systems Market
- In May 2026, Brigade Electronics launched Backsense Radar OSD to combine radar detection and camera views on one in-cab display. The system overlays radar zones on the monitor and supports visual or audible warning for construction and mining vehicles.
- In July 2025, Hexagon launched OAS 7.5 with integration to its CAS 10 collision avoidance system for mining fleets. Hexagon reported in July 2025 that Whitehaven Coal tested the combined system across more than 10,000 operating hours and used automatic video capture for predicted collision events.
- In April 2025, Matrix Design Group announced that IntelliZone had received CE and ATEX certification for powered haulage and proximity detection applications. The certifications extend the system's qualification route for European sites and hazardous-area environments that require documented equipment approval.
- In May 2025, VisionTrack renewed its partnership with Fleeto for a further three years and expanded connected camera use across the fleet. Front-facing cameras use 4G connectivity and provide access to the Autonomise.ai platform for alerts or vehicle footage.
Key Players in the Vehicle Banksman Systems Market
Proximity and Collision Warning Systems
- Brigade Electronics
- Matrix Design Group
- Avonwood Developments (ZoneSafe)
- SiteZone Safety
Camera and Video Telematics Systems
- VisionTrack
- Spillard Safety Systems
Mining Collision Avoidance Platforms
- Hexagon
Vehicle Banksman Systems Market - Report Scope
| Coverage field | Report scope |
|---|---|
| Market breakdown | By System Type, Detection Technology, Vehicle Type, Application, Sales Model, and Region |
| Quantitative Units | Revenue in USD Million, CAGR in % |
| Market Definition | Vehicle banksman systems are warning and monitoring products used on or around mobile plant to reduce collision risk during reversing or close vehicle-pedestrian interaction. |
| Regions Covered | North America, Latin America, Europe, East Asia, South Asia, Oceania, and Middle East and Africa |
| Countries Covered | United States, China, India, Germany, United Kingdom, Japan, Australia, and 25+ countries |
| Key Companies Profiled | Brigade Electronics, Hexagon, Matrix Design Group, Avonwood Developments (ZoneSafe), VisionTrack, Spillard Safety Systems, and SiteZone Safety |
| Forecast Period | 2026 to 2036 |
| Approach | Hybrid bottom-up and top-down methodology using equipment activity, infrastructure work, fleet operating patterns, safety requirements, and company portfolio validation. |
Source: Future Market Insights - analysis driven by proprietary forecasting models and primary research
Vehicle Banksman Systems Market - Research Methodology
| Method | Approach |
|---|---|
| Primary Research | FMI analysts interview fleet safety managers and construction contractors about reversing exposure or detection fit. Rental fleet managers and site supervisors add evidence on installation time and alarm trust across changing work zones. Interviews examine service ownership and retrofit timing across construction or mining fleets. Responses are compared across vehicle classes and operating settings so the model reflects actual approval paths instead of assuming one installation pattern for every account. |
| Desk Research | Desk research reviews government safety releases and association equipment data beside official company disclosures for current product and operating context. Analysts compare exposure patterns with product scope and country activity indicators before applying forecast assumptions. Company pages are checked to confirm current portfolio relevance and active market participation. The research team also reviews installation routes and detection methods so adjacent safety products are not counted inside the defined market. |
| Market Sizing and Forecasting | Market sizing uses a hybrid bottom-up and top-down methodology that reconciles equipment activity with addressable fleet categories. Analysts test segment shares against installation routes and verified company portfolios across the competitive set. Country analysis is built from relevant infrastructure activity and equipment use patterns before forecast paths are reconciled. |
| Data Validation | FMI validates model output against country evidence and vendor activity before final reconciliation across the profiled national markets. Analysts compare country CAGRs with equipment activity and service access before accepting the forecast spread. Segment shares are reviewed against installation logic and the current supplier set. Final values are reconciled against primary interview feedback so country growth paths remain consistent with the market definition and the disclosed competitive scope. |
Source: Future Market Insights (FMI) analysis, based on proprietary forecasting model and primary research
< class="report_content_title">Vehicle Banksman Systems Market by SegmentsVehicle Banksman Systems Market segmented by System Type:
- Wearable Banksman Alert Systems
- Vehicle-mounted Proximity Systems
- Camera-based Banksman Systems
- Radar or Ultrasonic Detection Systems
- Integrated Site Safety Platforms
Vehicle Banksman Systems Market segmented by Detection Technology:
- RFID or BLE
- UWB
- Radar
- AI Camera Vision
- GPS or geofencing
Vehicle Banksman Systems Market segmented by Vehicle Type:
- Excavators
- Dump Trucks
- Loaders
- Forklifts
- Mixed Construction Fleets
Vehicle Banksman Systems Market segmented by Application:
- Reversing Safety
- Blind Spot Alerts
- Exclusion Zone Control
- Site Traffic Management
Vehicle Banksman Systems Market segmented by Sales Model:
- Hardware Sale
- Subscription Platform
- Fleet Safety Service
Vehicle Banksman Systems Market by Region:
- North America
- United States
- Canada
- Latin America
- Brazil
- Mexico
- Argentina
- Europe
- Germany
- United Kingdom
- France
- Italy
- Spain
- East Asia
- China
- Japan
- South Korea
- South Asia
- India
- Thailand
- Indonesia
- Oceania
- Australia
- New Zealand
- Middle East and Africa
- GCC countries
- South Africa
- Turkey
- Bureau of Labor Statistics. (2026, February). National Census of Fatal Occupational Injuries in 2024. USA Department of Labor.
- Health and Safety Executive. (2025, April). Section 5 - Vehicle movements. Health and Safety Executive.
- Health and Safety Executive. (2025, October). Protecting workers from workplace transport: getting the basics right. Health and Safety Executive.
- Health and Safety Executive. (2026, June). Work-related fatal injuries in Great Britain. Health and Safety Executive.
- Health and Safety Executive. (2026, June). Company fined after employee seriously injured by reversing flat-bed truck. Health and Safety Executive.
- Safe Work Australia. (2025, October). Key Work Health and Safety Statistics Australia 2025. Safe Work Australia.
- Press Information Bureau. (2025, January). Ministry of Road Transport and Highways. Government of India.
- Press Information Bureau. (2025, December). Year End Review 2025 - Ministry of Road Transport & Highways. Government of India.
- Press Information Bureau. (2025, December). Ministry of Defence; Year End Review - 2025. Government of India.
- Deutsche Gesetzliche Unfallversicherung. (2025, October). Arbeitsunfallgeschehen 2024. DGUV.
- Brigade Electronics. (2025, July). Brigade Backs CLOCS-A to Drive Safer Construction Transport Across Australia. Brigade Electronics.
- Brigade Electronics. (2026, May). Brigade launches Backsense® Radar OSD for smarter, integrated vehicle safety. Brigade Electronics.
- Hexagon. (2024, September). Hexagon unveils newest Collision Avoidance System adding 4D radar enhancements and insights. Hexagon.
- Hexagon. (2025, February). Hexagon at bauma 2025 - Enabling construction professionals to put data to work. Hexagon.
- Hexagon. (2026, March). Hexagon Vehicle Intervention System first and only open-pit Level 9 solution to pass University of Pretoria safety test. Hexagon.
- Hexagon. (2025, July). Hexagon sets benchmark for mine safety with world-first system integration. Hexagon.
- Matrix Design Group. (2025, April). IntelliZone is now CE and ATEX Certified! Matrix Design Group.
- Matrix Design Group. (2025, June). AI vs. Inexperience: Preventing Accidents Among New Hires in High-Risk Workplaces. Matrix Design Group.
- VisionTrack. (2025, May). VisionTrack Strengthens Longstanding Partnership with Fleeto. VisionTrack.
- ZoneSafe. (2025, November). People-Plant Interface: Tag-Based vs. Non-Tag Solutions. Avonwood Developments Ltd.
- SiteZone Safety. (2026, April). Your SiteZone dashboard just got a major update. SiteZone Safety.
- SiteZone Safety. (2026, May). Who are AVA and ZARA? SiteZone Safety.
- SiteZone Safety. (2026, June). What our FLT data reveals about pedestrian collision risks. SiteZone Safety.
- Matrix Design Group. (2026, January). Smarter Forklift Safety For Every Brand. Matrix Design Group.
- Matrix Design Group. (2026, March). From Bolt-On to Built-In: The New Collision Avoidance Playbook. Matrix Design Group.
This bibliography is provided for reader reference and uses primary government, standards-body, official trade body, and company sources.
This Report Answers
- What value is the vehicle banksman systems market estimated to reach in 2026 and by 2036?
- What CAGR is the vehicle banksman systems market projected to record from 2026 to 2036?
- Which segments are expected to shape demand across the five parent categories in the vehicle banksman systems market?
- Which safety risks and fleet operating conditions are projected to support adoption or purchase activity?
- How are country CAGRs expected to differ across the seven profiled national markets?
- Which companies are expected to compete across detection fit and fleet data fit while supporting specifications and service reach?
- How does FMI validate forecasts through hybrid bottom-up and top-down methodology with primary research?
- What should fleet safety managers and contractors address before broader account expansion or sourcing commitment?
- How are documented alarm performance and site approval rules expected to affect commissioning records or vendor selection?
Frequently Asked Questions
What is driving growth in the Vehicle Banksman Systems Market?
Growth is expected to be driven by blind-zone risk and tighter site traffic control. Fleet safety teams are projected to seek earlier warnings around mobile plant.
Who are the key players in the Vehicle Banksman Systems Market?
Key players include Brigade Electronics and Hexagon alongside Matrix Design Group and ZoneSafe. Competition is projected to center on detection fit and service support.
What is a significant restraint in the Vehicle Banksman Systems Market?
A significant restraint is approval burden across mixed fleets and site rules. Adoption is anticipated to slow when alarm evidence or service ownership remains unclear.
Why should executives track the Vehicle Banksman Systems Market?
Executives should track the market because warning-system choices affect incident exposure and fleet continuity across active worksites. The category also shapes service accountability during mixed-fleet retrofit programs.
What business problem does the Vehicle Banksman Systems Market address?
The market addresses blind-zone risk around mobile plant during reversing and close pedestrian interaction. Warning systems provide earlier alerts before visual contact becomes unreliable.
What should procurement leaders evaluate before selecting suppliers?
Procurement leaders should evaluate detection fit and false-alert control before selecting suppliers. Reviews should also cover installation records and local service responsibility.
What limits return on investment for purchasers?
Return on investment is expected to weaken when nuisance alarms reduce operator trust or mixed-fleet fitting raises support costs. Unclear site acceptance rules are expected to delay wider deployment.
How do suppliers build long-term account confidence?
Suppliers build account confidence by providing repeatable warning performance and responsive field support across changing site layouts. Clear alarm logic and installation records support recurring fleet decisions.
Preview the report firsthand - request a free sample
Get SampleGet the brochure for pricing and purchase details.
Get PDFTable of Content
- Key Takeaways
- Market Size and CAGR
- Top Growth Driver
- Fastest Growing Segment
- Leading Region
- Key Companies
- Emerging Opportunities
- Executive Summary
- Global Market Outlook
- Demand-side Trends
- Supply-side Trends
- Technology Roadmap Analysis
- Analysis and Recommendations
- Analyst Perspective (What is happening? Why now? What should investors know?)
- Key Questions Answered
- How large is the market?
- What is the CAGR?
- What are key trends?
- Which region dominates?
- Who are the leaders?
- Market Overview
- Market Coverage / Taxonomy
- Market Definition / Scope / Limitations
- Research Methodology
- Chapter Orientation
- Analytical Lens and Working Hypotheses
- Market Structure, Signals, and Trend Drivers
- Benchmarking and Cross-market Comparability
- Market Sizing, Forecasting, and Opportunity Mapping
- Research Design and Evidence Framework
- Desk Research Programme (Secondary Evidence)
- Expert Input and Fieldwork (Primary Evidence)
- Tooling, Models, and Reference Databases
- Data Engineering and Model Build
- Quality Assurance and Audit Trail
- Market Background
- Market Dynamics (Drivers, Restraints, Opportunity, Trends)
- Scenario Forecast (Optimistic, Likely, Conservative)
- Impact Analysis
- AI Impact
- Sustainability Impact
- Regulatory Impact
- Technology Impact
- Consumer / Buyer Analysis
- Purchase Drivers
- Adoption Barriers
- Buyer Journey
- Opportunity Map Analysis
- Product Life Cycle Analysis
- Supply Chain Analysis
- Investment Feasibility Matrix
- Value Chain Analysis
- PESTLE and Porter's Analysis
- Regulatory Landscape
- Regional Parent Market Outlook
- Production and Consumption Statistics
- Import and Export Statistics
- Global Market Analysis and Forecast, 2021 to 2036
- Historical Market Size Value (USD Million) & Volume (Unit) Analysis, 2021 to 2025
- Current and Future Market Size Value (USD Million) & Volume (Unit) Projections, 2026 to 2036
- Y-o-Y Growth Trend Analysis
- Absolute $ Opportunity Analysis
- Global Market Pricing Analysis, 2021 to 2036
- Global Market Analysis and Forecast, By System Type, 2021 to 2036
- Introduction / Key Findings
- Historical Market Size Value (USD Million) & Volume (Unit) Analysis By System Type, 2021 to 2025
- Current and Future Market Size Value (USD Million) & Volume (Unit) Analysis and Forecast By System Type, 2026 to 2036
- Vehicle-mounted Proximity Systems
- Wearable Banksman Alert Systems
- Camera-based Banksman Systems
- Radar - Ultrasonic Detection Systems
- Integrated Site Safety Platforms
- Vehicle-mounted Proximity Systems
- Y-o-Y Growth Trend Analysis By System Type, 2021 to 2025
- Absolute $ Opportunity Analysis By System Type, 2026 to 2036
- Global Market Analysis and Forecast, By Detection Technology, 2021 to 2036
- Introduction / Key Findings
- Historical Market Size Value (USD Million) & Volume (Unit) Analysis By Detection Technology, 2021 to 2025
- Current and Future Market Size Value (USD Million) & Volume (Unit) Analysis and Forecast By Detection Technology, 2026 to 2036
- RFID - BLE
- UWB
- Radar
- AI Camera Vision
- GPS - Geofencing
- RFID - BLE
- Y-o-Y Growth Trend Analysis By Detection Technology, 2021 to 2025
- Absolute $ Opportunity Analysis By Detection Technology, 2026 to 2036
- Global Market Analysis and Forecast, By Vehicle Type, 2021 to 2036
- Introduction / Key Findings
- Historical Market Size Value (USD Million) & Volume (Unit) Analysis By Vehicle Type, 2021 to 2025
- Current and Future Market Size Value (USD Million) & Volume (Unit) Analysis and Forecast By Vehicle Type, 2026 to 2036
- Excavators
- Dump Trucks
- Loaders
- Forklifts
- Mixed Construction Fleets
- Excavators
- Y-o-Y Growth Trend Analysis By Vehicle Type, 2021 to 2025
- Absolute $ Opportunity Analysis By Vehicle Type, 2026 to 2036
- Global Market Analysis and Forecast, By Application, 2021 to 2036
- Introduction / Key Findings
- Historical Market Size Value (USD Million) & Volume (Unit) Analysis By Application, 2021 to 2025
- Current and Future Market Size Value (USD Million) & Volume (Unit) Analysis and Forecast By Application, 2026 to 2036
- Reversing Safety
- Blind Spot Alerts
- Exclusion Zone Control
- Site Traffic Management
- Reversing Safety
- Y-o-Y Growth Trend Analysis By Application, 2021 to 2025
- Absolute $ Opportunity Analysis By Application, 2026 to 2036
- Global Market Analysis and Forecast, By Sales Model, 2021 to 2036
- Introduction / Key Findings
- Historical Market Size Value (USD Million) & Volume (Unit) Analysis By Sales Model, 2021 to 2025
- Current and Future Market Size Value (USD Million) & Volume (Unit) Analysis and Forecast By Sales Model, 2026 to 2036
- Hardware Sale
- Subscription Platform
- Fleet Safety Service
- Hardware Sale
- Y-o-Y Growth Trend Analysis By Sales Model, 2021 to 2025
- Absolute $ Opportunity Analysis By Sales Model, 2026 to 2036
- Global Market Analysis and Forecast, By Region, 2021 to 2036
- Introduction
- Historical Market Size Value (USD Million) & Volume (Unit) Analysis By Region, 2021 to 2025
- Current Market Size Value (USD Million) & Volume (Unit) Analysis and Forecast By Region, 2026 to 2036
- North America
- Latin America
- Europe
- East Asia
- South Asia
- Oceania
- Middle East and Africa
- Market Attractiveness Analysis By Region
- North America Market Analysis and Forecast, By Country, 2021 to 2036
- Historical Market Size Value (USD Million) & Volume (Unit) Trend Analysis By Market Taxonomy, 2021 to 2025
- Market Size Value (USD Million) & Volume (Unit) Forecast By Market Taxonomy, 2026 to 2036
- By Country
- United States
- Canada
- By System Type
- By Detection Technology
- By Vehicle Type
- By Application
- By Sales Model
- By Country
- Market Attractiveness Analysis
- By Country
- By System Type
- By Detection Technology
- By Vehicle Type
- By Application
- By Sales Model
- Key Takeaways
- Latin America Market Analysis and Forecast, By Country
- Historical Market Size Value (USD Million) & Volume (Unit) Trend Analysis By Market Taxonomy, 2021 to 2025
- Market Size Value (USD Million) & Volume (Unit) Forecast By Market Taxonomy, 2026 to 2036
- By Country
- Brazil
- Mexico
- Argentina
- By System Type
- By Detection Technology
- By Vehicle Type
- By Application
- By Sales Model
- By Country
- Market Attractiveness Analysis
- By Country
- By System Type
- By Detection Technology
- By Vehicle Type
- By Application
- By Sales Model
- Key Takeaways
- Europe Market Analysis and Forecast, By Country
- Historical Market Size Value (USD Million) & Volume (Unit) Trend Analysis By Market Taxonomy, 2021 to 2025
- Market Size Value (USD Million) & Volume (Unit) Forecast By Market Taxonomy, 2026 to 2036
- By Country
- Germany
- United Kingdom
- France
- Italy
- Spain
- By System Type
- By Detection Technology
- By Vehicle Type
- By Application
- By Sales Model
- By Country
- Market Attractiveness Analysis
- By Country
- By System Type
- By Detection Technology
- By Vehicle Type
- By Application
- By Sales Model
- Key Takeaways
- East Asia Market Analysis and Forecast, By Country
- Historical Market Size Value (USD Million) & Volume (Unit) Trend Analysis By Market Taxonomy, 2021 to 2025
- Market Size Value (USD Million) & Volume (Unit) Forecast By Market Taxonomy, 2026 to 2036
- By Country
- China
- Japan
- South Korea
- By System Type
- By Detection Technology
- By Vehicle Type
- By Application
- By Sales Model
- By Country
- Market Attractiveness Analysis
- By Country
- By System Type
- By Detection Technology
- By Vehicle Type
- By Application
- By Sales Model
- Key Takeaways
- South Asia Market Analysis and Forecast, By Country
- Historical Market Size Value (USD Million) & Volume (Unit) Trend Analysis By Market Taxonomy, 2021 to 2025
- Market Size Value (USD Million) & Volume (Unit) Forecast By Market Taxonomy, 2026 to 2036
- By Country
- India
- Thailand
- Indonesia
- By System Type
- By Detection Technology
- By Vehicle Type
- By Application
- By Sales Model
- By Country
- Market Attractiveness Analysis
- By Country
- By System Type
- By Detection Technology
- By Vehicle Type
- By Application
- By Sales Model
- Key Takeaways
- Oceania Market Analysis and Forecast, By Country
- Historical Market Size Value (USD Million) & Volume (Unit) Trend Analysis By Market Taxonomy, 2021 to 2025
- Market Size Value (USD Million) & Volume (Unit) Forecast By Market Taxonomy, 2026 to 2036
- By Country
- Australia
- New Zealand
- By System Type
- By Detection Technology
- By Vehicle Type
- By Application
- By Sales Model
- By Country
- Market Attractiveness Analysis
- By Country
- By System Type
- By Detection Technology
- By Vehicle Type
- By Application
- By Sales Model
- Key Takeaways
- Middle East and Africa Market Analysis and Forecast, By Country
- Historical Market Size Value (USD Million) & Volume (Unit) Trend Analysis By Market Taxonomy, 2021 to 2025
- Market Size Value (USD Million) & Volume (Unit) Forecast By Market Taxonomy, 2026 to 2036
- By Country
- GCC countries
- South Africa
- Turkey
- By System Type
- By Detection Technology
- By Vehicle Type
- By Application
- By Sales Model
- By Country
- Market Attractiveness Analysis
- By Country
- By System Type
- By Detection Technology
- By Vehicle Type
- By Application
- By Sales Model
- Key Takeaways
- Key Countries Market Analysis
- United States
- Pricing Analysis
- Market Share Analysis, 2025
- By System Type
- By Detection Technology
- By Vehicle Type
- By Application
- By Sales Model
- China
- Pricing Analysis
- Market Share Analysis, 2025
- By System Type
- By Detection Technology
- By Vehicle Type
- By Application
- By Sales Model
- India
- Pricing Analysis
- Market Share Analysis, 2025
- By System Type
- By Detection Technology
- By Vehicle Type
- By Application
- By Sales Model
- Germany
- Pricing Analysis
- Market Share Analysis, 2025
- By System Type
- By Detection Technology
- By Vehicle Type
- By Application
- By Sales Model
- United Kingdom
- Pricing Analysis
- Market Share Analysis, 2025
- By System Type
- By Detection Technology
- By Vehicle Type
- By Application
- By Sales Model
- Japan
- Pricing Analysis
- Market Share Analysis, 2025
- By System Type
- By Detection Technology
- By Vehicle Type
- By Application
- By Sales Model
- Australia
- Pricing Analysis
- Market Share Analysis, 2025
- By System Type
- By Detection Technology
- By Vehicle Type
- By Application
- By Sales Model
- United States
- Market Structure Analysis
- Competition Dashboard
- Competition Benchmarking
- Market Share Analysis of Top Players
- By Regional
- By System Type
- By Detection Technology
- By Vehicle Type
- By Application
- By Sales Model
- Emerging Startups
- Innovation Benchmarking
- Competition Analysis
- Competition Deep Dive
- Brigade Electronics
- Overview
- Product Portfolio
- Profitability by Market Segments (Product/Region/Sales Channel)
- Sales Footprint
- Strategy Overview
- Marketing Strategy
- Product Strategy
- Channel Strategy
- Hexagon
- Matrix Design Group
- Avonwood Developments (ZoneSafe)
- VisionTrack
- Spillard Safety Systems
- SiteZone Safety
- Brigade Electronics
- Case Studies
- Success Stories
- Recent Developments
- Competition Deep Dive
- Assumptions & Acronyms Used


