

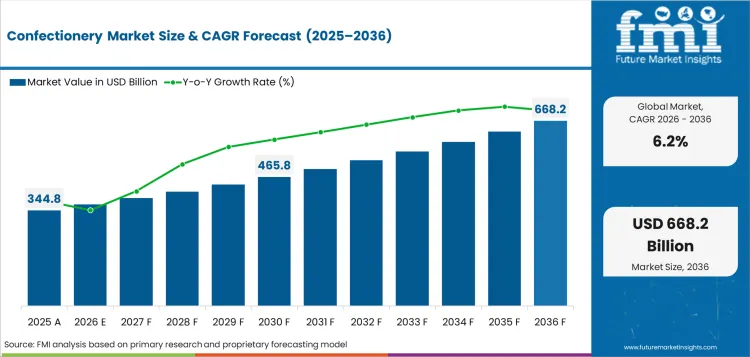
- Market Size (2026)
- USD 344.8 Bn
- Forecast (2036)
- USD 629.3 Bn
- CAGR (2026 to 2036)
- 6.2%
Confectionery Market Size, Market Forecast and Outlook By FMI
Summary of the Confectionery Market
- Demand and Growth Drivers
- Chocolate confectionery keeps the leading product position with 42.0% share as bars and blocks support everyday buying.
- India is forecast to record 7.8% CAGR as modern retail and urban snack packs widen branded candy access.
- China is expected to expand at 7.5% CAGR with premium gifting and fruit flavor launches supporting value.
- Brazil and the UK are each projected at 6.5% CAGR where retail chains support family packs and seasonal boxes.
- Product and Segment View
- Chocolate confectionery leads Product Type with 42.0% share in 2026 as molded bars suit impulse and gifting occasions.
- Fruits leads Flavor with 35.0% share in 2026 as strawberry and orange variants fit gummies and boiled candy.
- Everyday Consumption is estimated to lead Application with 46.0% share in 2026 as single serve packs keep repeat use steady.
- Supermarkets and Hypermarkets are forecast to hold 37.5% share in 2026 as shelf space supports display and promotion.
- Geography and Competitive Outlook
- India and China are forecast above the global CAGR due to urban retail reach and branded snacking expansion.
- Germany and Japan track below the global pace as mature chocolate buyers shift value through premium formats.
- Mars Inc. and Ferrero International S.A. hold global strength across chocolate and sugar candy portfolios.
- Mondelez International and Nestle keep strong regional positions through Cadbury and KitKat based chocolate lines.
- Analyst Opinion
- Nandini Roy Choudhury, Principal Consultant at FMI says, "Confectionery growth is driven by discipline, not indulgence. Brands that stay affordable and protect taste despite rising cocoa costs will survive especially as India and China drive volume while mature markets test the limits of premium pricing"
- Confectionery Market Value Analysis
- Value growth is tied to pack architecture as brands shift between single serve bars and family sharing bags.
- Cocoa price pressure supports higher average prices for chocolate confectionery but limits volume growth in mature countries.
- Supermarkets and hypermarkets protect value through seasonal displays that give premium chocolate stronger holiday visibility.
- Low sugar formats add value in urban channels as brands use diet candy for shoppers reading added sugar labels.
- Premium variants extend into low calorie chocolate where brands need indulgence cues with calorie control.
Key Takeaways, Market Size, and Forecast
| Metric | Value |
|---|---|
| Market Size (2025) | USD 324.7 Billion |
| Market Size (2036) | USD 629.3 Billion |
| CAGR (2026–2036) | 6.2% |
| Incremental Opportunity (2026–2036) | USD 284.5 Billion |
| Leading Product Type (2026) | Chocolate Confectionery |
| Chocolate Confectionery Share (2026) | 42.0% |
| Leading Flavor (2026) | Fruits |
| Fruits Share (2026) | 35.0% |
| Fastest-Growing Country | India |
| India CAGR | 7.8% |
| 2nd Fastest-Growing Country | China |
| China CAGR | 7.5% |
The confectionery sector is shifting from routine candy buying into a managed snack category with clearer roles for premium chocolate and low sugar sweets. ICCO estimated global cocoa grindings at 4.60 million tonnes for the 2024 to 2025 season in November 2025. That pressure makes formulation control a buying issue for brands using chocolate confectionery and cocoa based ingredients. FDA guidance updated in March 2026 keeps added sugar information visible to shoppers. This pushes brands to balance indulgence formats with sugar free candy and controlled portion packs.
Confectionery Market Definition
The confectionery market covers packaged chocolate sweets, sugar candy, gum products and novelty sweets sold through retail and foodservice channels. The scope includes bars, blocks, molded chocolates and gummies. It covers everyday eating, gifting, celebrations and low sugar snacking. The study excludes biscuits sold as ordinary bakery staples and sweet beverages sold outside confectionery positioning.
Confectionery Market Inclusions
Market scope covers commercially traded confectionery products and confectionery ingredients categorized by product type, flavor, application, end use, distribution channel and ingredient type across global regions. Revenue scope covers 2026 to 2036. The key stakeholders include confectionery manufacturers, ingredient suppliers, retailers, foodservice operators and packaging suppliers.
Confectionery Market Exclusions
The study excludes ordinary bakery bread, sweetened beverages, dairy desserts, ice cream parlour sales and ingredients sold without direct confectionery use. These categories sit outside the defined packaged confectionery boundary.
Confectionery Market Research Methodology
- Primary Research: FMI analysts reviewed confectionery manufacturers, cocoa ingredient suppliers and retail category teams. Interviews focused on pack size, shelf placement and pricing response under cocoa cost pressure.
- Desk Research: The desk review used public trade data, food processing reports and regulatory guidance for sugar and ingredient labeling. Company product releases were reviewed for chocolate and candy launch direction.
- Market Sizing and Forecasting: The forecast used the 2026 value as the anchor and applied the stated CAGR to 2036. Segment shares were checked against product mix, retail channel behavior and ingredient cost exposure.
- Data Validation: Final values were checked against cocoa grindings, food retail activity and company portfolios. Country growth was reviewed against modern retail scale and confectionery manufacturing signals.
Why is the Confectionery Market Growing?
- Checkout and impulse retail keep chocolate bars moving as supermarkets protect small pack visibility near payment points.
- Gift packs support higher value purchases during festivals as molded chocolate and seasonal boxes carry stronger price points.
- Fruit flavors widen sugar candy use as gummies and boiled sweets rotate flavors faster than classic chocolate lines.
- Low sugar claims support new product work as shoppers compare added sugar information on pack labels.
Everyday pack buying remains the main volume driver for confectionery brands. USDA Foreign Agricultural Service data showed USA confectionery exports at USD 812.01 million and 156,693 metric tons in 2025. This export base shows how candy and gum continue to move through established global retail routes. Brands that keep small packs affordable can protect repeat use even when cocoa prices lift chocolate costs. The practical result is a forecast in which volume depends on routine purchase points while value depends on chocolate mix.
Chocolate producers face a tighter cost equation than sugar candy producers. The International Cocoa Organization estimated 2024 to 2025 global cocoa production at 4.728 million tonnes and grindings at 4.606 million tonnes in February 2026. That balance supports relief from the prior deficit but keeps processors alert to supply changes. Manufacturers using cocoa based ingredients have to adjust pack weight and pricing with less room for error. This creates a clear advantage for suppliers able to manage cocoa sourcing and formulation costs.
Market Segmentation Analysis
- Chocolate confectionery is projected to account for 42.0% share in 2026 as molded chocolates and bars keep strong retail display space.
- With an estimated 35.0% share in 2026, Fruits is expected to lead Flavor as strawberry and citrus profiles fit jellies and gummies and boiled sweets.
- Everyday Consumption is anticipated to hold 46.0% of Application in 2026 since single serve packs support routine snack use.
- Households are expected to represent 52.0% of End Use in 2026 with family packs and multi packs supporting grocery trips.
- Supermarkets and Hypermarkets are forecast to hold 37.5% of Distribution Channel in 2026 where display and price promotions shape choice.
- Cocoa Based Ingredients are estimated to capture 42.5% of Ingredient Type in 2026 as chocolate lines carry higher value per pack.
The market is divided first by product type as chocolate confectionery and sugar confectionery shape most shelf planning. Flavor splits are led by fruits and chocolate variants while mint holds a clear place in gum and breath freshening products. Application is structured around everyday consumption and gifting since each occasion changes pack size and price. End use spans households and retail stores with foodservice playing a smaller role. Distribution is split between supermarkets, convenience stores and online retail. Ingredient type separates cocoa based inputs from natural sweeteners and flavoring ingredients.
Insights into the Chocolate confectionery Product Type Segment
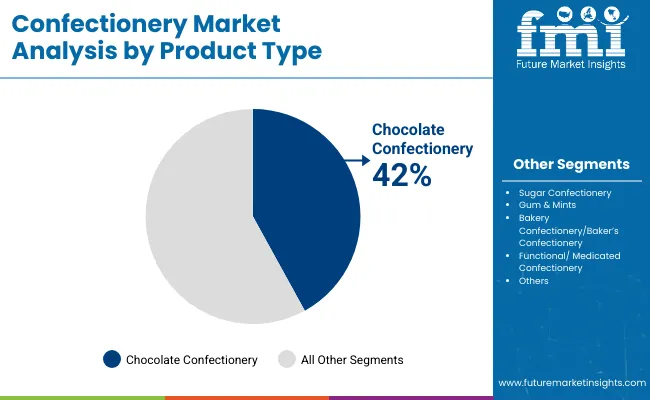
- Chocolate confectionery is projected to account for 42.0% share in 2026. Molded chocolates and bars keep the highest product share as retailers give these packs wide shelf space and repeat holiday displays.
- Chocolate exposure makes cocoa pricing harder than sugar candy pricing. ICCO reported Germany at 460 thousand tonnes of cocoa grindings in 2023 to 2024.
Insights into the Fruits Flavor Segment
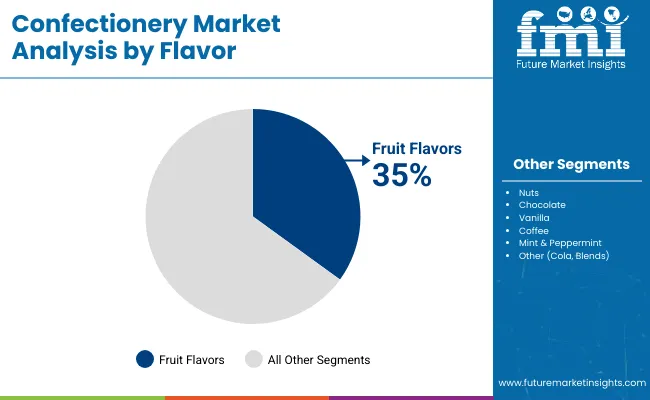
- Fruits is projected to account for 35.0% share in 2026. Fruit flavors are expected to lead flavor demand as strawberry and citrus profiles work across gummies and hard candy.
- Flavor systems must stay stable in acidic candy bases. This keeps fruit flavor work tied to color stability and shelf life checks.
Insights into the Everyday Consumption Application Segment
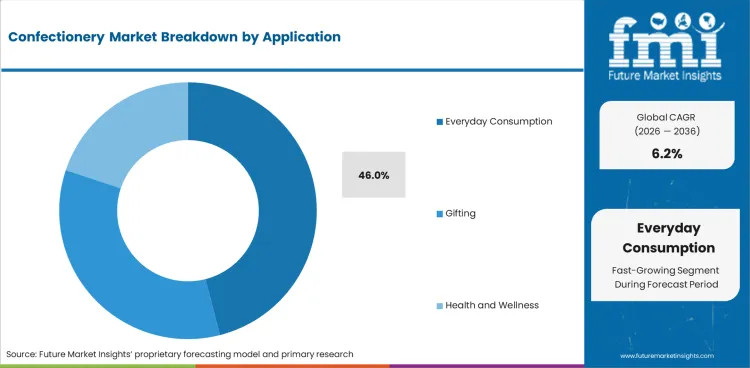
- Everyday Consumption is projected to account for 46.0% share in 2026. Everyday Consumption is anticipated to lead applications as single serve bars and small candy packs fit routine grocery buying.
- Routine use favors low unit prices over elaborate packaging. Brands use confectionery mixes and simpler formats for high volume retail rotations.
Insights into the Households End Use Segment
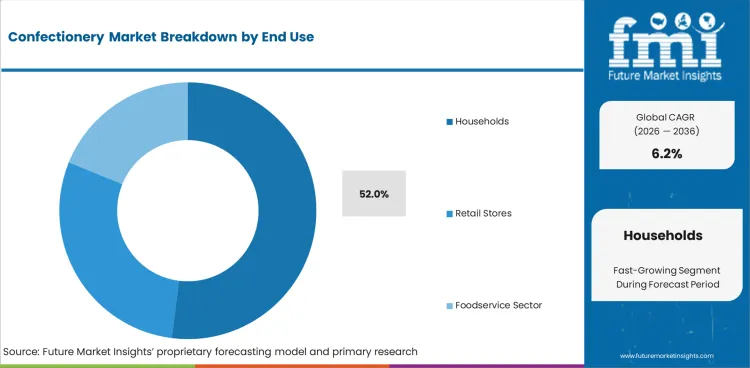
- Households is projected to account for 52.0% share in 2026. Households are projected to lead end use as family packs and multi packs support pantry stocking and small celebration use.
- Family buying is less tied to one occasion than gifting. This makes assortment depth and promotional price more important than premium claims.
Insights into the Supermarkets and Hypermarkets Distribution Channel Segment
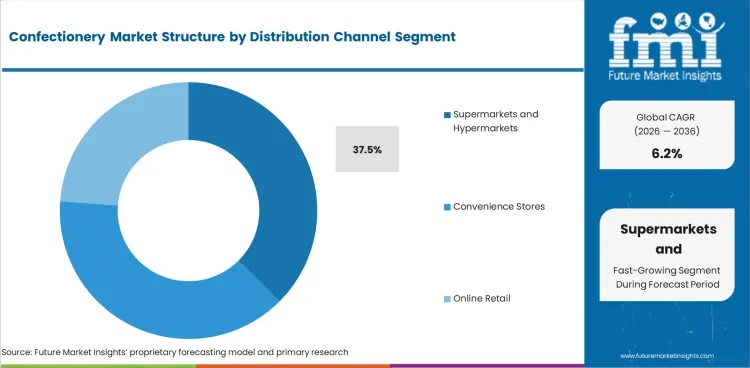
- Supermarkets and Hypermarkets is projected to account for 37.5% share in 2026. Supermarkets and Hypermarkets are forecast to lead channels as large stores control seasonal aisles and checkout displays.
- Retail planners use high visibility shelf space for bars, boxed chocolates and confectionery packaging formats that communicate value quickly.
Insights into the Cocoa Based Ingredient Type Segment
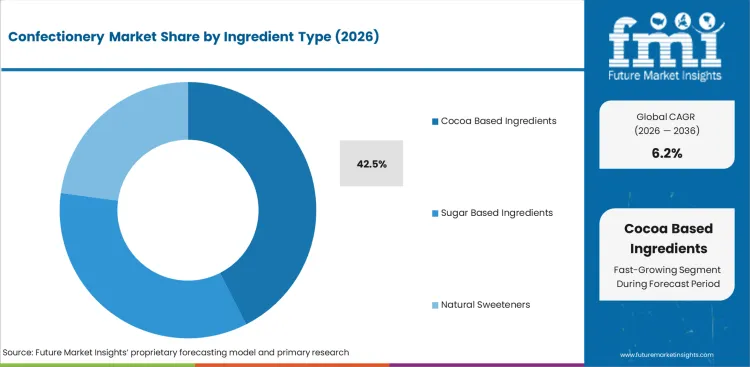
- Cocoa Based Ingredients is projected to account for 42.5% share in 2026. Cocoa Based Ingredients are estimated to lead ingredient type as chocolate confectionery holds the highest value share.
- Cocoa butter and cocoa solids influence mouthfeel directly. That makes cocoa butter substitution and compound coating choices visible to repeat buyers.
Confectionery Market Drivers, Restraints, and Opportunities
- Impulse pack economics drive daily purchase volume as small bars and candies remain affordable in mass retail.
- Cocoa price exposure restrains chocolate margins since bean costs affect fillings and coatings before retail price resets.
- Sugar reduction opens reformulation space where brands can position stevia and low calorie candy for label aware shoppers.
- Online gifting creates another sales route for premium assortments and seasonal boxes.
Cocoa cost pass-through
Chocolate confectionery growth depends on how brands manage cocoa cost without losing household buyers. ICCO estimated 2024 to 2025 global grindings at 4.60 million tonnes in November 2025. That decline signals weaker processing demand after high input costs squeezed margins. Manufacturers respond through pack weight control and value tiered formats. This keeps value growth positive but makes volume growth uneven across mature countries.
Added sugar label pressure
Sugar claims are becoming a product design issue for candy makers. The USA Food and Drug Administration stated in March 2026 that the Dietary Guidelines recommend limiting added sugars to below 10 percent of total calories. This rule context does not ban sweets. It makes sugar content easier to compare during routine shopping. Brands using stevia or smaller portions can defend shelf space where retailers promote better-for-you snack ranges.
Gift pack channel lift
Gifting creates value lift because buyers accept higher prices for boxes and premium assortments during holidays. Nestle UK added Quality Street Mixed Creme Pouch and other seasonal confectionery items in September 2024. Seasonal lines help retailers refresh displays without changing the core shelf plan. Suppliers that can supply short run packs and reliable fill weights gain better holiday visibility. This supports value growth in confectionery fillings and assorted chocolate formats.
Analysis of Confectionery Market By Key Countries
.webp "Top Country Growth Comparison Confectionery Market Cagr (2026 2036)")
| Country | CAGR 2026 to 2036 |
|---|---|
| India | 7.8% |
| China | 7.5% |
| Brazil | 6.5% |
| UK | 6.5% |
| Germany | 4.4% |
| Japan | 3.2% |
| United States | 3.1% |
Source: Future Market Insights analysis based on country confectionery demand signals and public source checks in 2026.

Country growth differs by retail maturity and household income spread. India and China are forecast above the global pace due to modern retail growth and higher branded candy access. Brazil and the UK are expected to grow near the global pace through food processing scale and seasonal purchase strength. Germany, Japan and the United States track below the global rate as mature buyers shift value through premium packs and chocolate flavors.
Demand Outlook for Confectionery in India
India is projected to record a 7.8% CAGR through 2036 as modern retail and urban snack packs widen branded confectionery access. USDA FAS valued India food processing at USD 389 billion in 2025. That food base gives candy producers broad distribution scope across grocery and small retail. Mondelez and Nestle use chocolate brands to reach premium and mass buyers. Local price sensitivity keeps small packs central to growth.
- Modern retail chains widen display access for bars and boxed chocolates in large Indian cities.
- Festival buying supports gift packs as consumers move from loose sweets toward packaged branded formats.
- Small pack pricing keeps chocolate confectionery accessible for students and daily snack buyers.
Sales Analysis of Confectionery in China
China is expected to expand at 7.5% CAGR through 2036 as premium gifting and fruit flavors support branded confectionery intake. USDA FAS reported China imported USD 7.1 billion of USA consumer-oriented products in 2024. This signal reflects a large retail system open to global food brands. Chocolate gifting and flavored sugar candy will keep value improving. Imported ingredient checks and local retail approvals affect launch speed.
- Tier one cities support premium chocolate boxes through gifting and modern retail displays.
- Fruit candy and gummies benefit from local flavor rotation across youth-oriented candy shelves.
- Domestic online platforms support brand discovery through seasonal packs and limited edition items.
Industry Analysis of Confectionery in Brazil
Brazil is forecast to grow at 6.5% CAGR through 2036 as a large food processing sector supports chocolate and candy manufacturing. USDA FAS placed Brazil food processing revenue at about USD 248 billion in 2025. That scale gives confectionery brands a strong local production and retail foundation. Price sensitive households favor family packs and sugar confectionery. Premium chocolate remains tied to urban income and gifting seasons.
- Domestic manufacturing depth supports national candy brands and regional flavor variants.
- Supermarkets use family packs to serve households seeking value during weekly grocery trips.
- Chocolate gifts benefit from middle income urban consumers during holidays and birthdays.
Opportunity Analysis of Confectionery in UK
UK confectionery sales are shaped by supermarket promotions and seasonal gifting. USDA FAS reported that the UK imported a record USD 3.8 billion in agriculture and related products from the United States in 2024. This import scale reflects a retail system open to branded food variety. UK is expected to advance at 6.5% CAGR through 2036 as seasonal boxes and chocolate couverture formats support value. Suppliers need strong promotion calendars and packaging compliance.
- London supermarkets support premium assortment rotation through high income shoppers and gifting aisles.
- Tesco and John Lewis seasonal displays influence boxed chocolate launches during Christmas trading periods.
- Scotland and Northern England support value pack demand through mainstream grocery and discount chains.
Demand Analysis of Confectionery in Germany
Germany is projected to rise at 4.4% CAGR through 2036 as mature chocolate consumption shifts toward premium and quality-led choices. USDA FAS reported German food retail sales of USD 293.1 billion in 2024. The retail base is large but price competition remains high. Discounters influence pack size and promotional cadence. Premium products need clear cocoa quality and origin cues to protect margins.
- Aldi and Lidl keep value pressure high across standard chocolate and candy lines.
- Premium chocolate buyers respond to origin claims and higher cocoa content in giftable formats.
- Imported consumer foods support assortment variety across supermarkets and specialty stores.
Sales Outlook for Confectionery in Japan
Japan is forecast at 3.2% CAGR through 2036 as mature convenience stores favor novelty packs and seasonal flavor runs. USDA FAS reported Japan food processing output valued at USD 174 billion in 2024. The country has deep processed food capability and a careful retail launch culture. Limited editions support repeat trials but older demographics constrain volume gains. Brands need precise pack design and flavor control.
- Convenience stores support small pack chocolate and gum through frequent shelf rotation.
- Seasonal flavors keep impulse buying active among younger urban consumers.
- Premium chocolate works best when product claims focus on taste and gifting refinement.
Industry Outlook for Confectionery in United States
The United States is expected to post 3.1% CAGR through 2036 as mature candy consumption shifts toward pack mix and label claims. USDA FAS reported USA confectionery exports of USD 812.01 million in 2025. This reflects a large confectionery production base serving nearby and global markets. Growth is slower due to high category maturity and sugar scrutiny. Premium chocolate and portion control create the main value routes.
- Convenience stores maintain checkout sales for single serve bars and gum packs.
- Food label reading supports smaller portions and sugar free candy alternatives.
- Holiday assortments keep boxed chocolate relevant across mainstream grocery and mass retail.
Competitive Landscape and Strategic Positioning
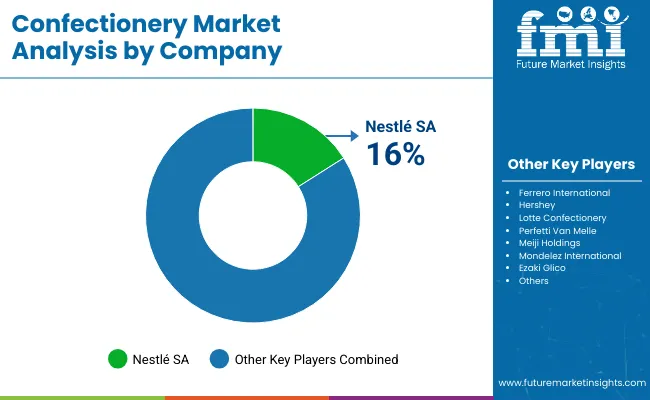
- Global competition is concentrated among companies with chocolate brands, retail access and seasonal pack execution.
- Mars Inc. is estimated to hold 13.5% share in 2026 as it spans chocolate, gum and sugar candy brands.
- Ferrero and Lindt defend premium price points through gifting formats and chocolate quality cues.
- Mondelez and Nestle use regional chocolate brands to balance volume reach and premium product trials.
Competitive strength in confectionery is built around brand trust and retail discipline. Mars announced an agreement to acquire Kellanova for USD 35.9 billion in August 2024. That move points to stronger snack aisle scale and broader retailer negotiation power. Mondelez signed a partnership with Lotus Bakeries in June 2024 to develop co-branded chocolate products. These moves show how large suppliers seek product adjacency and shelf control.
Chocolate specialists defend premium positions by controlling ingredients and experience. Lindt and Sprungli reported 2024 sales of CHF 5.47 billion and organic sales growth of 7.8 percent in its 2024 annual report. That shows premium chocolate held value even as cocoa costs rose. Ferrero and Lindt use assortment depth and gift formats to protect price points. Their approach supports chocolate inclusions and decorations and seasonal formats that move above routine candy pricing.
Sugar candy competitors move through novelty and price rotation. Perfetti Van Melle USA introduced Airheads Xtremes Very Berry and relaunched Bubblicious in May 2025. These launches show how gum and fruity candy brands rely on taste news and impulse display. Smaller brands can defend shelf space with targeted flavor formats. Their challenge is scaling distribution against Mars and Mondelez. Niche products such as licorice candy remain more dependent on loyal repeat buyers.
Key Companies in the Confectionery Market
Competition spans global chocolate makers, sugar candy groups and regional confectionery specialists. Companies compete through brands, pack architecture, retail access and ingredient management.
- Global branded suppliers: Mars Inc., Mondelez International, Nestle SA and Ferrero International S.A. hold broad confectionery portfolios.
- Premium chocolate specialists: Chocoladefabriken Lindt and Sprungli AG and Ferrero defend higher value gift formats.
- Sugar candy and gum specialists: Perfetti Van Melle Group B.V. and Lotte Wellfood compete through fruity candy, gum and Asian retail access.
Competitive Benchmarking: Confectionery Market
| Company | Chocolate Brand Depth | Seasonal Pack Execution | Retail Shelf Access | Footprint |
|---|---|---|---|---|
| Mars Inc. | High | High | High | Global |
| Ferrero International S.A. | High | High | High | Global |
| Mondelez International, Inc. | High | Moderate | High | Global |
| Nestle SA | Moderate | High | High | Global |
| The Hershey Company | High | High | High | North America |
| Lotte Wellfood | Moderate | Moderate | High | East Asia |
| Perfetti Van Melle Group B.V. | Moderate | Moderate | High | Global |
| Lindt and Sprungli AG | High | High | Moderate | Global |
Key Developments in the Confectionery Market
- In June 2024, Mondelez International announced a co branded chocolate partnership with Lotus Bakeries.
- In January 2024, Nestle launched KitKat Breaks for Good using cocoa sourced from income accelerator farms.
- In September 2024, Nestle UK added Quality Street seasonal products ahead of the Christmas period.
- In May 2024, Ferrero introduced Tic Tac Chewy at the Sweets and Snacks Expo.
- In May 2025, Perfetti Van Melle USA launched Airheads Xtremes Very Berry and relaunched Bubblicious.
Key Players in the Confectionery Market
- Mars Inc.
- Ferrero International S.A.
- Nestle SA
- The Hershey Company
- Lotte Wellfood
- Perfetti Van Melle Group B.V.
- Mondelez International, Inc.
- Chocoladefabriken Lindt and Sprungli AG
Scope of the Report
| Item | Value |
|---|---|
| Quantitative Units | USD Billion and CAGR from 2026 to 2036 |
| Market Definition | Packaged chocolate sweets, sugar candy, gum products and novelty confectionery |
| Product Type | Chocolate confectionery, Sugar Confectionery, Gum Confectionery, Bakery Confectionery, Frozen and Novelty Confectionery |
| Flavor | Fruits, Nuts, Chocolate, Vanilla, Coffee, Mint and peppermint, Others |
| Application | Everyday Consumption, Gifting, Celebrations and Events, Health and Wellness, Foodservice and Hospitality |
| End Use | Households, Retail Stores, Foodservice Sector, Corporate Sector |
| Distribution Channel | Supermarkets and Hypermarkets, Convenience Stores, Online Retail, Specialty Stores, Travel Retail, Vending Machines |
| Ingredient Type | Cocoa Based Ingredients, Sugar Based Ingredients, Natural Sweeteners, Flavoring Ingredients, Inclusions and Additives |
| Regions Covered | North America, Latin America, Europe, East Asia, South Asia and Pacific, Middle East and Africa |
| Countries Covered | India, China, Brazil, UK, Germany, Japan, United States |
| Key Companies Profiled | Mars Inc., Ferrero International S.A., Nestle SA, The Hershey Company, Lotte Wellfood, Perfetti Van Melle Group B.V., Mondelez International, Inc., Lindt and Sprungli AG |
| Forecast Period | 2026 to 2036 |
| Approach | FMI analysis using provided market anchors, public source checks and segment share review |
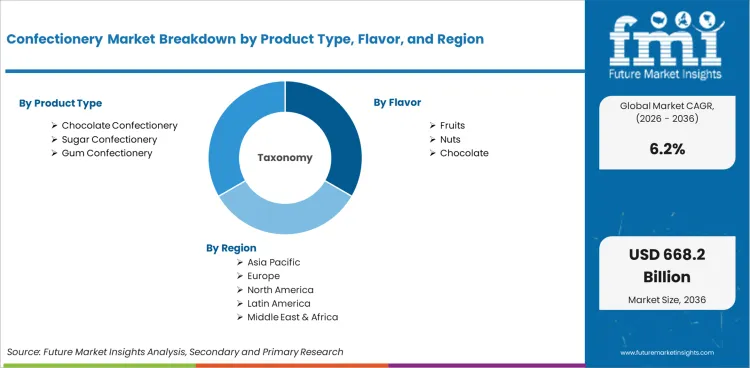
Confectionery Market Breakdown by Product Type, Flavor, Application, End Use, Distribution Channel, Ingredient Type, and Region
Confectionery Market Segmented by Product Type
- Chocolate confectionery
- Sugar Confectionery
- Gum Confectionery
- Bakery Confectionery
- Frozen and Novelty Confectionery
Confectionery Market Segmented by Flavor
- Fruits
- Nuts
- Chocolate
- Vanilla
- Coffee
- Mint and peppermint
- Others
Confectionery Market Segmented by Application
- Everyday Consumption
- Gifting
- Celebrations and Events
- Health and Wellness
- Foodservice and Hospitality
Confectionery Market Segmented by End Use
- Households
- Retail Stores
- Foodservice Sector
- Corporate Sector
Confectionery Market Segmented by Distribution Channel
- Supermarkets and Hypermarkets
- Convenience Stores
- Online Retail
- Specialty Stores
- Travel Retail
- Vending Machines
Confectionery Market Segmented by Ingredient Type
- Cocoa Based Ingredients
- Sugar Based Ingredients
- Natural Sweeteners
- Flavoring Ingredients
- Inclusions and Additives
Confectionery Market by Region
- North America
- United States
- Canada
- Latin America
- Brazil
- Mexico
- Europe
- Germany
- United Kingdom
- France
- Italy
- Spain
- East Asia
- China
- Japan
- South Korea
- South Asia and Pacific
- India
- ASEAN
- Australia and New Zealand
- Middle East and Africa
- Saudi Arabia
- Other GCC Countries
- South Africa
Research Sources and Bibliography
- USDA Foreign Agricultural Service. (2026). Confectionery exports.
- USDA Foreign Agricultural Service. (2026, March 27). India: Food Processing Ingredients Annual.
- USDA Foreign Agricultural Service. (2025, July 3). China: Exporter Guide Annual.
- USDA Foreign Agricultural Service. (2026, March 31). Brazil: Food Processing Ingredients Annual.
- International Cocoa Organization. (2025, May 30). Cocoa year 2024/25: Grindings of cocoa beans.
- USA Food and Drug Administration. (2026, March 4). Added Sugars on the Nutrition Facts Label.
- European Commission. (2024, May 23). Antitrust: Commission fines Mondelez for cross-border trade restrictions
- Mars Incorporated. (2024, August 14). Mars to acquire Kellanova.
- Mars Incorporated. (2025, September 30). Cocoa for Generations 2024 Progress Report.
- The Hershey Company. (2024, May 13). Hershey introduces new products at Sweets and Snacks Expo.
- Mondelez International. (2024, June 13). Mondelez International and Lotus Bakeries announce partnership.
- Nestle. (2024, January 19). KitKat Breaks for Good.
- Nestle UK. (2024, September 23). Quality Street Christmas 2024 range.
- Ferrero North America. (2024, May 13). Ferrero North America introduces new products at the Sweets and Snacks Expo.
- Perfetti Van Melle USA. (2025, May 6). Perfetti Van Melle USA launches new candy products.
- Lotte Wellfood. (2025). Sustainability Report 2024.
- Chocoladefabriken Lindt and Sprungli AG. (2025). Annual Report 2024.
The bibliography is provided for reader reference and direct source checking.
This Report Answers
- How large the confectionery sector is in 2026 and how far it can rise by 2036?
- Which product type and flavor hold the strongest projected share positions in 2026?
- Why chocolate confectionery and fruits hold the clearest leading positions in current confectionery use?
- Why India and China lead the country forecast set through 2036?
- How supermarkets and hypermarkets shape access for chocolate and sugar candy brands?
- Which supplier capabilities help companies defend position in chocolate depth and retail shelf access?
- What cocoa and retail signals support the forecast method used in this study?
Frequently Asked Questions
How large is the Confectionery Market in 2026?
The Confectionery Market is projected at USD 344.8 billion in 2026 with chocolate and sugar candy supporting packaged snack value.
What will the Confectionery Market be worth by 2036?
The Confectionery Market is forecast to reach USD 629.3 billion by 2036 as everyday packs and gifting formats expand value.
What CAGR is projected for the Confectionery Market from 2026 to 2036?
The Confectionery Market is expected to expand at 6.2% CAGR from 2026 to 2036 across packaged chocolate and candy uses.
Which product type leads the Confectionery Market?
Chocolate confectionery is projected to account for 42.0% share in 2026 as bars, blocks and molded chocolates hold strong display space.
Which country grows fastest in the Confectionery Market?
India is projected to record 7.8% CAGR through 2036 as modern retail and urban snack packs widen branded confectionery access.
What is the difference between chocolate confectionery and sugar confectionery?
Chocolate confectionery uses cocoa based ingredients and usually sells at higher prices. Sugar confectionery relies more on sugar, fruit flavors and texture formats.
How do supermarkets affect the Confectionery Market?
Supermarkets shape confectionery sales through shelf space, checkout placement and seasonal promotions that make candy visible during routine grocery trips.
Why are sugar free candy and low calorie chocolate important?
Sugar free candy and low calorie chocolate are important because label reading pushes brands to offer smaller portions and sweetener-based alternatives.
Preview the report firsthand - request a free sample
Get SampleGet the brochure for pricing and purchase details.
Get PDFTable of Content
- Executive Summary
- Global Market Outlook
- Demand-side Trends
- Supply-side Trends
- Technology Roadmap Analysis
- Analysis and Recommendations
- Market Overview
- Market Coverage / Taxonomy
- Market Definition / Scope / Limitations
- Research Methodology
- Chapter Orientation
- Analytical Lens and Working Hypotheses
- Market Structure, Signals, and Trend Drivers
- Benchmarking and Cross-market Comparability
- Market Sizing, Forecasting, and Opportunity Mapping
- Research Design and Evidence Framework
- Desk Research Programme (Secondary Evidence)
- Company Annual and Sustainability Reports
- Peer-reviewed Journals and Academic Literature
- Corporate Websites, Product Literature, and Technical Notes
- Earnings Decks and Investor Briefings
- Statutory Filings and Regulatory Disclosures
- Technical White Papers and Standards Notes
- Trade Journals, Industry Magazines, and Analyst Briefs
- Conference Proceedings, Webinars, and Seminar Materials
- Government Statistics Portals and Public Data Releases
- Press Releases and Reputable Media Coverage
- Specialist Newsletters and Curated Briefings
- Sector Databases and Reference Repositories
- FMI Internal Proprietary Databases and Historical Market Datasets
- Subscription Datasets and Paid Sources
- Social Channels, Communities, and Digital Listening Inputs
- Additional Desk Sources
- Expert Input and Fieldwork (Primary Evidence)
- Primary Modes
- Qualitative Interviews and Expert Elicitation
- Quantitative Surveys and Structured Data Capture
- Blended Approach
- Why Primary Evidence is Used
- Field Techniques
- Interviews
- Surveys
- Focus Groups
- Observational and In-context Research
- Social and Community Interactions
- Stakeholder Universe Engaged
- C-suite Leaders
- Board Members
- Presidents and Vice Presidents
- R&D and Innovation Heads
- Technical Specialists
- Domain Subject-matter Experts
- Scientists
- Physicians and Other Healthcare Professionals
- Governance, Ethics, and Data Stewardship
- Research Ethics
- Data Integrity and Handling
- Primary Modes
- Tooling, Models, and Reference Databases
- Desk Research Programme (Secondary Evidence)
- Data Engineering and Model Build
- Data Acquisition and Ingestion
- Cleaning, Normalisation, and Verification
- Synthesis, Triangulation, and Analysis
- Quality Assurance and Audit Trail
- Market Background
- Market Dynamics
- Drivers
- Restraints
- Opportunity
- Trends
- Scenario Forecast
- Demand in Optimistic Scenario
- Demand in Likely Scenario
- Demand in Conservative Scenario
- Opportunity Map Analysis
- Product Life Cycle Analysis
- Supply Chain Analysis
- Investment Feasibility Matrix
- Value Chain Analysis
- PESTLE and Porter’s Analysis
- Regulatory Landscape
- Regional Parent Market Outlook
- Production and Consumption Statistics
- Import and Export Statistics
- Market Dynamics
- Global Market Analysis 2021 to 2025 and Forecast, 2026 to 2036
- Historical Market Size Value (USD Million) Analysis, 2021 to 2025
- Current and Future Market Size Value (USD Million) Projections, 2026 to 2036
- Y-o-Y Growth Trend Analysis
- Absolute $ Opportunity Analysis
- Global Market Pricing Analysis 2021 to 2025 and Forecast 2026 to 2036
- Global Market Analysis 2021 to 2025 and Forecast 2026 to 2036, By Product Type
- Introduction / Key Findings
- Historical Market Size Value (USD Million) Analysis By Product Type , 2021 to 2025
- Current and Future Market Size Value (USD Million) Analysis and Forecast By Product Type , 2026 to 2036
- Chocolate Confectionery
- Sugar Confectionery
- Gum Confectionery
- Chocolate Confectionery
- Y-o-Y Growth Trend Analysis By Product Type , 2021 to 2025
- Absolute $ Opportunity Analysis By Product Type , 2026 to 2036
- Global Market Analysis 2021 to 2025 and Forecast 2026 to 2036, By Flavor
- Introduction / Key Findings
- Historical Market Size Value (USD Million) Analysis By Flavor, 2021 to 2025
- Current and Future Market Size Value (USD Million) Analysis and Forecast By Flavor, 2026 to 2036
- Fruits
- Nuts
- Chocolate
- Fruits
- Y-o-Y Growth Trend Analysis By Flavor, 2021 to 2025
- Absolute $ Opportunity Analysis By Flavor, 2026 to 2036
- Global Market Analysis 2021 to 2025 and Forecast 2026 to 2036, By Application
- Introduction / Key Findings
- Historical Market Size Value (USD Million) Analysis By Application, 2021 to 2025
- Current and Future Market Size Value (USD Million) Analysis and Forecast By Application, 2026 to 2036
- Everyday Consumption
- Gifting
- Health and Wellness
- Everyday Consumption
- Y-o-Y Growth Trend Analysis By Application, 2021 to 2025
- Absolute $ Opportunity Analysis By Application, 2026 to 2036
- Global Market Analysis 2021 to 2025 and Forecast 2026 to 2036, By End Use
- Introduction / Key Findings
- Historical Market Size Value (USD Million) Analysis By End Use, 2021 to 2025
- Current and Future Market Size Value (USD Million) Analysis and Forecast By End Use, 2026 to 2036
- Households
- Retail Stores
- Foodservice Sector
- Households
- Y-o-Y Growth Trend Analysis By End Use, 2021 to 2025
- Absolute $ Opportunity Analysis By End Use, 2026 to 2036
- Global Market Analysis 2021 to 2025 and Forecast 2026 to 2036, By Distribution Channel
- Introduction / Key Findings
- Historical Market Size Value (USD Million) Analysis By Distribution Channel, 2021 to 2025
- Current and Future Market Size Value (USD Million) Analysis and Forecast By Distribution Channel, 2026 to 2036
- Supermarkets and Hypermarkets
- Convenience Stores
- Online Retail
- Supermarkets and Hypermarkets
- Y-o-Y Growth Trend Analysis By Distribution Channel, 2021 to 2025
- Absolute $ Opportunity Analysis By Distribution Channel, 2026 to 2036
- Global Market Analysis 2021 to 2025 and Forecast 2026 to 2036, By Ingredient Type
- Introduction / Key Findings
- Historical Market Size Value (USD Million) Analysis By Ingredient Type, 2021 to 2025
- Current and Future Market Size Value (USD Million) Analysis and Forecast By Ingredient Type, 2026 to 2036
- Cocoa Based Ingredients
- Sugar Based Ingredients
- Natural Sweeteners
- Cocoa Based Ingredients
- Y-o-Y Growth Trend Analysis By Ingredient Type, 2021 to 2025
- Absolute $ Opportunity Analysis By Ingredient Type, 2026 to 2036
- Global Market Analysis 2021 to 2025 and Forecast 2026 to 2036, By Region
- Introduction
- Historical Market Size Value (USD Million) Analysis By Region, 2021 to 2025
- Current Market Size Value (USD Million) Analysis and Forecast By Region, 2026 to 2036
- North America
- Latin America
- Western Europe
- Eastern Europe
- East Asia
- South Asia and Pacific
- Middle East & Africa
- Market Attractiveness Analysis By Region
- North America Market Analysis 2021 to 2025 and Forecast 2026 to 2036, By Country
- Historical Market Size Value (USD Million) Trend Analysis By Market Taxonomy, 2021 to 2025
- Market Size Value (USD Million) Forecast By Market Taxonomy, 2026 to 2036
- By Country
- USA
- Canada
- Mexico
- By Product Type
- By Flavor
- By Application
- By End Use
- By Distribution Channel
- By Ingredient Type
- By Country
- Market Attractiveness Analysis
- By Country
- By Product Type
- By Flavor
- By Application
- By End Use
- By Distribution Channel
- By Ingredient Type
- Key Takeaways
- Latin America Market Analysis 2021 to 2025 and Forecast 2026 to 2036, By Country
- Historical Market Size Value (USD Million) Trend Analysis By Market Taxonomy, 2021 to 2025
- Market Size Value (USD Million) Forecast By Market Taxonomy, 2026 to 2036
- By Country
- Brazil
- Chile
- Rest of Latin America
- By Product Type
- By Flavor
- By Application
- By End Use
- By Distribution Channel
- By Ingredient Type
- By Country
- Market Attractiveness Analysis
- By Country
- By Product Type
- By Flavor
- By Application
- By End Use
- By Distribution Channel
- By Ingredient Type
- Key Takeaways
- Western Europe Market Analysis 2021 to 2025 and Forecast 2026 to 2036, By Country
- Historical Market Size Value (USD Million) Trend Analysis By Market Taxonomy, 2021 to 2025
- Market Size Value (USD Million) Forecast By Market Taxonomy, 2026 to 2036
- By Country
- Germany
- UK
- Italy
- Spain
- France
- Nordic
- BENELUX
- Rest of Western Europe
- By Product Type
- By Flavor
- By Application
- By End Use
- By Distribution Channel
- By Ingredient Type
- By Country
- Market Attractiveness Analysis
- By Country
- By Product Type
- By Flavor
- By Application
- By End Use
- By Distribution Channel
- By Ingredient Type
- Key Takeaways
- Eastern Europe Market Analysis 2021 to 2025 and Forecast 2026 to 2036, By Country
- Historical Market Size Value (USD Million) Trend Analysis By Market Taxonomy, 2021 to 2025
- Market Size Value (USD Million) Forecast By Market Taxonomy, 2026 to 2036
- By Country
- Russia
- Poland
- Hungary
- Balkan & Baltic
- Rest of Eastern Europe
- By Product Type
- By Flavor
- By Application
- By End Use
- By Distribution Channel
- By Ingredient Type
- By Country
- Market Attractiveness Analysis
- By Country
- By Product Type
- By Flavor
- By Application
- By End Use
- By Distribution Channel
- By Ingredient Type
- Key Takeaways
- East Asia Market Analysis 2021 to 2025 and Forecast 2026 to 2036, By Country
- Historical Market Size Value (USD Million) Trend Analysis By Market Taxonomy, 2021 to 2025
- Market Size Value (USD Million) Forecast By Market Taxonomy, 2026 to 2036
- By Country
- China
- Japan
- South Korea
- By Product Type
- By Flavor
- By Application
- By End Use
- By Distribution Channel
- By Ingredient Type
- By Country
- Market Attractiveness Analysis
- By Country
- By Product Type
- By Flavor
- By Application
- By End Use
- By Distribution Channel
- By Ingredient Type
- Key Takeaways
- South Asia and Pacific Market Analysis 2021 to 2025 and Forecast 2026 to 2036, By Country
- Historical Market Size Value (USD Million) Trend Analysis By Market Taxonomy, 2021 to 2025
- Market Size Value (USD Million) Forecast By Market Taxonomy, 2026 to 2036
- By Country
- India
- ASEAN
- Australia & New Zealand
- Rest of South Asia and Pacific
- By Product Type
- By Flavor
- By Application
- By End Use
- By Distribution Channel
- By Ingredient Type
- By Country
- Market Attractiveness Analysis
- By Country
- By Product Type
- By Flavor
- By Application
- By End Use
- By Distribution Channel
- By Ingredient Type
- Key Takeaways
- Middle East & Africa Market Analysis 2021 to 2025 and Forecast 2026 to 2036, By Country
- Historical Market Size Value (USD Million) Trend Analysis By Market Taxonomy, 2021 to 2025
- Market Size Value (USD Million) Forecast By Market Taxonomy, 2026 to 2036
- By Country
- Kingdom of Saudi Arabia
- Other GCC Countries
- Turkiye
- South Africa
- Other African Union
- Rest of Middle East & Africa
- By Product Type
- By Flavor
- By Application
- By End Use
- By Distribution Channel
- By Ingredient Type
- By Country
- Market Attractiveness Analysis
- By Country
- By Product Type
- By Flavor
- By Application
- By End Use
- By Distribution Channel
- By Ingredient Type
- Key Takeaways
- Key Countries Market Analysis
- USA
- Pricing Analysis
- Market Share Analysis, 2025
- By Product Type
- By Flavor
- By Application
- By End Use
- By Distribution Channel
- By Ingredient Type
- Canada
- Pricing Analysis
- Market Share Analysis, 2025
- By Product Type
- By Flavor
- By Application
- By End Use
- By Distribution Channel
- By Ingredient Type
- Mexico
- Pricing Analysis
- Market Share Analysis, 2025
- By Product Type
- By Flavor
- By Application
- By End Use
- By Distribution Channel
- By Ingredient Type
- Brazil
- Pricing Analysis
- Market Share Analysis, 2025
- By Product Type
- By Flavor
- By Application
- By End Use
- By Distribution Channel
- By Ingredient Type
- Chile
- Pricing Analysis
- Market Share Analysis, 2025
- By Product Type
- By Flavor
- By Application
- By End Use
- By Distribution Channel
- By Ingredient Type
- Germany
- Pricing Analysis
- Market Share Analysis, 2025
- By Product Type
- By Flavor
- By Application
- By End Use
- By Distribution Channel
- By Ingredient Type
- UK
- Pricing Analysis
- Market Share Analysis, 2025
- By Product Type
- By Flavor
- By Application
- By End Use
- By Distribution Channel
- By Ingredient Type
- Italy
- Pricing Analysis
- Market Share Analysis, 2025
- By Product Type
- By Flavor
- By Application
- By End Use
- By Distribution Channel
- By Ingredient Type
- Spain
- Pricing Analysis
- Market Share Analysis, 2025
- By Product Type
- By Flavor
- By Application
- By End Use
- By Distribution Channel
- By Ingredient Type
- France
- Pricing Analysis
- Market Share Analysis, 2025
- By Product Type
- By Flavor
- By Application
- By End Use
- By Distribution Channel
- By Ingredient Type
- India
- Pricing Analysis
- Market Share Analysis, 2025
- By Product Type
- By Flavor
- By Application
- By End Use
- By Distribution Channel
- By Ingredient Type
- ASEAN
- Pricing Analysis
- Market Share Analysis, 2025
- By Product Type
- By Flavor
- By Application
- By End Use
- By Distribution Channel
- By Ingredient Type
- Australia & New Zealand
- Pricing Analysis
- Market Share Analysis, 2025
- By Product Type
- By Flavor
- By Application
- By End Use
- By Distribution Channel
- By Ingredient Type
- China
- Pricing Analysis
- Market Share Analysis, 2025
- By Product Type
- By Flavor
- By Application
- By End Use
- By Distribution Channel
- By Ingredient Type
- Japan
- Pricing Analysis
- Market Share Analysis, 2025
- By Product Type
- By Flavor
- By Application
- By End Use
- By Distribution Channel
- By Ingredient Type
- South Korea
- Pricing Analysis
- Market Share Analysis, 2025
- By Product Type
- By Flavor
- By Application
- By End Use
- By Distribution Channel
- By Ingredient Type
- Russia
- Pricing Analysis
- Market Share Analysis, 2025
- By Product Type
- By Flavor
- By Application
- By End Use
- By Distribution Channel
- By Ingredient Type
- Poland
- Pricing Analysis
- Market Share Analysis, 2025
- By Product Type
- By Flavor
- By Application
- By End Use
- By Distribution Channel
- By Ingredient Type
- Hungary
- Pricing Analysis
- Market Share Analysis, 2025
- By Product Type
- By Flavor
- By Application
- By End Use
- By Distribution Channel
- By Ingredient Type
- Kingdom of Saudi Arabia
- Pricing Analysis
- Market Share Analysis, 2025
- By Product Type
- By Flavor
- By Application
- By End Use
- By Distribution Channel
- By Ingredient Type
- Turkiye
- Pricing Analysis
- Market Share Analysis, 2025
- By Product Type
- By Flavor
- By Application
- By End Use
- By Distribution Channel
- By Ingredient Type
- South Africa
- Pricing Analysis
- Market Share Analysis, 2025
- By Product Type
- By Flavor
- By Application
- By End Use
- By Distribution Channel
- By Ingredient Type
- USA
- Market Structure Analysis
- Competition Dashboard
- Competition Benchmarking
- Market Share Analysis of Top Players
- By Regional
- By Product Type
- By Flavor
- By Application
- By End Use
- By Distribution Channel
- By Ingredient Type
- Competition Analysis
- Competition Deep Dive
- Mars Inc.
- Overview
- Product Portfolio
- Profitability by Market Segments (Product/Age /Sales Channel/Region)
- Sales Footprint
- Strategy Overview
- Marketing Strategy
- Product Strategy
- Channel Strategy
- Ferrero International S.A.
- Nestle SA
- The Hershey Company
- Lotte Wellfood
- Perfetti Van Melle Group B.V.
- Mars Inc.
- Competition Deep Dive
- Assumptions & Acronyms Used


