Audiometer Calibration Equipment Market Forecast and Outlook (2025–2035)

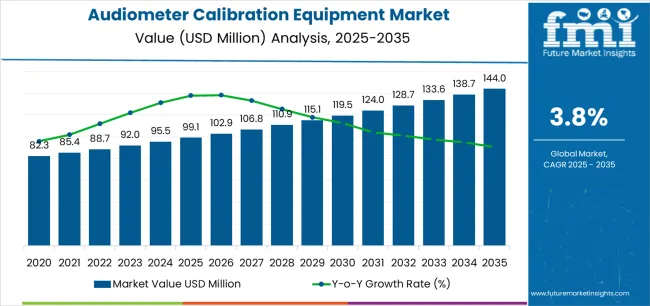
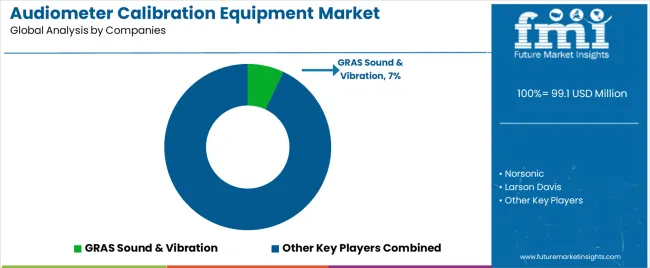
The global audiometer calibration equipment market is expected to be valued at USD 99.1 million in 2025 and reach USD 144.0 million by 2035, registering a CAGR of 3.8%. The rolling CAGR evaluations suggest steady momentum over the decade, supported by consistent upgrades to diagnostic systems and enforcement of international calibration standards in hearing assessment environments. Expansion in hospital audiology units, occupational testing programs, and educational screening centers continues to reinforce baseline demand.

Product development emphasizes integration, portability, and automation. Modern calibration units combine compact hardware with digital interfaces, allowing faster adjustment verification and reduced operator dependency. The inclusion of remote monitoring functions is broadening the practical utility of these systems for multi-site healthcare networks. Manufacturers are also aligning their designs with ISO and ANSI frameworks to ensure traceability across service operations.

Regional trends indicate sustained purchasing activity in North America and Europe, where compliance cycles and accreditation requirements drive predictable replacement demand. Growth in Asia Pacific is more incremental but reflects steady investments in clinical training and local calibration services.
Quick Stats for the Audiometer Calibration Equipment Market

  • Audiometer Calibration Equipment Market Value (2025): USD 99.1 million
  • Audiometer Calibration Equipment Market Forecast Value (2035): USD 144.0 million
  • Audiometer Calibration Equipment Market Forecast CAGR (2025 to 2035): 3.8%
  • Leading Type in Audiometer Calibration Equipment Market: Analog Signal
  • Key Growth Regions: East Asia, Europe, and North America
  • Top Players: GRAS Sound & Vibration, Norsonic, Larson Davis, Aussco, Kiversal, Brüel & Kjær, Tremetrics, Grason-Stadler, Benson Medical, Hangzhou AIHUA Instruments Co., Ltd., Listen, Inc., NTi Audio, Precision Acoustics, PCB Piezotronics, Svantek, Frye Electronics, Rion Co., Ltd.

Audiometer Calibration Equipment Market Market Value Analysis

Audiometer Calibration Equipment Market Year-over-Year Forecast (2025–2035)

Between 2025 and 2030, the Audiometer Calibration Equipment Market is projected to grow from USD 99.1 million to USD 115.1 million, representing a growth of 16.2% and accounting for 45.7% of the total market expansion expected over the decade. This period will be driven by the increasing emphasis on audiometric accuracy, stringent calibration standards, and expanding adoption of digital calibration systems across audiology clinics and hospitals. The development of automated verification technologies, improved noise measurement precision, and enhanced portability will support efficiency and compliance. Key industry players will focus on integrating advanced software platforms to ensure consistent, real-time calibration results.

From 2030 to 2035, the market is forecast to rise from USD 115.1 million to USD 144.0 million, registering a 25.1% increase and contributing 54.3% of the decade’s total growth. This stage will see a shift toward smart, AI-enabled calibration device that leverage cloud-based data analytics for performance monitoring and predictive maintenance. Growing demand from occupational health sectors, research laboratories, and mobile audiology units will expand market reach. Continuous advancements in acoustic reference standards and international certification protocols will drive adoption, reinforcing product reliability and operational efficiency across global audiology and hearing assessment environments.

Audiometer Calibration Equipment Market Key Takeaways

Metric Value
Market Value (2025) USD 99.1 million
Market Forecast Value (2035) USD 144.0 million
Forecast CAGR (2025–2035) 3.8%

How Is Technological Precision Influencing the Growth of the Audiometer Calibration Equipment Market?

The audiometer calibration equipment market is growing as hearing assessment standards tighten and medical facilities prioritize traceable, high-accuracy testing instruments. Audiometers used in clinical diagnostics, research laboratories, and occupational hearing programs require periodic calibration to ensure consistent performance and compliance with international standards such as IEC 60645 and ANSI S3.6. Calibration equipment capable of delivering controlled acoustic signals and automated verification processes allows service providers to maintain device reliability and patient testing accuracy.

Manufacturers are introducing digital and portable calibration systems that incorporate microprocessor controls, self-diagnostic software, and integrated sound level analysis. These advancements reduce human error and enable faster calibration cycles for multiple audiometer types. Increased investment in audiology infrastructure, particularly across hospital networks and government-supported screening initiatives, contributes to steady product demand. The growing prevalence of age-related and noise-induced hearing loss underscores the need for consistent calibration in both preventive and diagnostic settings. Despite rising adoption, cost and maintenance challenges restrict access to advanced calibration units in smaller practices and low-resource regions. Nonetheless, regulatory pressure to maintain calibrated equipment and the emergence of compact, network-compatible calibration tools continue to define market growth across healthcare, military, and occupational testing environments.

How Is the Audiometer Calibration Equipment Market Segmented by Classification, Application, and Region?

The audiometer calibration equipment market is segmented by classification, application, and region. By classification, the market is divided into analog signal and digital integration systems. Based on application, it is categorized into field calibration and maintenance, hospital and clinical audiology, and others. Regionally, the market is segmented into North America, Europe, East Asia, South Asia, Latin America, and the Middle East & Africa. These segments collectively define global distribution and usage trends across institutional and service-based calibration operations.
By Classification, Which Segment Leads the Audiometer Calibration Equipment Market?

Audiometer Calibration Equipment Market Analysis By Classification

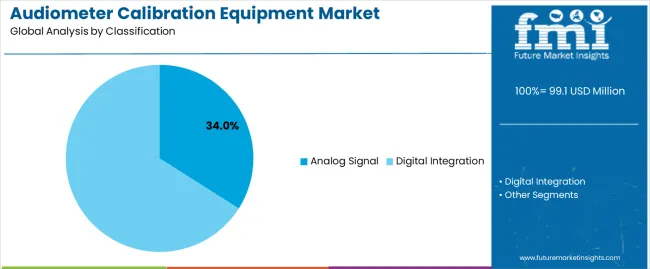
The analog signal segment accounts for approximately 34.0% of the global audiometer calibration equipment market in 2025, representing the leading classification category. This dominance reflects its continued utility across established clinical environments and field-based calibration programs where analog audiometers remain in service. Analog calibration systems provide reliable performance, simplified configuration, and minimal maintenance requirements, supporting consistent measurement results across varied operating conditions.

Their use remains widespread in diagnostic centers, mobile testing units, and calibration laboratories prioritizing stability and cost efficiency over advanced digital features. Analog equipment offers compatibility with long-standing audiometer models, ensuring continuity of use without extensive system upgrades. Manufacturers continue to supply analog solutions aligned with international calibration standards, maintaining their relevance in both public health and industrial hearing assessment contexts. While digital integration technologies are expanding due to enhanced automation and data management capabilities, analog systems sustain strong adoption in resource-constrained markets and service operations requiring durable, field-ready calibration tools. This segment’s reliability and operational simplicity underpin its ongoing dominance within the global calibration equipment landscape.
By Application, Which Segment Dominates Market Demand?

Audiometer Calibration Equipment Market Analysis By Application

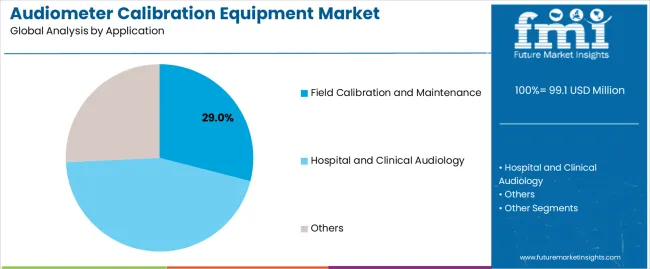
The field calibration and maintenance segment represents about 29.0% of the total audiometer calibration equipment market in 2025, making it the leading application category. Its prominence is driven by the rising need for portable calibration systems that ensure device accuracy outside permanent laboratory settings. Field calibration activities are essential to maintain performance standards for audiometers used in occupational health, education, and community hearing programs.

Portable calibration systems enable compliance with established international standards such as ISO 8253 and ANSI S3.6, facilitating regular verification with minimal downtime. The segment benefits from growing demand among mobile service providers and regional testing organizations conducting large-scale hearing assessments. As regulatory emphasis on traceable calibration and quality assurance increases, institutions invest in compact and efficient devices designed for routine field use. The versatility and ease of deployment of these systems contribute to stable global adoption, particularly across North America and Europe, where preventive maintenance programs are well established. The field calibration and maintenance segment remains central to market demand, supporting consistent audiometric performance verification across public health and clinical environments worldwide.

What are the Key Trends, Drivers, and Restraints in the Audiometer Calibration Equipment Market?

The audiometer calibration equipment market is expanding as clinics, hospitals, and occupational-health providers increase use of audiometry devices and must ensure measurement accuracy. Growing prevalence of hearing impairment, stricter regulatory requirements for audiometric testing and rising demand for mobile and remote diagnostics support market growth. On the other hand, high equipment cost, need for skilled operators and variable infrastructure in lower-income regions restrain adoption. The market is trending toward automated calibration systems, portable units and digital connectivity, allowing easier deployment in field, industrial and tele-audiology contexts.

What factor is driving growth in the audiometer calibration equipment market?

One major driver is the combination of increased hearing-loss incidence and regulatory mandates for audiometric testing and equipment calibration. Healthcare facilities treating age-related hearing disorder, noise-induced hearing loss or newborn screening use audiometers that must be regularly calibrated to maintain accuracy. Industrial workplaces monitoring employee hearing under noise-exposure rules also demand calibrated audiometric equipment. This upstream demand for calibrated devices ensures calibration-equipment uptake. Additionally, as audiometry moves to portable and remote formats, calibration systems become necessary across new settings further increasing market volume.

What restraints are limiting market expansion?

High initial cost and operational complexity restrict broader adoption of audiometer calibration equipment. Advanced calibration systems often require precision components, certified labs or trained technicians, raising total cost of ownership. Smaller clinics or sites in developing regions may lack budgets, technical staff or supporting infrastructure. Furthermore, competition from basic or less-frequently calibrated devices reduces perceived urgency among some users. These conditions slow penetration in cost-sensitive or under-resourced markets despite strong underlying demand for accurate audiometry.

What key trends are shaping future market development in the audiometer calibration equipment space?

A key trend is the shift toward automation, portability and digital connectivity in calibration systems. Manufacturers are offering calibration units with automated test-routines, cloud-based tracking of calibration history and portable field-kits for on-site use. These developments support mobile audiometry, remote clinics and industrial health-monitoring programs. Modular calibration systems and service-based models (for example, calibration as a managed service) are also emerging. As remote hearing-care and tele-audiology grow, calibration equipment that supports these models is increasingly in demand.
What is the Analysis of the Audiometer Calibration Equipment Market by Key Country?

Audiometer Calibration Equipment Market Cagr Analysis By Country

Country CAGR (%)
China 5.1%
India 4.8%
Germany 4.4%
Brazil 4.0%
USA 3.6%
UK 3.2%
Japan 2.9%

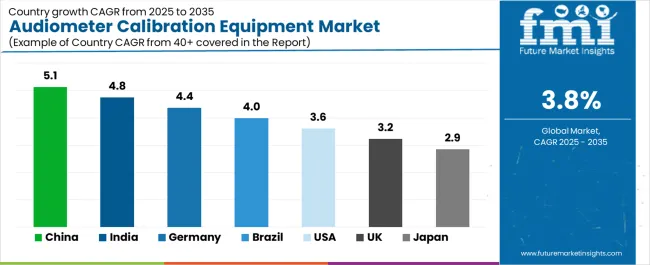
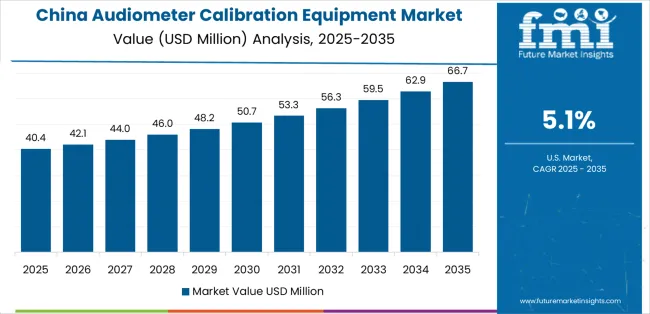
The audiometer calibration equipment market is advancing steadily worldwide, with China leading at a 5.1% CAGR through 2035, fueled by the expansion of audiological testing infrastructure, domestic manufacturing, and rising healthcare investments. India follows with 4.8%, supported by growing awareness of hearing diagnostics, increased ENT facilities, and government-backed healthcare programs. Germany posts a 4.4% CAGR, driven by technological innovation and integration of precision calibration systems. Brazil records 4.0%, reflecting improving access to healthcare and modernized audiometric centers. The USA, at 3.6%, remains a mature market emphasizing innovation, compliance, and portable calibration tools. The UK (3.2%) and Japan (2.9%) show consistent progress through process standardization, R&D collaborations, and advanced testing device optimization.

The report covers an in-depth analysis of 40+ countries top-performing countries are highlighted below.
How Is Diagnostic Infrastructure Expansion Supporting Market Growth in China?

Audiometer Calibration Equipment Market Country Value Analysis

Revenue from audiometer calibration equipment in China is projected to grow at a CAGR of 5.1% through 2035, supported by the expansion of diagnostic infrastructure and steady growth in audiology service facilities. Government initiatives to modernize healthcare testing environments are increasing procurement of calibration devices across hospitals, research laboratories, and hearing centers. Domestic manufacturers are improving precision standards and compliance with international certification. Rising investment in audiology training and community hearing programs is strengthening equipment utilization.

  • Expansion of healthcare testing facilities supports continuous calibration activity.
  • National quality standards encourage adoption of certified calibration systems.
  • Domestic manufacturing capabilities enhance supply availability.
  • Hearing care awareness programs sustain institutional equipment demand.

Why Is Healthcare Modernization Strengthening Market Expansion in India?

Revenue from audiometer calibration equipment in India is increasing at a CAGR of 4.8%, driven by the modernization of diagnostic laboratories and establishment of audiology programs across educational and clinical institutions. Expanding public healthcare infrastructure and government-led hearing screening initiatives are generating consistent demand. Importers and local distributors are focusing on portable, easy-to-calibrate systems suitable for regional service centers. Investment in medical device manufacturing under national development programs is improving product availability.

  • Growth in audiology education supports practical calibration requirements.
  • National screening initiatives drive procurement across healthcare networks.
  • Local distribution expansion improves regional accessibility.
  • Government manufacturing incentives support domestic production.

How Does Engineering Precision Enhance Market Competitiveness in Germany?

Revenue from audiometer calibration equipment in Germany is advancing at a CAGR of 4.4%, supported by the country’s strong engineering base and established medical device calibration standards. Hospitals, universities, and industrial laboratories maintain high adoption of advanced calibration instruments to ensure testing accuracy and compliance with European regulations. Manufacturers emphasize precision measurement, digital integration, and automation. Continued development of sound measurement technologies supports replacement and system upgrades.

  • Strict calibration protocols sustain consistent equipment demand.
  • Integration of digital verification systems improves operational reliability.
  • Engineering expertise enhances production efficiency and design quality.
  • Compliance with EU regulations maintains consistent market performance.

Why Is Public Health Investment Encouraging Market Growth in Brazil?

Revenue from audiometer calibration equipment in Brazil is projected to grow at a CAGR of 4.0%, supported by government investment in hearing healthcare and diagnostic capacity. Expansion of hospital infrastructure and community-based hearing programs are creating demand for portable calibration systems. Private clinics and research facilities are adopting advanced calibration tools to meet procedural and accuracy requirements. Partnerships between international suppliers and local distributors are improving product access and technical training.

  • Public healthcare expansion supports calibration equipment procurement.
  • Growing audiology service coverage increases utilization frequency.
  • Collaboration with international firms enhances system quality assurance.
  • Regional training initiatives improve device handling and maintenance.

How Do Regulatory Standards Sustain Market Development in the United States?

Revenue from audiometer calibration equipment in the United States is expanding at a CAGR of 3.6%, supported by stringent regulatory frameworks governing medical device calibration and testing accuracy. Healthcare facilities, research organizations, and military institutions maintain regular calibration schedules in compliance with national standards. Demand for automated, software-integrated calibration systems is increasing as part of broader digital health infrastructure modernization.

  • Federal calibration standards sustain steady replacement cycles.
  • Automated verification systems enhance efficiency and data reliability.
  • Research and defense applications maintain high operational demand.
  • Continuous software integration supports long-term system usability.

Why Is Standardized Clinical Practice Supporting Market Stability in the United Kingdom?

Revenue from audiometer calibration equipment in the United Kingdom is increasing at a CAGR of 3.2%, supported by standardized calibration practices within the National Health Service and private healthcare networks. Consistent emphasis on equipment certification and periodic verification maintains steady product turnover. Research institutions continue to apply calibration systems in clinical acoustics studies and device validation. Importers and service providers are maintaining stable supply chains through established European distribution channels.

  • NHS calibration policies ensure regular device testing.
  • Integration of calibration in research promotes steady utilization.
  • Dependable supply channels sustain market consistency.
  • Continuous updates to testing standards encourage system renewal.

How Does Technological Refinement Maintain Market Consistency in Japan?

Revenue from audiometer calibration equipment in Japan is growing at a CAGR of 2.9%, supported by precision engineering, strong regulatory oversight, and established audiology practices. Hospitals, research facilities, and medical device manufacturers use calibration systems to ensure measurement accuracy across clinical and industrial applications. Domestic companies prioritize miniaturized, efficient, and stable calibration technologies. Market growth remains steady through ongoing product refinement and institutional compliance requirements.
  • High technical standards sustain precision-driven product development.
  • Integration in industrial and clinical sectors broadens utilization.
  • Continuous R&D enhances accuracy and device longevity.
  • Regulatory consistency supports stable equipment replacement cycles.

How Competitive Is the Global Audiometer Calibration Equipment Market and What Defines Its Strategic Landscape?

Audiometer Calibration Equipment Market Analysis By Company

The global audiometer calibration equipment market is characterized by diversified competition among acoustic measurement specialists, audiometric system developers, and laboratory calibration providers. GRAS Sound & Vibration occupies a leading position through its portfolio of precision calibration devices and reference microphones designed for clinical and industrial testing. Norsonic and Larson Davis maintain strong competitive standings by focusing on integrated sound level and calibration systems with traceable accuracy for audiometric verification.

Aussco and Kiversal emphasize portable calibration units tailored for hearing healthcare and diagnostic facilities, supporting compliance with international acoustic standards. Brüel & Kjær continues to serve as a benchmark in sound measurement technology, complementing the broader HBK group’s acoustic instrumentation range. Tremetrics and Grason-Stadler supply calibration-enabled audiometric systems used in occupational hearing testing and medical diagnostics.

Benson Medical and Hangzhou AIHUA Instruments Co., Ltd. focus on practical calibration tools and regional manufacturing strength in the Asia–Pacific market. Listen, Inc. and NTi Audio develop digital calibration platforms that integrate measurement software and hardware automation. Precision Acoustics and PCB Piezotronics provide laboratory-grade calibration reference devices supporting research and metrology applications. Svantek and Frye Electronics target specific industrial and clinical segments, while Rion Co., Ltd. sustains a steady presence in portable acoustic calibration solutions across Asian markets. Competition in this sector is defined by precision, calibration repeatability, and adherence to international audiometric standards, while future differentiation depends on digital signal integration, miniaturization, and automated verification capabilities.

GRAS Sound & Vibration

GRAS Sound & Vibration
Norsonic
Larson Davis
Aussco
Kiversal
Brüel & Kjær
Tremetrics
Grason-Stadler
Benson Medical
Hangzhou AIHUA Instruments Co., Ltd.
Listen, Inc.
NTi Audio
Precision Acoustics
PCB Piezotronics
Svantek
Frye Electronics
Rion Co., Ltd.

How precise and expansive is the Audiometer Calibration Equipment Market scope?

Items Values
Quantitative Units (2025) USD million
Type (Classification) Analog Signal, Digital Integration
Application Field Calibration and Maintenance, Hospital and Clinical Audiology, Others
Regions Covered East Asia, Europe, North America, South Asia, Latin America, Middle East & Africa, Eastern Europe
Countries Covered China, India, Germany, Brazil, USA, UK, Japan, and 40+ countries
Key Companies Profiled GRAS Sound & Vibration, Norsonic, Larson Davis, Aussco, Kiversal, Brüel & Kjær, Tremetrics, Grason-Stadler, Benson Medical, Hangzhou AIHUA Instruments Co. Ltd., Listen Inc., NTi Audio, Precision Acoustics, PCB Piezotronics, Svantek, Frye Electronics, Rion Co. Ltd.
Additional Attributes Dollar sales by classification and application categories; regional adoption trends across East Asia, Europe, and North America; competitive landscape involving calibration equipment manufacturers, audiometric technology providers, and research laboratories; assessment of precision engineering, digital signal integration, and automation trends; analysis of cost barriers, regulatory frameworks, and tele-audiology integration shaping equipment deployment.

Portable Audiometer Calibration System Market by Segments

Classification:

  • Analog Signal
  • Digital Integration

Application:

  • Field Calibration and Maintenance
  • Hospital and Clinical Audiology
  • Others

Region:

East Asia

  • China
  • Japan
  • South Korea
  • Taiwan
  • Rest of East Asia

Europe

  • Germany
  • UK
  • France
  • Italy
  • Spain
  • Switzerland
  • Nordic
  • BENELUX
  • Rest of Europe

North America

  • USA
  • Canada
  • Mexico

South Asia

  • India
  • Pakistan
  • Bangladesh
  • Rest of South Asia

Latin America

  • Brazil
  • Argentina
  • Chile
  • Rest of Latin America

Middle East & Africa

  • Kingdom of Saudi Arabia
  • Other GCC Countries
  • Turkey
  • South Africa
  • Other African Union
  • Rest of Middle East & Africa

Eastern Europe

  • Russia
  • Poland
  • Czech Republic
  • Rest of Eastern Europe

Frequently Asked Questions

How big is the audiometer calibration equipment market in 2025?

The global audiometer calibration equipment market is estimated to be valued at USD 99.1 million in 2025.

What will be the size of audiometer calibration equipment market in 2035?

The market size for the audiometer calibration equipment market is projected to reach USD 144.0 million by 2035.

How much will be the audiometer calibration equipment market growth between 2025 and 2035?

The audiometer calibration equipment market is expected to grow at a 3.8% CAGR between 2025 and 2035.

What are the key product types in the audiometer calibration equipment market?

The key product types in audiometer calibration equipment market are analog signal and digital integration.

Which application segment to contribute significant share in the audiometer calibration equipment market in 2025?

In terms of application, field calibration and maintenance segment to command 29.0% share in the audiometer calibration equipment market in 2025.

Table of Content

  1. Executive Summary
    • Global Market Outlook
    • Demand to side Trends
    • Supply to side Trends
    • Technology Roadmap Analysis
    • Analysis and Recommendations
  2. Market Overview
    • Market Coverage / Taxonomy
    • Market Definition / Scope / Limitations
  3. Market Background
    • Market Dynamics
      • Drivers
      • Restraints
      • Opportunity
      • Trends
    • Scenario Forecast
      • Demand in Optimistic Scenario
      • Demand in Likely Scenario
      • Demand in Conservative Scenario
    • Opportunity Map Analysis
    • Product Life Cycle Analysis
    • Supply Chain Analysis
    • Investment Feasibility Matrix
    • Value Chain Analysis
    • PESTLE and Porter’s Analysis
    • Regulatory Landscape
    • Regional Parent Market Outlook
    • Production and Consumption Statistics
    • Import and Export Statistics
  4. Global Market Analysis 2020 to 2024 and Forecast, 2025 to 2035
    • Historical Market Size Value (USD Million) Analysis, 2020 to 2024
    • Current and Future Market Size Value (USD Million) Projections, 2025 to 2035
      • Y to o to Y Growth Trend Analysis
      • Absolute $ Opportunity Analysis
  5. Global Market Pricing Analysis 2020 to 2024 and Forecast 2025 to 2035
  6. Global Market Analysis 2020 to 2024 and Forecast 2025 to 2035, By Classification
    • Introduction / Key Findings
    • Historical Market Size Value (USD Million) Analysis By Classification , 2020 to 2024
    • Current and Future Market Size Value (USD Million) Analysis and Forecast By Classification , 2025 to 2035
      • Analog Signal
      • Digital Integration
    • Y to o to Y Growth Trend Analysis By Classification , 2020 to 2024
    • Absolute $ Opportunity Analysis By Classification , 2025 to 2035
  7. Global Market Analysis 2020 to 2024 and Forecast 2025 to 2035, By Application
    • Introduction / Key Findings
    • Historical Market Size Value (USD Million) Analysis By Application, 2020 to 2024
    • Current and Future Market Size Value (USD Million) Analysis and Forecast By Application, 2025 to 2035
      • Field Calibration and Maintenance
      • Hospital and Clinical Audiology
      • Others
    • Y to o to Y Growth Trend Analysis By Application, 2020 to 2024
    • Absolute $ Opportunity Analysis By Application, 2025 to 2035
  8. Global Market Analysis 2020 to 2024 and Forecast 2025 to 2035, By Region
    • Introduction
    • Historical Market Size Value (USD Million) Analysis By Region, 2020 to 2024
    • Current Market Size Value (USD Million) Analysis and Forecast By Region, 2025 to 2035
      • North America
      • Latin America
      • Western Europe
      • Eastern Europe
      • East Asia
      • South Asia and Pacific
      • Middle East & Africa
    • Market Attractiveness Analysis By Region
  9. North America Market Analysis 2020 to 2024 and Forecast 2025 to 2035, By Country
    • Historical Market Size Value (USD Million) Trend Analysis By Market Taxonomy, 2020 to 2024
    • Market Size Value (USD Million) Forecast By Market Taxonomy, 2025 to 2035
      • By Country
        • USA
        • Canada
        • Mexico
      • By Classification
      • By Application
    • Market Attractiveness Analysis
      • By Country
      • By Classification
      • By Application
    • Key Takeaways
  10. Latin America Market Analysis 2020 to 2024 and Forecast 2025 to 2035, By Country
    • Historical Market Size Value (USD Million) Trend Analysis By Market Taxonomy, 2020 to 2024
    • Market Size Value (USD Million) Forecast By Market Taxonomy, 2025 to 2035
      • By Country
        • Brazil
        • Chile
        • Rest of Latin America
      • By Classification
      • By Application
    • Market Attractiveness Analysis
      • By Country
      • By Classification
      • By Application
    • Key Takeaways
  11. Western Europe Market Analysis 2020 to 2024 and Forecast 2025 to 2035, By Country
    • Historical Market Size Value (USD Million) Trend Analysis By Market Taxonomy, 2020 to 2024
    • Market Size Value (USD Million) Forecast By Market Taxonomy, 2025 to 2035
      • By Country
        • Germany
        • UK
        • Italy
        • Spain
        • France
        • Nordic
        • BENELUX
        • Rest of Western Europe
      • By Classification
      • By Application
    • Market Attractiveness Analysis
      • By Country
      • By Classification
      • By Application
    • Key Takeaways
  12. Eastern Europe Market Analysis 2020 to 2024 and Forecast 2025 to 2035, By Country
    • Historical Market Size Value (USD Million) Trend Analysis By Market Taxonomy, 2020 to 2024
    • Market Size Value (USD Million) Forecast By Market Taxonomy, 2025 to 2035
      • By Country
        • Russia
        • Poland
        • Hungary
        • Balkan & Baltic
        • Rest of Eastern Europe
      • By Classification
      • By Application
    • Market Attractiveness Analysis
      • By Country
      • By Classification
      • By Application
    • Key Takeaways
  13. East Asia Market Analysis 2020 to 2024 and Forecast 2025 to 2035, By Country
    • Historical Market Size Value (USD Million) Trend Analysis By Market Taxonomy, 2020 to 2024
    • Market Size Value (USD Million) Forecast By Market Taxonomy, 2025 to 2035
      • By Country
        • China
        • Japan
        • South Korea
      • By Classification
      • By Application
    • Market Attractiveness Analysis
      • By Country
      • By Classification
      • By Application
    • Key Takeaways
  14. South Asia and Pacific Market Analysis 2020 to 2024 and Forecast 2025 to 2035, By Country
    • Historical Market Size Value (USD Million) Trend Analysis By Market Taxonomy, 2020 to 2024
    • Market Size Value (USD Million) Forecast By Market Taxonomy, 2025 to 2035
      • By Country
        • India
        • ASEAN
        • Australia & New Zealand
        • Rest of South Asia and Pacific
      • By Classification
      • By Application
    • Market Attractiveness Analysis
      • By Country
      • By Classification
      • By Application
    • Key Takeaways
  15. Middle East & Africa Market Analysis 2020 to 2024 and Forecast 2025 to 2035, By Country
    • Historical Market Size Value (USD Million) Trend Analysis By Market Taxonomy, 2020 to 2024
    • Market Size Value (USD Million) Forecast By Market Taxonomy, 2025 to 2035
      • By Country
        • Kingdom of Saudi Arabia
        • Other GCC Countries
        • Turkiye
        • South Africa
        • Other African Union
        • Rest of Middle East & Africa
      • By Classification
      • By Application
    • Market Attractiveness Analysis
      • By Country
      • By Classification
      • By Application
    • Key Takeaways
  16. Key Countries Market Analysis
    • USA
      • Pricing Analysis
      • Market Share Analysis, 2024
        • By Classification
        • By Application
    • Canada
      • Pricing Analysis
      • Market Share Analysis, 2024
        • By Classification
        • By Application
    • Mexico
      • Pricing Analysis
      • Market Share Analysis, 2024
        • By Classification
        • By Application
    • Brazil
      • Pricing Analysis
      • Market Share Analysis, 2024
        • By Classification
        • By Application
    • Chile
      • Pricing Analysis
      • Market Share Analysis, 2024
        • By Classification
        • By Application
    • Germany
      • Pricing Analysis
      • Market Share Analysis, 2024
        • By Classification
        • By Application
    • UK
      • Pricing Analysis
      • Market Share Analysis, 2024
        • By Classification
        • By Application
    • Italy
      • Pricing Analysis
      • Market Share Analysis, 2024
        • By Classification
        • By Application
    • Spain
      • Pricing Analysis
      • Market Share Analysis, 2024
        • By Classification
        • By Application
    • France
      • Pricing Analysis
      • Market Share Analysis, 2024
        • By Classification
        • By Application
    • India
      • Pricing Analysis
      • Market Share Analysis, 2024
        • By Classification
        • By Application
    • ASEAN
      • Pricing Analysis
      • Market Share Analysis, 2024
        • By Classification
        • By Application
    • Australia & New Zealand
      • Pricing Analysis
      • Market Share Analysis, 2024
        • By Classification
        • By Application
    • China
      • Pricing Analysis
      • Market Share Analysis, 2024
        • By Classification
        • By Application
    • Japan
      • Pricing Analysis
      • Market Share Analysis, 2024
        • By Classification
        • By Application
    • South Korea
      • Pricing Analysis
      • Market Share Analysis, 2024
        • By Classification
        • By Application
    • Russia
      • Pricing Analysis
      • Market Share Analysis, 2024
        • By Classification
        • By Application
    • Poland
      • Pricing Analysis
      • Market Share Analysis, 2024
        • By Classification
        • By Application
    • Hungary
      • Pricing Analysis
      • Market Share Analysis, 2024
        • By Classification
        • By Application
    • Kingdom of Saudi Arabia
      • Pricing Analysis
      • Market Share Analysis, 2024
        • By Classification
        • By Application
    • Turkiye
      • Pricing Analysis
      • Market Share Analysis, 2024
        • By Classification
        • By Application
    • South Africa
      • Pricing Analysis
      • Market Share Analysis, 2024
        • By Classification
        • By Application
  17. Market Structure Analysis
    • Competition Dashboard
    • Competition Benchmarking
    • Market Share Analysis of Top Players
      • By Regional
      • By Classification
      • By Application
  18. Competition Analysis
    • Competition Deep Dive
      • GRAS Sound & Vibration
        • Overview
        • Product Portfolio
        • Profitability by Market Segments (Product/Age /Sales Channel/Region)
        • Sales Footprint
        • Strategy Overview
          • Marketing Strategy
          • Product Strategy
          • Channel Strategy
      • Norsonic
      • Larson Davis
      • Aussco
      • Kiversal
      • Brüel & Kjær
      • Tremetrics
      • Grason-Stadler
      • Benson Medical
      • Hangzhou AIHUA Instruments Co., Ltd.
      • Listen, Inc.
      • NTi Audio
      • Precision Acoustics
      • PCB Piezotronics
      • Svantek
      • Frye Electronics
      • Rion Co., Ltd.
  19. Assumptions & Acronyms Used
  20. Research Methodology

List of Tables

  • Table 1: Global Market Value (USD Million) Forecast by Region, 2020 to 2035
  • Table 2: Global Market Value (USD Million) Forecast by Classification , 2020 to 2035
  • Table 3: Global Market Value (USD Million) Forecast by Application, 2020 to 2035
  • Table 4: North America Market Value (USD Million) Forecast by Country, 2020 to 2035
  • Table 5: North America Market Value (USD Million) Forecast by Classification , 2020 to 2035
  • Table 6: North America Market Value (USD Million) Forecast by Application, 2020 to 2035
  • Table 7: Latin America Market Value (USD Million) Forecast by Country, 2020 to 2035
  • Table 8: Latin America Market Value (USD Million) Forecast by Classification , 2020 to 2035
  • Table 9: Latin America Market Value (USD Million) Forecast by Application, 2020 to 2035
  • Table 10: Western Europe Market Value (USD Million) Forecast by Country, 2020 to 2035
  • Table 11: Western Europe Market Value (USD Million) Forecast by Classification , 2020 to 2035
  • Table 12: Western Europe Market Value (USD Million) Forecast by Application, 2020 to 2035
  • Table 13: Eastern Europe Market Value (USD Million) Forecast by Country, 2020 to 2035
  • Table 14: Eastern Europe Market Value (USD Million) Forecast by Classification , 2020 to 2035
  • Table 15: Eastern Europe Market Value (USD Million) Forecast by Application, 2020 to 2035
  • Table 16: East Asia Market Value (USD Million) Forecast by Country, 2020 to 2035
  • Table 17: East Asia Market Value (USD Million) Forecast by Classification , 2020 to 2035
  • Table 18: East Asia Market Value (USD Million) Forecast by Application, 2020 to 2035
  • Table 19: South Asia and Pacific Market Value (USD Million) Forecast by Country, 2020 to 2035
  • Table 20: South Asia and Pacific Market Value (USD Million) Forecast by Classification , 2020 to 2035
  • Table 21: South Asia and Pacific Market Value (USD Million) Forecast by Application, 2020 to 2035
  • Table 22: Middle East & Africa Market Value (USD Million) Forecast by Country, 2020 to 2035
  • Table 23: Middle East & Africa Market Value (USD Million) Forecast by Classification , 2020 to 2035
  • Table 24: Middle East & Africa Market Value (USD Million) Forecast by Application, 2020 to 2035

List of Figures

  • Figure 1: Global Market Pricing Analysis
  • Figure 2: Global Market Value (USD Million) Forecast 2020-2035
  • Figure 3: Global Market Value Share and BPS Analysis by Classification , 2025 and 2035
  • Figure 4: Global Market Y-o-Y Growth Comparison by Classification , 2025-2035
  • Figure 5: Global Market Attractiveness Analysis by Classification
  • Figure 6: Global Market Value Share and BPS Analysis by Application, 2025 and 2035
  • Figure 7: Global Market Y-o-Y Growth Comparison by Application, 2025-2035
  • Figure 8: Global Market Attractiveness Analysis by Application
  • Figure 9: Global Market Value (USD Million) Share and BPS Analysis by Region, 2025 and 2035
  • Figure 10: Global Market Y-o-Y Growth Comparison by Region, 2025-2035
  • Figure 11: Global Market Attractiveness Analysis by Region
  • Figure 12: North America Market Incremental Dollar Opportunity, 2025-2035
  • Figure 13: Latin America Market Incremental Dollar Opportunity, 2025-2035
  • Figure 14: Western Europe Market Incremental Dollar Opportunity, 2025-2035
  • Figure 15: Eastern Europe Market Incremental Dollar Opportunity, 2025-2035
  • Figure 16: East Asia Market Incremental Dollar Opportunity, 2025-2035
  • Figure 17: South Asia and Pacific Market Incremental Dollar Opportunity, 2025-2035
  • Figure 18: Middle East & Africa Market Incremental Dollar Opportunity, 2025-2035
  • Figure 19: North America Market Value Share and BPS Analysis by Country, 2025 and 2035
  • Figure 20: North America Market Value Share and BPS Analysis by Classification , 2025 and 2035
  • Figure 21: North America Market Y-o-Y Growth Comparison by Classification , 2025-2035
  • Figure 22: North America Market Attractiveness Analysis by Classification
  • Figure 23: North America Market Value Share and BPS Analysis by Application, 2025 and 2035
  • Figure 24: North America Market Y-o-Y Growth Comparison by Application, 2025-2035
  • Figure 25: North America Market Attractiveness Analysis by Application
  • Figure 26: Latin America Market Value Share and BPS Analysis by Country, 2025 and 2035
  • Figure 27: Latin America Market Value Share and BPS Analysis by Classification , 2025 and 2035
  • Figure 28: Latin America Market Y-o-Y Growth Comparison by Classification , 2025-2035
  • Figure 29: Latin America Market Attractiveness Analysis by Classification
  • Figure 30: Latin America Market Value Share and BPS Analysis by Application, 2025 and 2035
  • Figure 31: Latin America Market Y-o-Y Growth Comparison by Application, 2025-2035
  • Figure 32: Latin America Market Attractiveness Analysis by Application
  • Figure 33: Western Europe Market Value Share and BPS Analysis by Country, 2025 and 2035
  • Figure 34: Western Europe Market Value Share and BPS Analysis by Classification , 2025 and 2035
  • Figure 35: Western Europe Market Y-o-Y Growth Comparison by Classification , 2025-2035
  • Figure 36: Western Europe Market Attractiveness Analysis by Classification
  • Figure 37: Western Europe Market Value Share and BPS Analysis by Application, 2025 and 2035
  • Figure 38: Western Europe Market Y-o-Y Growth Comparison by Application, 2025-2035
  • Figure 39: Western Europe Market Attractiveness Analysis by Application
  • Figure 40: Eastern Europe Market Value Share and BPS Analysis by Country, 2025 and 2035
  • Figure 41: Eastern Europe Market Value Share and BPS Analysis by Classification , 2025 and 2035
  • Figure 42: Eastern Europe Market Y-o-Y Growth Comparison by Classification , 2025-2035
  • Figure 43: Eastern Europe Market Attractiveness Analysis by Classification
  • Figure 44: Eastern Europe Market Value Share and BPS Analysis by Application, 2025 and 2035
  • Figure 45: Eastern Europe Market Y-o-Y Growth Comparison by Application, 2025-2035
  • Figure 46: Eastern Europe Market Attractiveness Analysis by Application
  • Figure 47: East Asia Market Value Share and BPS Analysis by Country, 2025 and 2035
  • Figure 48: East Asia Market Value Share and BPS Analysis by Classification , 2025 and 2035
  • Figure 49: East Asia Market Y-o-Y Growth Comparison by Classification , 2025-2035
  • Figure 50: East Asia Market Attractiveness Analysis by Classification
  • Figure 51: East Asia Market Value Share and BPS Analysis by Application, 2025 and 2035
  • Figure 52: East Asia Market Y-o-Y Growth Comparison by Application, 2025-2035
  • Figure 53: East Asia Market Attractiveness Analysis by Application
  • Figure 54: South Asia and Pacific Market Value Share and BPS Analysis by Country, 2025 and 2035
  • Figure 55: South Asia and Pacific Market Value Share and BPS Analysis by Classification , 2025 and 2035
  • Figure 56: South Asia and Pacific Market Y-o-Y Growth Comparison by Classification , 2025-2035
  • Figure 57: South Asia and Pacific Market Attractiveness Analysis by Classification
  • Figure 58: South Asia and Pacific Market Value Share and BPS Analysis by Application, 2025 and 2035
  • Figure 59: South Asia and Pacific Market Y-o-Y Growth Comparison by Application, 2025-2035
  • Figure 60: South Asia and Pacific Market Attractiveness Analysis by Application
  • Figure 61: Middle East & Africa Market Value Share and BPS Analysis by Country, 2025 and 2035
  • Figure 62: Middle East & Africa Market Value Share and BPS Analysis by Classification , 2025 and 2035
  • Figure 63: Middle East & Africa Market Y-o-Y Growth Comparison by Classification , 2025-2035
  • Figure 64: Middle East & Africa Market Attractiveness Analysis by Classification
  • Figure 65: Middle East & Africa Market Value Share and BPS Analysis by Application, 2025 and 2035
  • Figure 66: Middle East & Africa Market Y-o-Y Growth Comparison by Application, 2025-2035
  • Figure 67: Middle East & Africa Market Attractiveness Analysis by Application
  • Figure 68: Global Market - Tier Structure Analysis
  • Figure 69: Global Market - Company Share Analysis
Dashboard
Dashboard
Dashboard
Dashboard
Dashboard
Dashboard

Our Research Products

Full Research Suite

The "Full Research Suite" delivers actionable market intel, deep dives on markets or technologies, so clients act faster, cut risk, and unlock growth.

Competitor Leaderboard Report

The Leaderboard benchmarks and ranks top vendors, classifying them as Established Leaders, Leading Challengers, or Disruptors & Challengers.

Future Leaders Index

Locates where complements amplify value and substitutes erode it, forecasting net impact by horizon

Market Data & Forecasts

We deliver granular, decision-grade intel: market sizing, 5-year forecasts, pricing, adoption, usage, revenue, and operational KPIs—plus competitor tracking, regulation, and value chains—across 60 countries broadly.

Market Focus Report

Spot the shifts before they hit your P&L. We track inflection points, adoption curves, pricing moves, and ecosystem plays to show where demand is heading, why it is changing, and what to do next across high-growth markets and disruptive tech

Survey Report

Real-time reads of user behavior. We track shifting priorities, perceptions of today’s and next-gen services, and provider experience, then pace how fast tech moves from trial to adoption, blending buyer, consumer, and channel inputs with social signals (#WhySwitch, #UX).

Bespoke Reports

Partner with our analyst team to build a custom report designed around your business priorities. From analysing market trends to assessing competitors or crafting bespoke datasets, we tailor insights to your needs.

Supplier Intelligence

Discovery & Profiling

Capacity & Footprint

Performance & Risk

Compliance & Governance

Commercial Readiness

Who Supplies Whom

Scorecards & Shortlists

Playbooks & Docs

Category Intelligence

Definition & Scope

Demand & Use Cases

Cost Drivers

Market Structure

Supply Chain Map

Trade & Policy

Operating Norms

Deliverables

Buyer Intelligence

Account Basics

Spend & Scope

Procurement Model

Vendor Requirements

Terms & Policies

Entry Strategy

Pain Points & Triggers

Outputs

Pricing Analysis

Benchmarks

Trends

Should-Cost

Indexation

Landed Cost

Commercial Terms

Deliverables

Brand Analysis

Positioning & Value Prop

Share & Presence

Customer Evidence

Go-to-Market

Digital & Reputation

Compliance & Trust

KPIs & Gaps

Outputs

Full Research Suite comprises of:

Market outlook & trends analysis

Market outlook & trends analysis

Interviews & case studies

Interviews & case studies

Strategic recommendations

Strategic recommendations

Vendor profiles & capabilities analysis

Vendor profiles & capabilities analysis

5-year forecasts

5-year forecasts

8 regions and 60+ country-level data splits

8 regions and 60+ country-level data splits

Market segment data splits

Market segment data splits

12 months of continuous data updates

12 months of continuous data updates

DELIVERED AS:

PDF EXCEL ONLINE

Full Research Suite


$5000

$7500

$10000

Buy Report Now
Similar Industry Reports

Similar Industry Reports

Calibration Management Software Market

Calibration Management Software Market Size and Share Forecast Outlook 2025 to 2035

ADAS Calibration-as-a-Service Market

ADAS Calibration-as-a-Service Market Analysis - Size, Share, and Forecast Outlook 2025 to 2035

ADAS Calibration Equipment Market

ADAS Calibration Equipment Market Growth – Innovations, Trends & Forecast 2025 to 2035

Instrument Calibration Services Market

Instrument Calibration Services Market Size and Share Forecast Outlook 2025 to 2035

Finger Blood Calibration Free Glucose Meter Market

Finger Blood Calibration Free Glucose Meter Market Size and Share Forecast Outlook 2025 to 2035

Equipment Management Software Market

Equipment Management Software Market Size and Share Forecast Outlook 2025 to 2035

Equipment cases market

Equipment cases market Size and Share Forecast Outlook 2025 to 2035

Farm Equipment Market

Farm Equipment Market Forecast and Outlook 2025 to 2035

Golf Equipment Market

Golf Equipment Market Size and Share Forecast Outlook 2025 to 2035

Port Equipment Market

Port Equipment Market Size and Share Forecast Outlook 2025 to 2035

Pouch Equipment Market

Pouch Equipment Market Growth – Demand, Trends & Outlook 2025 to 2035

Garage Equipment Market

Garage Equipment Market Forecast and Outlook 2025 to 2035

Mining Equipment Industry Analysis in Latin America

Mining Equipment Industry Analysis in Latin America Size and Share Forecast Outlook 2025 to 2035

Subsea Equipment Market

Subsea Equipment Market Size and Share Forecast Outlook 2025 to 2035

Pavers Equipment Market

Pavers Equipment Market Size and Share Forecast Outlook 2025 to 2035

Tennis Equipment Market

Tennis Equipment Market Analysis - Size, Share, and Forecast Outlook 2025 to 2035

Galley Equipment Market

Galley Equipment Market Analysis and Forecast by Fit, Application, and Region through 2035

Sorting Equipment Market

Sorting Equipment Market Size and Share Forecast Outlook 2025 to 2035

General Equipment Rental Services Market

General Equipment Rental Services Market Size and Share Forecast Outlook 2025 to 2035

Bagging Equipment Market

Bagging Equipment Market Size and Share Forecast Outlook 2025 to 2035

Future Market Insights

Audiometer Calibration Equipment Market

Chat With MaRIA

Chat With

MaRIA

Hi There, I am MaRIA, Your Market Research Intelligence Assistant. How may I help you?