Beverage Acidulants Market Outlook and Forecast 2025 to 2035

The global beverage acidulants market is projected to grow from USD 2.6 billion in 2025 to USD 4.2 billion by 2035, registering a CAGR of 4.9%. The market expansion is driven by the increasing demand for functional beverages, improved shelf life, and enhanced flavors in a wide range of beverages.
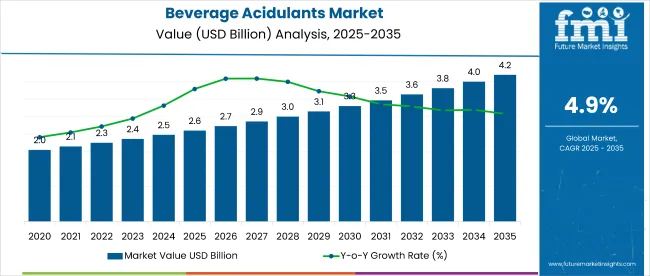
Quick Stats Of Beverage Acidulants Market

  • Market Value (2025): USD 2.6 billion
  • Forecast Value (2035): USD 4.2 billion
  • Forecast CAGR: 4.9%
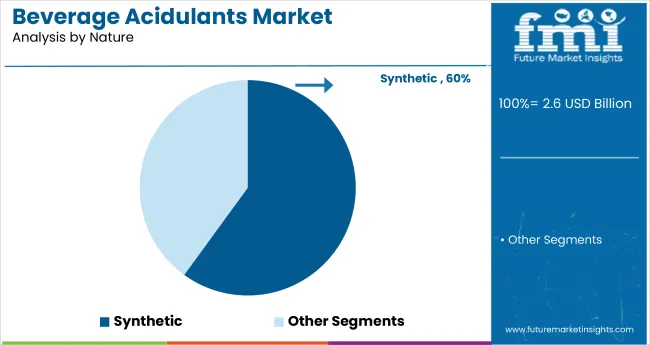
  • Nature Segment Leader in 2025: Synthetic (60% market share)
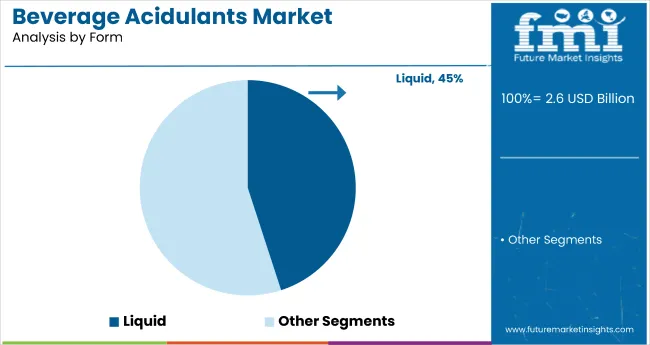
  • Top Form Segment: Liquid (45% share)
  • Key Growth Region: East Asia (Japan is the fastest-growing market with a 5.5% CAGR)

Beverage Acidulants Market

Consumer preferences for healthier, low-calorie, and organic drinks are propelling the growth of beverage acidulants, especially in fruit juices, soft drinks, and smoothies. With the rising focus on product innovation, manufacturers are incorporating advanced acidulants to achieve distinct taste profiles and improve drink texture.

The market holds significant shares within its parent markets. In the beverage ingredients market, it commands 7-10%, reflecting its key role in flavor enhancement and preservation. Within the food & beverage additives market, it contributes around 5-8%, driven by its use in improving beverage characteristics. In the functional food ingredients market, the share is around 3-5%, as acidulants are increasingly used in health-focused beverages.

The food preservatives market witnesses a contribution of 2-3%, while the organic food ingredients market accounts for about 1-2%. Additionally, the market holds 4-6% within the flavoring agents market and 2-3% in the food & beverage processing market, underlining its broad application in the food and beverage industry.

Regulatory frameworks play a crucial role in shaping the market, particularly with respect to food safety and product labeling. In countries like the United States and those in the European Union, the Food and Drug Administration (FDA) and European Food Safety Authority (EFSA) set guidelines for the permissible levels of acidulants in beverages.

These regulations ensure consumer safety and product consistency, fostering trust and encouraging the consumption of beverages containing safe and regulated acidulants. Furthermore, with growing awareness about health and sustainability, the demand for non-toxic, clean-label acidulants is increasing, supporting the shift toward natural, plant-based, and organic beverage formulations.

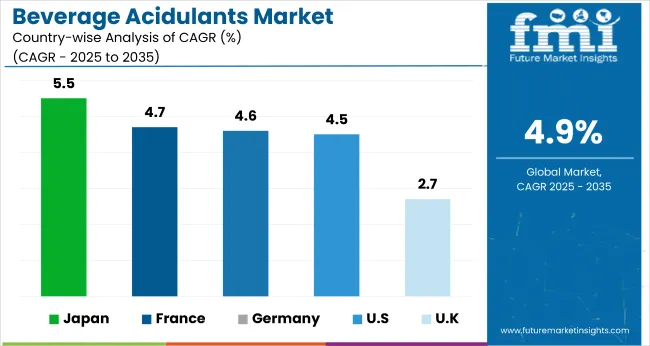
Japan is projected to be the fastest-growing market, expected to expand at a CAGR of 5.5% from 2025 to 2035. Synthetic will dominate the nature segment with a 60% share, while liquid will lead the form segment with a 45% share. The UK and USA markets are also expected to grow steadily at CAGRs of 2.7% and 4.5%, respectively. Germany and France will experience moderate growth at CAGRs of 4.6% and 4.7%, respectively.

Beverage Acidulants Market Analysis by Top Investment Segments

The market is segmented by product type, form, nature, application, and region. By product type, the market is divided into acetic acid, citric acid, fumaric acid, lactic acid, malic acid, phosphoric acid, tartaric acid, and other product types (succinic acid, gluconic acid, and ascorbic acid).

In terms of form, the market is classified into granule, liquid, and powder. Based on nature, the market is bifurcated into organic and synthetic. By application, the market is segmented into alcoholic beverages, dairy-based beverages, energy drinks, fruit juices & concentrates, and soft drinks. Regionally, the market is classified into North America, Latin America, Europe, Asia Pacific, and Middle East and Africa.
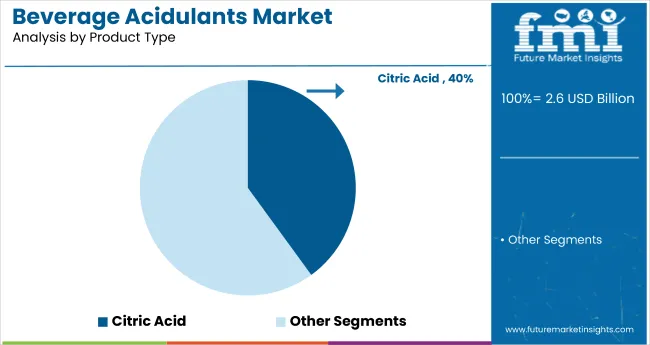
Citric Acid to Lead the Product Type Segment with 40% Market Share

Beverage Acidulants Market Analysis By Product Type

Citric acid is expected to lead the product type segment, holding a 40% market share by 2025, driven by its widespread use in both conventional and organic beverages for flavor enhancement and preservation.
  • Citric acid remains a preferred acidulant due to its excellent solubility, mild taste profile, and effectiveness in maintaining beverage stability and shelf life.
  • The growing demand for functional beverages and organic products drives the preference for citric acid across the industry.

Liquid to Lead the Form Segment with 45% Market Share

Beverage Acidulants Market Analysis By Form

Liquid is anticipated to dominate the form segment, capturing 45% of the share by 2025, due to its ease of integration, consistency in flavor, and widespread use across various beverage categories.
  • Liquid acidulants are preferred in beverage production due to their ease of integration into formulations and consistency in flavor profiles.
  • Their use in both alcoholic and non-alcoholic beverages, especially fruit juices and soft drinks, is expected to drive market growth.

Synthetic to Capture 60% of the Nature Segment in 2025

Beverage Acidulants Market Analysis By Nature

Synthetic is projected to lead the nature segment, securing 60% of the global market share by 2025, owing to its cost-effectiveness, consistent quality, and widespread use in mass-produced beverages.
  • Synthetic acidulants are cost-effective and widely used across large-scale beverage production, particularly in soft drinks and energy drinks.
  • Their consistent quality and longer shelf life contribute to their high demand.

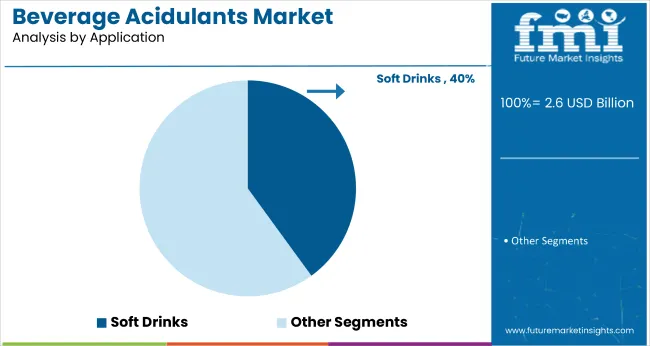
Soft Drinks to Lead the Application Segment with 40% Market Share

Beverage Acidulants Market Analysis By Application

Soft drinks are expected to dominate the application segment, capturing 40% of the market share by 2025, driven by the demand for flavor enhancement, preservation, and the increasing popularity of low-calorie and flavored beverage options.

  • The soft drink industry’s demand for acidulants is driven by the need for flavor enhancement and extended shelf life.
  • The shift towards low-calorie and flavored soft drinks boosts the consumption of beverage acidulants, particularly citric and phosphoric acids.

Top Beverage Acidulants Market Dynamics

The global beverage acidulants market is experiencing steady growth, driven by the increasing demand for healthier, functional beverages and the need for improved flavor profiles and shelf life. Beverage acidulants play a critical role in enhancing taste, preserving freshness, and ensuring product consistency across various beverage categories.

Recent Trends in the Beverage Acidulants Market

  • The growing demand for organic and clean-label products is driving the shift towards natural and plant-based acidulants, such as citric and malic acids, in beverages.
  • Functional beverages, such as energy drinks and health-focused soft drinks, are incorporating more diverse acidulants to enhance taste and nutritional benefits.

Challenges in the Beverage Acidulants Market
  • Fluctuations in the prices of raw materials, such as citrus fruits for citric acid production, can impact the overall cost structure of beverage acidulants.
  • Consumer preferences for low-sugar and low-calorie drinks, along with increasing concerns about artificial additives, create challenges for manufacturers in balancing flavor enhancement with health-conscious demands.

Top Countries Driving Demand, Manufacturing, and Regulating Beverage Acidulants

Beverage Acidulants Market Cagr Analysis By Country

Japan’s momentum is driven by the rising demand for functional beverages, particularly in health-conscious sectors like energy drinks, dairy-based beverages, and fruit juices. Germany and France maintain consistent demand driven by EU health regulations and funding for beverage innovation under the Green Deal. In contrast, developed economies such as the USA (4.5% CAGR), UK (2.7%), and Japan (5.5%) are expected to expand at 0.91x to 1.12x the global growth rate.

The growth rates of beverage acidulants in key markets differ slightly but are primarily driven by health trends and regulatory pressures. Japan leads with strong demand for functional, organic, and low-calorie beverages. Germany and France follow closely, with both markets driven by EU health goals, beverage innovation, and sustainability mandates.

The USA shows a slightly lower growth rate, influenced by evolving beverage formulations and health-conscious trends. The UK has the slowest growth, impacted by post-Brexit regulatory changes and cautious investment, though demand for clean-label, low-calorie products is on the rise.

The report covers in-depth analysis of 40+ countries; five top-performing OECD countries are highlighted below.

In-depth Analysis of Beverage Acidulants Demand in Japan

The Japan beverage acidulants revenue is growing at a CAGR of 5.5% from 2025 to 2035. Growth is driven by high demand in health-focused beverages like energy drinks, dairy-based beverages, and fruit juices. As a technology-driven economy, Japan prioritizes the use of natural and synthetic acidulants for product innovation, particularly in functional beverages.

  • High demand in energy drinks, dairy-based beverages, and functional drinks.
  • Preference for organic and clean-label acidulants.

Growth Outlook for Beverage Acidulants in Germany

The sales of beverage acidulants in Germany are expected to expand at a 4.6% CAGR during the forecast period, aligned with the global growth rate but strongly regulation-driven. EU health and sustainability goals, beverage innovation, and functional product demands are pushing adoption of natural and synthetic acidulants.

  • Strong EU health compliance pressures in soft drinks and energy drinks.
  • Digital tracking of ingredients and formulations.

Beverage Acidulants Demand in France

The French beverage acidulants market is projected to grow at a 4.7% CAGR during the forecast period, mirroring Germany in its policy-backed adoption trajectory. Demand is driven by national health initiatives, food safety regulations, and the growing trend for organic beverages.

  • Preference for organic and sustainable acidulants.
  • High adoption in dairy and soft drink applications.

Demand Trajectory for Beverage Acidulants in the USA

The USA beverage acidulants market is projected to grow at a 4.5% CAGR from 2025 to 2035, translating to 0.96x the global rate. Unlike emerging markets focused on new installations, USA demand is heavily tied to the evolution of beverage formulations and health-conscious consumption trends. High demand exists for low-calorie and organic drinks, particularly in the soft drink and energy drink segments.

  • Strong demand for clean-label and organic beverage formulations.
  • Health-conscious consumer trends fueling demand.

Beverage Acidulants Trends in the UK

The UK beverage acidulants revenue is projected to grow at a 2.7% CAGR from 2025 to 2035, representing the slowest growth among the top OECD nations, at 0.55 times the global pace. Growth is supported by regulatory pressures in industries like soft drinks, energy drinks, and dairy-based beverages.
  • Focus on regulatory compliance in soft drinks and energy drinks.
  • Increased demand for clean-label, low-calorie products after Brexit.

Leading Beverage Acidulants Suppliers and Manufacturers

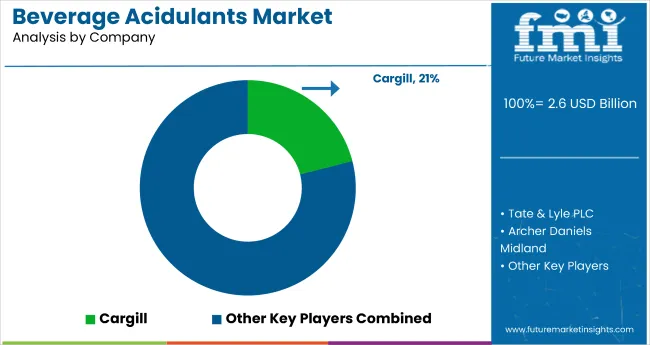
Beverage Acidulants Market Analysis By Company

The market is moderately consolidated, with leading players like Tate & Lyle PLC, Cargill, Northeast Pharmaceutical Group Co. Ltd., Batory Nutra, Archer Daniels Midland, and Corbion N.V. dominating the industry. These companies provide high-quality acidulants catering to sectors such as soft drinks, energy drinks, dairy-based beverages, and fruit juices. Tate & Lyle PLC is known for its expertise in natural and organic acidulants, while Cargill focuses on sustainable and clean-label solutions.

Northeast Pharmaceutical Group Co. Ltd. specializes in the supply of citric acid, while Batory Nutra offers a wide range of beverage acidulants for functional drinks. Other key players like DairyChem, Hexagon Overseas, Parry Enterprises, and FBC Industries contribute by providing specialized, high-performance beverage acidulants tailored to various beverage formulations, including organic and low-calorie options.

Beverage Acidulants Market Report Scope

Report Attributes Details
Market Size (2025) USD 2.6 billion
Projected Market Size (2035) USD 4.2 billion
CAGR (2025 to 2035) 4.9%
Base Year for Estimation 2024
Historical Period 2020 to 2024
Projections Period 2025 to 2035
Report Parameter USD billion for value/volume in metric tons
Product Types Analyzed Acetic Acid, Citric Acid, Fumaric Acid, Lactic Acid, Malic Acid, Phosphoric Acid, Tartaric Acid, Other Product Types (Succinic Acid, Gluconic Acid, Ascorbic Acid).
Form Analyzed Granule, Liquid, and Powder
Nature Analyzed Organic and Synthetic
Application Analyzed Alcoholic Beverages, Dairy-based Beverages, Energy Drinks, Fruit Juices and Concentrates, Soft Drinks
Regions Covered North America, Latin America, Europe, Asia Pacific, Middle East & Africa
Countries Covered United States, United Kingdom, Germany, France, Japan, China, India, Brazil, South Korea, Australia
Key Players Influencing the Market Tate & Lyle PLC, Cargill, Northeast Pharmaceutical Group Co. Ltd., Batory Nutra, Archer Daniels Midland, Corbion N.V., DairyChem, Hexagon Overseas, Parry Enterprises, FBC Industries
Additional Attributes Dollar sales by product type, market share by form, regional demand growth, regulatory impact, clean-label trends, competitive benchmarking

The Beverage Acidulants Market by Category

By Product Type:

  • Acetic Acid
  • Citric Acid
  • Fumaric Acid
  • Lactic Acid
  • Malic Acid
  • Phosphoric Acid
  • Tartaric Acid
  • Other Products

By Foam:

  • Granule
  • Liquid
  • Power

By Nature:

  • Organic
  • Synthetic

By Application:

  • Alcoholic Beverages
  • Dairy-based Beverages
  • Energy Drinks
  • Fruit Juices and Concentrates
  • Soft Drinks

By Region:

  • North America
  • Latin America
  • Europe
  • South Asia & Pacific
  • East Asia
  • Middle East & Africa (MEA)

Table of Content

  1. Executive Summary
    • Global Market Outlook
    • Demand-side Trends
    • Supply-side Trends
    • Technology Roadmap Analysis
    • Analysis and Recommendations
  2. Market Overview
    • Market Coverage / Taxonomy
    • Market Definition / Scope / Limitations
  3. Market Background
    • Market Dynamics
      • Drivers
      • Restraints
      • Opportunity
      • Trends
    • Scenario Forecast
      • Demand in Optimistic Scenario
      • Demand in Likely Scenario
      • Demand in Conservative Scenario
    • Opportunity Map Analysis
    • Product Life Cycle Analysis
    • Supply Chain Analysis
    • Investment Feasibility Matrix
    • Value Chain Analysis
    • PESTLE and Porter’s Analysis
    • Regulatory Landscape
    • Regional Parent Market Outlook
    • Production and Consumption Statistics
    • Import and Export Statistics
  4. Global Market Analysis 2020 to 2024 and Forecast, 2025 to 2035
    • Historical Market Size Value (USD Million) Analysis, 2020 to 2024
    • Current and Future Market Size Value (USD Million) Projections, 2025 to 2035
      • Y-o-Y Growth Trend Analysis
      • Absolute $ Opportunity Analysis
  5. Global Market Pricing Analysis 2020 to 2024 and Forecast 2025 to 2035
  6. Global Market Analysis 2020 to 2024 and Forecast 2025 to 2035, By Product Type
    • Introduction / Key Findings
    • Historical Market Size Value (USD Million) Analysis By Product Type , 2020 to 2024
    • Current and Future Market Size Value (USD Million) Analysis and Forecast By Product Type , 2025 to 2035
      • Acetic Acid
      • Citric Acid
      • Fumaric Acid
      • Lactic Acid
      • Malic Acid
      • Phosphoric Acid
      • Tartaric Acid
      • Other Products
    • Y-o-Y Growth Trend Analysis By Product Type , 2020 to 2024
    • Absolute $ Opportunity Analysis By Product Type , 2025 to 2035
  7. Global Market Analysis 2020 to 2024 and Forecast 2025 to 2035, By Foam
    • Introduction / Key Findings
    • Historical Market Size Value (USD Million) Analysis By Foam, 2020 to 2024
    • Current and Future Market Size Value (USD Million) Analysis and Forecast By Foam, 2025 to 2035
      • Granule
      • Liquid
      • Power
    • Y-o-Y Growth Trend Analysis By Foam, 2020 to 2024
    • Absolute $ Opportunity Analysis By Foam, 2025 to 2035
  8. Global Market Analysis 2020 to 2024 and Forecast 2025 to 2035, By Nature
    • Introduction / Key Findings
    • Historical Market Size Value (USD Million) Analysis By Nature, 2020 to 2024
    • Current and Future Market Size Value (USD Million) Analysis and Forecast By Nature, 2025 to 2035
      • Organic
      • Synthetic
    • Y-o-Y Growth Trend Analysis By Nature, 2020 to 2024
    • Absolute $ Opportunity Analysis By Nature, 2025 to 2035
  9. Global Market Analysis 2020 to 2024 and Forecast 2025 to 2035, By Application
    • Introduction / Key Findings
    • Historical Market Size Value (USD Million) Analysis By Application, 2020 to 2024
    • Current and Future Market Size Value (USD Million) Analysis and Forecast By Application, 2025 to 2035
      • Alcoholic Beverages
      • Dairy-based Beverages
      • Energy Drinks
      • Fruit Juices and Concentrates
      • Soft Drinks
    • Y-o-Y Growth Trend Analysis By Application, 2020 to 2024
    • Absolute $ Opportunity Analysis By Application, 2025 to 2035
  10. Global Market Analysis 2020 to 2024 and Forecast 2025 to 2035, By Region
    • Introduction
    • Historical Market Size Value (USD Million) Analysis By Region, 2020 to 2024
    • Current Market Size Value (USD Million) Analysis and Forecast By Region, 2025 to 2035
      • North America
      • Latin America
      • Western Europe
      • Eastern Europe
      • East Asia
      • South Asia and Pacific
      • Middle East & Africa
    • Market Attractiveness Analysis By Region
  11. North America Market Analysis 2020 to 2024 and Forecast 2025 to 2035, By Country
    • Historical Market Size Value (USD Million) Trend Analysis By Market Taxonomy, 2020 to 2024
    • Market Size Value (USD Million) Forecast By Market Taxonomy, 2025 to 2035
      • By Country
        • USA
        • Canada
        • Mexico
      • By Product Type
      • By Foam
      • By Nature
      • By Application
    • Market Attractiveness Analysis
      • By Country
      • By Product Type
      • By Foam
      • By Nature
      • By Application
    • Key Takeaways
  12. Latin America Market Analysis 2020 to 2024 and Forecast 2025 to 2035, By Country
    • Historical Market Size Value (USD Million) Trend Analysis By Market Taxonomy, 2020 to 2024
    • Market Size Value (USD Million) Forecast By Market Taxonomy, 2025 to 2035
      • By Country
        • Brazil
        • Chile
        • Rest of Latin America
      • By Product Type
      • By Foam
      • By Nature
      • By Application
    • Market Attractiveness Analysis
      • By Country
      • By Product Type
      • By Foam
      • By Nature
      • By Application
    • Key Takeaways
  13. Western Europe Market Analysis 2020 to 2024 and Forecast 2025 to 2035, By Country
    • Historical Market Size Value (USD Million) Trend Analysis By Market Taxonomy, 2020 to 2024
    • Market Size Value (USD Million) Forecast By Market Taxonomy, 2025 to 2035
      • By Country
        • Germany
        • UK
        • Italy
        • Spain
        • France
        • Nordic
        • BENELUX
        • Rest of Western Europe
      • By Product Type
      • By Foam
      • By Nature
      • By Application
    • Market Attractiveness Analysis
      • By Country
      • By Product Type
      • By Foam
      • By Nature
      • By Application
    • Key Takeaways
  14. Eastern Europe Market Analysis 2020 to 2024 and Forecast 2025 to 2035, By Country
    • Historical Market Size Value (USD Million) Trend Analysis By Market Taxonomy, 2020 to 2024
    • Market Size Value (USD Million) Forecast By Market Taxonomy, 2025 to 2035
      • By Country
        • Russia
        • Poland
        • Hungary
        • Balkan & Baltic
        • Rest of Eastern Europe
      • By Product Type
      • By Foam
      • By Nature
      • By Application
    • Market Attractiveness Analysis
      • By Country
      • By Product Type
      • By Foam
      • By Nature
      • By Application
    • Key Takeaways
  15. East Asia Market Analysis 2020 to 2024 and Forecast 2025 to 2035, By Country
    • Historical Market Size Value (USD Million) Trend Analysis By Market Taxonomy, 2020 to 2024
    • Market Size Value (USD Million) Forecast By Market Taxonomy, 2025 to 2035
      • By Country
        • China
        • Japan
        • South Korea
      • By Product Type
      • By Foam
      • By Nature
      • By Application
    • Market Attractiveness Analysis
      • By Country
      • By Product Type
      • By Foam
      • By Nature
      • By Application
    • Key Takeaways
  16. South Asia and Pacific Market Analysis 2020 to 2024 and Forecast 2025 to 2035, By Country
    • Historical Market Size Value (USD Million) Trend Analysis By Market Taxonomy, 2020 to 2024
    • Market Size Value (USD Million) Forecast By Market Taxonomy, 2025 to 2035
      • By Country
        • India
        • ASEAN
        • Australia & New Zealand
        • Rest of South Asia and Pacific
      • By Product Type
      • By Foam
      • By Nature
      • By Application
    • Market Attractiveness Analysis
      • By Country
      • By Product Type
      • By Foam
      • By Nature
      • By Application
    • Key Takeaways
  17. Middle East & Africa Market Analysis 2020 to 2024 and Forecast 2025 to 2035, By Country
    • Historical Market Size Value (USD Million) Trend Analysis By Market Taxonomy, 2020 to 2024
    • Market Size Value (USD Million) Forecast By Market Taxonomy, 2025 to 2035
      • By Country
        • Kingdom of Saudi Arabia
        • Other GCC Countries
        • Turkiye
        • South Africa
        • Other African Union
        • Rest of Middle East & Africa
      • By Product Type
      • By Foam
      • By Nature
      • By Application
    • Market Attractiveness Analysis
      • By Country
      • By Product Type
      • By Foam
      • By Nature
      • By Application
    • Key Takeaways
  18. Key Countries Market Analysis
    • USA
      • Pricing Analysis
      • Market Share Analysis, 2024
        • By Product Type
        • By Foam
        • By Nature
        • By Application
    • Canada
      • Pricing Analysis
      • Market Share Analysis, 2024
        • By Product Type
        • By Foam
        • By Nature
        • By Application
    • Mexico
      • Pricing Analysis
      • Market Share Analysis, 2024
        • By Product Type
        • By Foam
        • By Nature
        • By Application
    • Brazil
      • Pricing Analysis
      • Market Share Analysis, 2024
        • By Product Type
        • By Foam
        • By Nature
        • By Application
    • Chile
      • Pricing Analysis
      • Market Share Analysis, 2024
        • By Product Type
        • By Foam
        • By Nature
        • By Application
    • Germany
      • Pricing Analysis
      • Market Share Analysis, 2024
        • By Product Type
        • By Foam
        • By Nature
        • By Application
    • UK
      • Pricing Analysis
      • Market Share Analysis, 2024
        • By Product Type
        • By Foam
        • By Nature
        • By Application
    • Italy
      • Pricing Analysis
      • Market Share Analysis, 2024
        • By Product Type
        • By Foam
        • By Nature
        • By Application
    • Spain
      • Pricing Analysis
      • Market Share Analysis, 2024
        • By Product Type
        • By Foam
        • By Nature
        • By Application
    • France
      • Pricing Analysis
      • Market Share Analysis, 2024
        • By Product Type
        • By Foam
        • By Nature
        • By Application
    • India
      • Pricing Analysis
      • Market Share Analysis, 2024
        • By Product Type
        • By Foam
        • By Nature
        • By Application
    • ASEAN
      • Pricing Analysis
      • Market Share Analysis, 2024
        • By Product Type
        • By Foam
        • By Nature
        • By Application
    • Australia & New Zealand
      • Pricing Analysis
      • Market Share Analysis, 2024
        • By Product Type
        • By Foam
        • By Nature
        • By Application
    • China
      • Pricing Analysis
      • Market Share Analysis, 2024
        • By Product Type
        • By Foam
        • By Nature
        • By Application
    • Japan
      • Pricing Analysis
      • Market Share Analysis, 2024
        • By Product Type
        • By Foam
        • By Nature
        • By Application
    • South Korea
      • Pricing Analysis
      • Market Share Analysis, 2024
        • By Product Type
        • By Foam
        • By Nature
        • By Application
    • Russia
      • Pricing Analysis
      • Market Share Analysis, 2024
        • By Product Type
        • By Foam
        • By Nature
        • By Application
    • Poland
      • Pricing Analysis
      • Market Share Analysis, 2024
        • By Product Type
        • By Foam
        • By Nature
        • By Application
    • Hungary
      • Pricing Analysis
      • Market Share Analysis, 2024
        • By Product Type
        • By Foam
        • By Nature
        • By Application
    • Kingdom of Saudi Arabia
      • Pricing Analysis
      • Market Share Analysis, 2024
        • By Product Type
        • By Foam
        • By Nature
        • By Application
    • Turkiye
      • Pricing Analysis
      • Market Share Analysis, 2024
        • By Product Type
        • By Foam
        • By Nature
        • By Application
    • South Africa
      • Pricing Analysis
      • Market Share Analysis, 2024
        • By Product Type
        • By Foam
        • By Nature
        • By Application
  19. Market Structure Analysis
    • Competition Dashboard
    • Competition Benchmarking
    • Market Share Analysis of Top Players
      • By Regional
      • By Product Type
      • By Foam
      • By Nature
      • By Application
  20. Competition Analysis
    • Competition Deep Dive
      • Tate & Lyle PLC
        • Overview
        • Product Portfolio
        • Profitability by Market Segments (Product/Age /Sales Channel/Region)
        • Sales Footprint
        • Strategy Overview
          • Marketing Strategy
          • Product Strategy
          • Channel Strategy
      • Cargill
      • Northeast Pharmaceutical Group Co. Ltd.
      • Batory Nutra
      • Archer Daniels Midland
      • Corbion N.V.
      • DairyChem
      • Hexagon Overseas
      • Parry Enterprises
      • FBC Industries
  21. Assumptions & Acronyms Used
  22. Research Methodology

List of Tables

  • Table 1: Global Market Value (USD Million) Forecast by Region, 2020-2035
  • Table 2: Global Market Value (USD Million) Forecast by Product Type , 2020-2035
  • Table 3: Global Market Value (USD Million) Forecast by Foam, 2020-2035
  • Table 4: Global Market Value (USD Million) Forecast by Nature, 2020-2035
  • Table 5: Global Market Value (USD Million) Forecast by Application, 2020-2035
  • Table 6: North America Market Value (USD Million) Forecast by Country, 2020-2035
  • Table 7: North America Market Value (USD Million) Forecast by Product Type , 2020-2035
  • Table 8: North America Market Value (USD Million) Forecast by Foam, 2020-2035
  • Table 9: North America Market Value (USD Million) Forecast by Nature, 2020-2035
  • Table 10: North America Market Value (USD Million) Forecast by Application, 2020-2035
  • Table 11: Latin America Market Value (USD Million) Forecast by Country, 2020-2035
  • Table 12: Latin America Market Value (USD Million) Forecast by Product Type , 2020-2035
  • Table 13: Latin America Market Value (USD Million) Forecast by Foam, 2020-2035
  • Table 14: Latin America Market Value (USD Million) Forecast by Nature, 2020-2035
  • Table 15: Latin America Market Value (USD Million) Forecast by Application, 2020-2035
  • Table 16: Western Europe Market Value (USD Million) Forecast by Country, 2020-2035
  • Table 17: Western Europe Market Value (USD Million) Forecast by Product Type , 2020-2035
  • Table 18: Western Europe Market Value (USD Million) Forecast by Foam, 2020-2035
  • Table 19: Western Europe Market Value (USD Million) Forecast by Nature, 2020-2035
  • Table 20: Western Europe Market Value (USD Million) Forecast by Application, 2020-2035
  • Table 21: Eastern Europe Market Value (USD Million) Forecast by Country, 2020-2035
  • Table 22: Eastern Europe Market Value (USD Million) Forecast by Product Type , 2020-2035
  • Table 23: Eastern Europe Market Value (USD Million) Forecast by Foam, 2020-2035
  • Table 24: Eastern Europe Market Value (USD Million) Forecast by Nature, 2020-2035
  • Table 25: Eastern Europe Market Value (USD Million) Forecast by Application, 2020-2035
  • Table 26: East Asia Market Value (USD Million) Forecast by Country, 2020-2035
  • Table 27: East Asia Market Value (USD Million) Forecast by Product Type , 2020-2035
  • Table 28: East Asia Market Value (USD Million) Forecast by Foam, 2020-2035
  • Table 29: East Asia Market Value (USD Million) Forecast by Nature, 2020-2035
  • Table 30: East Asia Market Value (USD Million) Forecast by Application, 2020-2035
  • Table 31: South Asia and Pacific Market Value (USD Million) Forecast by Country, 2020-2035
  • Table 32: South Asia and Pacific Market Value (USD Million) Forecast by Product Type , 2020-2035
  • Table 33: South Asia and Pacific Market Value (USD Million) Forecast by Foam, 2020-2035
  • Table 34: South Asia and Pacific Market Value (USD Million) Forecast by Nature, 2020-2035
  • Table 35: South Asia and Pacific Market Value (USD Million) Forecast by Application, 2020-2035
  • Table 36: Middle East & Africa Market Value (USD Million) Forecast by Country, 2020-2035
  • Table 37: Middle East & Africa Market Value (USD Million) Forecast by Product Type , 2020-2035
  • Table 38: Middle East & Africa Market Value (USD Million) Forecast by Foam, 2020-2035
  • Table 39: Middle East & Africa Market Value (USD Million) Forecast by Nature, 2020-2035
  • Table 40: Middle East & Africa Market Value (USD Million) Forecast by Application, 2020-2035

List of Figures

  • Figure 1: Global Market Pricing Analysis
  • Figure 2: Global Market Value (USD Million) Forecast 2020-2035
  • Figure 3: Global Market Value (USD Million) Share and BPS Analysis by Region, 2025 and 2035
  • Figure 4: Global Market Y-o-Y Growth Comparison by Region, 2025-2035
  • Figure 5: Global Market Attractiveness Analysis by Region
  • Figure 6: North America Market Incremental Dollar Opportunity, 2025-2035
  • Figure 7: Latin America Market Incremental Dollar Opportunity, 2025-2035
  • Figure 8: Western Europe Market Incremental Dollar Opportunity, 2025-2035
  • Figure 9: Eastern Europe Market Incremental Dollar Opportunity, 2025-2035
  • Figure 10: East Asia Market Incremental Dollar Opportunity, 2025-2035
  • Figure 11: South Asia and Pacific Market Incremental Dollar Opportunity, 2025-2035
  • Figure 12: Middle East & Africa Market Incremental Dollar Opportunity, 2025-2035
  • Figure 13: North America Market Value Share and BPS Analysis by Country, 2025 and 2035
  • Figure 14: Latin America Market Value Share and BPS Analysis by Country, 2025 and 2035
  • Figure 15: Western Europe Market Value Share and BPS Analysis by Country, 2025 and 2035
  • Figure 16: Eastern Europe Market Value Share and BPS Analysis by Country, 2025 and 2035
  • Figure 17: East Asia Market Value Share and BPS Analysis by Country, 2025 and 2035
  • Figure 18: South Asia and Pacific Market Value Share and BPS Analysis by Country, 2025 and 2035
  • Figure 19: Middle East & Africa Market Value Share and BPS Analysis by Country, 2025 and 2035
  • Figure 20: Global Market - Tier Structure Analysis
  • Figure 21: Global Market - Company Share Analysis

Frequently Asked Questions

How big is the beverage acidulants market in 2025?

The global beverage acidulants market is estimated to be valued at USD 2.6 billion in 2025.

What will be the size of beverage acidulants market in 2035?

The market size for the beverage acidulants market is projected to reach USD 4.2 billion by 2035.

How much will be the beverage acidulants market growth between 2025 and 2035?

The beverage acidulants market is expected to grow at a 4.9% CAGR between 2025 and 2035.

What are the key product types in the beverage acidulants market?

The key product types in beverage acidulants market are acetic acid, citric acid, fumaric acid, lactic acid, malic acid, phosphoric acid, tartaric acid and other products.

Which foam segment to contribute significant share in the beverage acidulants market in 2025?

In terms of foam, granule segment to command 54.2% share in the beverage acidulants market in 2025.

Explore Similar Insights

Future Market Insights

Beverage Acidulants Market