Chelating / Sequestering Agents Market Size and Share Forecast Outlook 2025 to 2035

The Chelating / Sequestering Agents Market is expected to record a valuation of USD 1,952.1 million in 2025 and USD 4,023.1 million in 2035, with an increase of USD 2,071 million, which equals a growth of 193% over the decade. The overall expansion represents a CAGR of 7.5% and a 2X increase in market size.

During the first five-year period from 2025 to 2030, the market increases from USD 1,952.1 million to USD 2,802.4 million, adding USD 850.3 million, which accounts for 41% of the total decade growth. This phase records steady adoption in personal care manufacturing, premium cosmetics, and dermocosmetic products, driven by the rising demand for metal ion chelators, which capture 48.1% share in 2025. EDTA & derivatives dominate ingredient usage, representing 44.2% of sales by 2025.

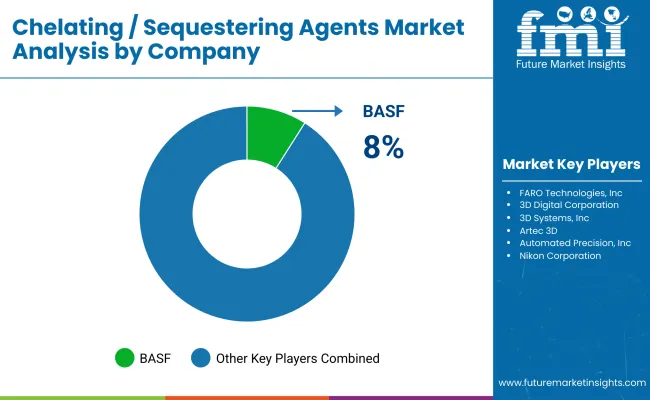
The second half from 2030 to 2035 contributes USD 1,220.7 million, equal to 59% of total growth, as the market jumps from USD 2,802.4 million to USD 4,023.1 million. This acceleration is powered by strong demand in Asia-Pacific, particularly India (14.1% CAGR) and China (12.5% CAGR), alongside Europe’s stable expansion. Biotechnology-derived chelators and sustainable alternatives gain traction, while free form delivery systems retain dominance with 55.7% share in 2025. BASF remains the leading global player with 8% share in 2025, though the market remains fragmented with 92% split among other manufacturers.
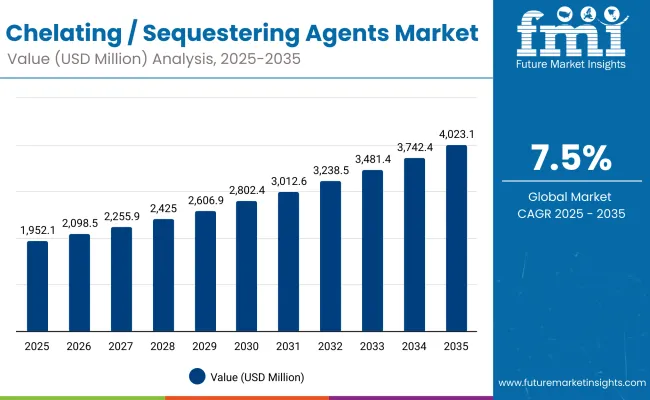
Quick Stats for Chelating / Sequestering Agents Market

  • Chelating / Sequestering Agents Market Value (2025): USD 1,952.1 million
  • Chelating / Sequestering Agents Market Forecast Value (2035): USD 4,023.1 million
  • Chelating / Sequestering Agents Market Forecast CAGR (2025 to 2035): 7.5%
  • Leading Segment in 2025 (by Functional Role): Metal ion chelators - 48.1% share
  • Key Growth Regions: Asia-Pacific (China CAGR 12.5%, India CAGR 14.1%), Europe, North America
  • Top Key Players: BASF, Nouryon, Clariant, Dow, Evonik, Ashland, Innospec, Seppic, Solvay, Jungbunzlauer

Chelating Sequestering Agents Market

Chelating / Sequestering Agents Market Key Takeaways

Metric Value
Chelating / Sequestering Agents Market Estimated Value in (2025E) USD 1,952.1 million
Chelating / Sequestering Agents Market Forecast Value in (2035F) USD 4,023.1 million
Forecast CAGR (2025 to 2035) 7.5%

From 2020 to 2024, the Chelating / Sequestering Agents Market grew steadily on the back of rising adoption in personal care, skin care, and household formulations, with demand concentrated in traditional chelators such as EDTA and citric acid & salts. During this period, suppliers of synthetic ingredients held the majority of revenue, while biotechnology-derived chelators accounted for a niche but emerging share. Differentiation was largely based on cost efficiency, stability, and formulation compatibility, with sustainable and bio-based options only beginning to surface in specialty cosmetics.

Looking forward, demand will expand to USD 1,952.1 million in 2025, and the revenue mix will shift significantly toward sustainable and biotechnology-derived chelators. By 2035, the market will more than double, driven by regulatory pressure on persistent compounds, consumer preference for clean-label products, and growth in Asia-Pacific markets. Traditional leaders such as BASF, Dow, and Evonikare pivoting toward greener portfolios, investing in biotechnology-based formulations, circular chemistry, and eco-certifications to remain competitive. Emerging players with strong sustainability credentials and COSMOS / ECOCERT-compliant solutions are gaining share. Competitive advantage is moving away from commodity chelators toward portfolio diversity, eco-compliance, and integration into premium personal care formulations.

Why the Chelating / Sequestering Agents Market is growing?

Growth in the market is being accelerated by the transition from synthetic chelators like EDTA toward biotechnology-derived and eco-certified alternatives. Regulatory restrictions on non-biodegradable agents in Europe and increasing consumer preference for clean-label cosmetics are pushing formulators to adopt natural and biodegradable chelators such as gluconates and bio-based citric salts. This creates new opportunities for companies innovating in sustainable chemistry, especially within premium personal care and dermocosmetic applications where eco-compliance is becoming a market differentiator.

The market is also benefiting from the rapid expansion of premium and dermocosmetic product lines, which demand advanced chelators for enhanced stability, efficacy, and compatibility with sensitive-skin formulations. Chelating agents are being increasingly incorporated in anti-aging serums, high-performance sunscreens, and microbiome-focused products to prevent metal ion interference and oxidative degradation. This premiumization trend is particularly strong in Asia-Pacific and Europe, where consumer spending on advanced skin and hair care solutions is fueling higher-value adoption of chelating/sequestering agents.

Segmental Analysis

The Chelating / Sequestering Agents Market is segmented by functional role, ingredient type, delivery system, physical form, application, end use, and region. By functional role, the market includes metal ion chelators, stabilizing agents, and hard-water neutralizers, each supporting stability and efficacy in formulations. Ingredient segmentation covers EDTA & derivatives, gluconates, citric acid & salts, and biotechnology-derived chelators, reflecting both traditional and sustainable options. Delivery systems include free form, pre-dispersed solutions, and powder concentrates, while physical forms span solutions/concentrates, powders, and granules. Applications are concentrated in skin care, hair care, bath & shower formulations, and color cosmetics, with end uses in personal care manufacturing, premium cosmetics, and dermocosmetic products. Regionally, the market spans North America, Europe, Asia-Pacific, Latin America, and the Middle East & Africa, with strong growth led by India, China, and Japan.
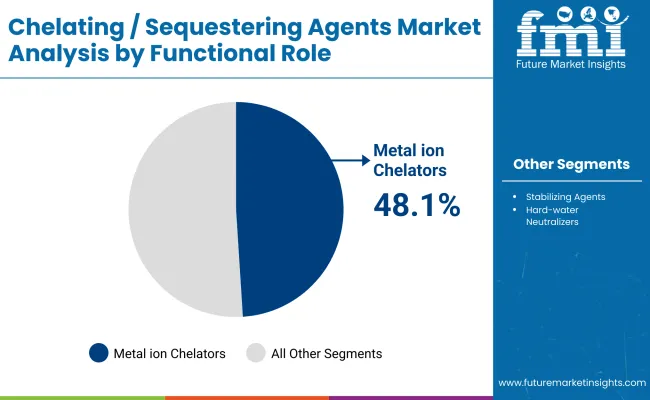
Insights into the Functional Role Segment with Metal Ion Chelators Leading in Market Share

Chelating Sequestering Agents Market By Functional Role

Functional Role Value Share % 2025
Metal ion chelators 48.1%
Others 51.9%

The metal ion chelators segment is projected to contribute 48.1% of the Chelating / Sequestering Agents Market revenue in 2025, maintaining its lead as the dominant functional category. This growth is driven by their essential role in stabilizing cosmetic and personal care formulations, preventing metal ion -induced degradation, and enhancing product efficacy. Their broad compatibility across skin care, hair care, and dermocosmetic products ensures consistent adoption.

The segment’s strength is also supported by regulatory-driven demand for effective yet safe alternatives, especially as consumers favor formulations free of contaminants and oxidative instability. With rising applications in premium cosmetics and biotechnology-enhanced formulations, metal ion chelators are expected to remain the backbone of the Chelating / Sequestering Agents Market throughout the forecast period.
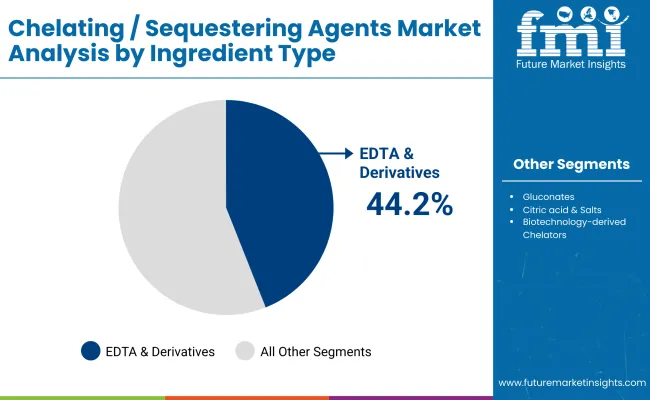
Insights into the Ingredient Type Segment with EDTA & Derivatives Leading in Market Share

Chelating Sequestering Agents Market By Ingredient Type

Ingredient Type Value Share % 2025
EDTA & derivatives 44.2%
Others 55.8%

The EDTA & derivatives segment is forecasted to hold 44.2% of the Chelating / Sequestering Agents Market share in 2025, led by its long-standing use as an efficient and cost-effective chelating agent. EDTA’s ability to bind metal ions, stabilize formulations, and extend shelf life has made it a staple across skin care, hair care, and bath & shower products. Its proven compatibility with diverse cosmetic formulations continues to secure its strong presence.

The segment’s growth is reinforced by widespread acceptance in both mass-market and premium personal care products, where consistent performance and regulatory familiarity drive adoption. At the same time, companies are investing in modified EDTA derivatives to reduce environmental persistence, ensuring compliance with tightening sustainability regulations. As a result, EDTA & derivatives are expected to retain their leadership role in the ingredient mix of chelating/sequestering agents, even as natural and biotechnology-based alternatives gain traction.
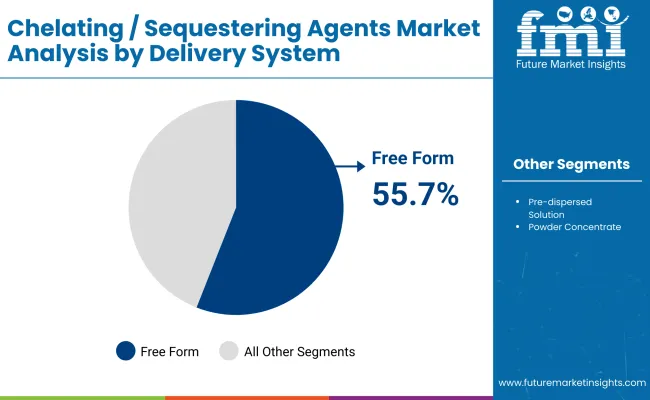
Insights into the Delivery System Segment with Free Form Leading in Market Share

Chelating Sequestering Agents Market By Delivery Syste,m

Delivery System Value Share % 2025
Free form 55.7%
Others 44.3%

The free form delivery system segment is projected to account for 55.7% of the Chelating / Sequestering Agents Market revenue in 2025, establishing it as the leading format. Free form chelators are widely favored for their flexibility in blending with diverse formulations, enabling ease of use in skin care, hair care, and bath & shower products. Their direct incorporation without additional processing steps ensures cost efficiency for manufacturers while supporting high-volume production.

The segment’s growth is further supported by increasing demand from premium and dermocosmetic brands that prioritize ingredient transparency and clean-label positioning. Free form delivery enables consistent dosing and predictable performance, which is critical for products requiring stability and precision. As cosmetic and personal care manufacturers accelerate new product launches, free form delivery systems are expected to retain their leadership due to their adaptability, cost-effectiveness, and broad formulation compatibility.

What are the Drivers, Restraints, and Key Trends of the Chelating / Sequestering Agents Market?

Rising equipment costs and data complexity challenge Chelating / Sequestering Agents adoption, even as Rising demand in premium cosmetics and dermocosmetics

The increasing adoption of high-performance cosmetics and dermocosmetic products is driving the demand for chelating agents. These ingredients prevent metal ion interference, enhance product stability, and improve the efficacy of active formulations, particularly in anti-aging serums, sunscreens, and skin microbiome-focused lines. Premium brands in Europe and Asia-Pacific are emphasizing chelator-enabled formulations to differentiate on product longevity and safety. As consumer spending rises on advanced personal care, chelating agents will play a central role in ensuring performance, fueling market growth across both premium and mass-market channels.

Transition toward eco-friendly and bio-based chelators

Regulatory restrictions on persistent compounds such as conventional EDTA are prompting the shift toward biodegradable and biotechnology-derived chelating agents. Consumers are increasingly seeking clean-label, sustainable, and eco-certified formulations, creating opportunities for gluconates, citric acid, and next-generation biobasedchelators. Multinationals are investing in green chemistry platforms and partnering with biotech startups to deliver effective alternatives that meet performance standards while reducing environmental footprint. This transition not only addresses compliance requirements but also enhances brand positioning, making eco-friendly chelators a major growth driver in both developed and emerging personal care markets.

Regulatory scrutiny on conventional chelators

A key restraint for the market is the tightening of regulatory norms concerning non-biodegradable chelating agents, particularly EDTA and its derivatives. These agents, while effective and cost-efficient, are under increasing scrutiny for their persistence in wastewater and potential environmental accumulation. In regions such as the EU, clean-label and eco-compliance requirements are intensifying pressure on formulators to limit or reformulate with alternatives. This creates added costs for manufacturers, particularly those dependent on legacy formulations, and could slow adoption where cost-sensitive consumer bases dominate, thereby restraining overall growth momentum.

Integration into multifunctional clean-label formulationsAn emerging trend is the integration of chelating agents into multifunctional cosmetic and personal care products that emphasize clean-label, vegan, and natural claims. Brands are using chelators not only to stabilize formulations but also to enhance consumer-perceived product safety and compatibility with sensitive skin. In premium skin care, chelators are being positioned alongside antioxidants, hyaluronic acid, and microbiome-balancing actives as part of holistic formulations. This aligns with consumer demand for fewer but higher-quality products. As multifunctionality becomes central to new launches, chelators are gaining visibility as indispensable supporting ingredients.
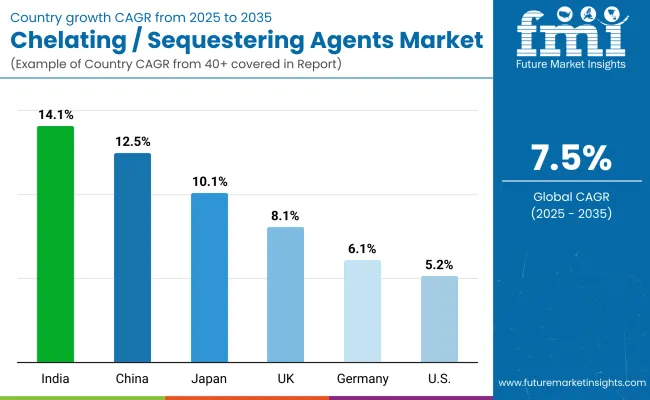
Analysis of Chelating / Sequestering Agents Market By Key Countries

Country Wise Chelating Sequestering Agents Market

Country Estimated CAGR (2025 to 2035)
China 12.5%
USA 5.2%
India 14.1%
UK 8.1%
Germany 6.1%
Japan 10.1%

The global Chelating / Sequestering Agents Market shows strong regional variation, shaped by regulatory frameworks, consumer demand patterns, and industrial formulation practices. Asia-Pacific leads the growth trajectory, anchored by India (14.1% CAGR) and China (12.5% CAGR), driven by rapid expansion in personal care manufacturing, rising demand for premium cosmetics, and a shift toward eco-friendly ingredients. India benefits from strong domestic consumption and export-oriented cosmetic production, while China’s market growth is propelled by regulatory encouragement of sustainable and biodegradable raw materials.

Europe maintains a solid growth profile, with the UK (8.1% CAGR) and Germany (6.1% CAGR) supported by stricter compliance with sustainability standards and clean-label mandates. Regulatory frameworks under the EU drive adoption of bio-based alternatives and innovation in gluconates and citric acid chelators. Japan (10.1% CAGR) demonstrates robust demand for dermocosmetic and sensitive-skin formulations, reflecting consumer preference for biotech-driven ingredients. In contrast, the USA (5.2% CAGR) shows steadier growth due to market maturity, with gradual shifts toward biotechnology-derived chelators driven by clean-label positioning and premium product launches.
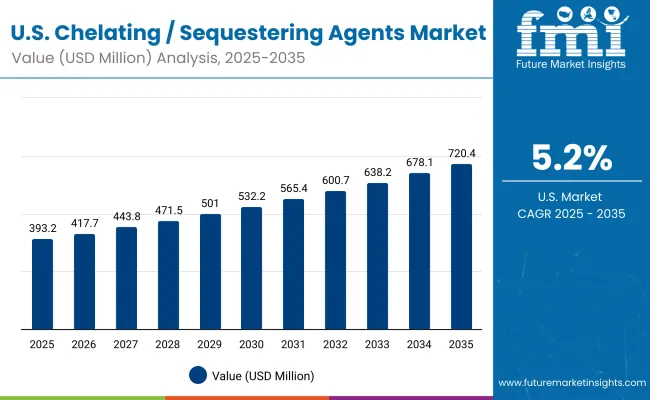
Sales Outlook for Chelating / Sequestering Agents in the United States

Usa Chelating Sequestering Agents Market

Year USA Chelating / Sequestering Agents Market (USD Million)
2025 393.25
2026 417.79
2027 443.87
2028 471.57
2029 501.00
2030 532.26
2031 565.48
2032 600.77
2033 638.26
2034 678.09
2035 720.41

The Chelating / Sequestering Agents Market in the United States is projected to grow at a CAGR of 5.2% (2025 -2035), driven by rising demand for safe, stable, and multifunctional cosmetic formulations. Regulatory compliance with FDA standards and heightened consumer focus on clean-label claims are prompting manufacturers to adopt chelators to ensure product stability and safety. The use of metal ion chelators is especially strong in hair care and skin care categories, where preventing oxidative damage is critical. Premium brands are reformulating with biodegradable and eco-friendly alternatives, further expanding market opportunities.

  • Hair care and skin care drive the largest share of USA chelating agent applications.
  • Regulatory compliance with clean-label and eco-certification frameworks is accelerating adoption.
  • Biotechnology-derived chelators are gaining momentum, creating growth opportunities in dermocosmetic and premium cosmetic launches.

Growth and Expansion Outlook for Chelating / Sequestering Agents Market in the United Kingdom

The Chelating / Sequestering Agents Market in the United Kingdom is expected to grow at a CAGR of 8.1% (2025 -2035), supported by rising adoption in premium cosmetics, dermocosmetic formulations, and clean-label personal care products. Consumer demand for transparency and eco-certified products is fueling the replacement of traditional EDTA with citric acid, gluconates, and biotechnology-derived chelators. Multinational and regional brands are leveraging these agents to enhance formulation stability, prevent oxidative degradation, and meet EU/UK regulatory standards on sustainability. Academic collaboration and innovation funding for green chemistry are further encouraging new product development, strengthening the UK’s role as a hub for clean-label beauty innovations.

  • Premium cosmetics and dermocosmetic launches drive chelator adoption across major beauty brands.
  • Regulatory alignment with EU standards pushes reformulation using biodegradable alternatives.
  • Academic-industry partnerships accelerate innovation in biotechnology-derived chelators.

Growth and Expansion Outlook for Chelating / Sequestering Agents Market in India

India is witnessing rapid growth in the Chelating / Sequestering Agents Market, which is forecast to expand at a CAGR of 14.1% through 2035, the highest among key countries. Strong demand is being driven by the booming personal care and cosmetics sector, where both multinational and domestic brands are expanding production facilities to meet rising consumer spending. MSMEs and tier-2 city manufacturers are increasingly adopting chelating agents to improve formulation stability and product quality in affordable skincare and hair care lines. The regulatory environment is also evolving, with greater emphasis on eco-friendly and biodegradable chelators, pushing companies to transition away from legacy EDTA-based solutions.

  • Tier-2 city manufacturers are adopting chelators for cost-effective skin and hair care formulations.
  • Domestic and multinational cosmetics brands are driving demand through product innovation and exports.
  • Biodegradable and bio-based chelators are gaining traction due to regulatory and consumer pressure.

Sales Outlook for Chelating / Sequestering Agents in China

The Chelating / Sequestering Agents Market in China is expected to grow at a CAGR of 12.5% (2025 -2035), one of the fastest among major economies. Growth is driven by strong expansion in the cosmetics and personal care industry, where chelators are vital for stabilizing advanced skin care and color cosmetic formulations. Domestic manufacturers are rapidly scaling production, while international brands are localizing clean-label product lines to align with consumer preference for safe, eco-friendly ingredients. Government initiatives promoting sustainable chemistry and stricter cosmetic safety standards are accelerating the shift toward biodegradable and biotechnology-derived chelators, creating opportunities for both local and global suppliers.
  • Cosmetics and skin care demand drives large-scale adoption of chelators in premium and mass-market products.
  • Domestic manufacturers expand market reach with competitively priced formulations targeting young consumers.
  • Policy support for sustainable chemistry accelerates the adoption of eco-friendly chelating solutions.

In-depth Analysis of Chelating / Sequestering Agents in Germany

Europe Chelating Sequestering Agents Market

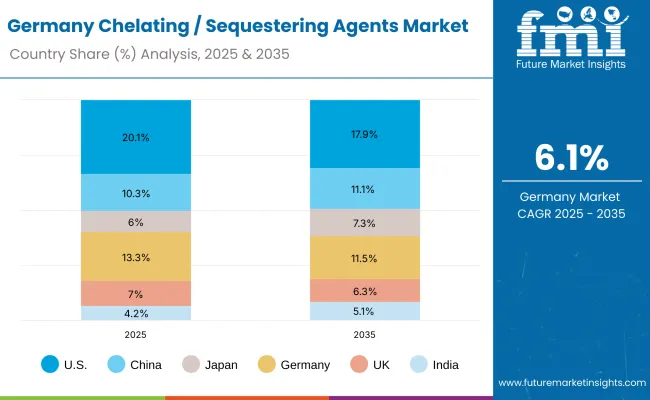
Country 2025 Share (%)
USA 20.1%
China 10.3%
Japan 6.0%
Germany 13.3%
UK 7.0%
India 4.2%
Country 2035 Share (%)
USA 17.9%
China 11.1%
Japan 7.3%
Germany 11.5%
UK 6.3%
India 5.1%

The Chelating / Sequestering Agents Market in Germany is projected to grow at a CAGR of 6.1% (2025 -2035), supported by its role as a hub for high-quality personal care and cosmetics manufacturing. German formulators are increasingly integrating chelating agents into dermocosmetic products and premium skin care lines, ensuring stability, safety, and compliance with strict EU regulatory standards. A strong push toward biodegradable and eco-certified chelators is accelerating, with citric acid, gluconates, and biotechnology-based solutions gaining traction as replacements for EDTA. Germany’s leadership in green chemistry innovation and its emphasis on clean-label positioning are further strengthening adoption.
  • Premium and dermocosmetic brands anchor chelator demand, ensuring product stability and safety.
  • EU regulatory compliance is driving the transition toward biodegradable and eco-certified chelators.
  • Green chemistry innovation supports development of next-generation bio-based chelating solutions.

Growth Outlook for Chelating / Sequestering Agents Market in USA

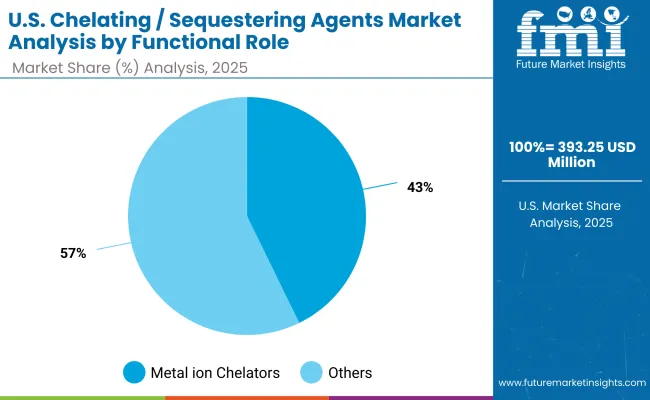
Usa Chelating Sequestering Agents Market By Functional Role

USA By Functional Role Value Share % 2025
Metal ion chelators 42.8%
Others 57.2%

The Chelating / Sequestering Agents Market in the United States is projected to grow steadily, reaching USD 720.41 million by 2035, up from USD 393.25 million in 2025, reflecting a CAGR of 5.2%. Growth is driven by personal care and dermocosmetic product launches, where chelators are used to stabilize formulations and prevent oxidative degradation. While traditional EDTA continues to dominate, the market is gradually transitioning toward citric acid, gluconates, and biotechnology-derived alternatives as sustainability regulations tighten. USA consumers’ strong demand for fragrance-free, dermatologist-tested, and clean-label products further strengthens the outlook for eco-friendly chelating solutions.
  • USA market share in global chelating agents: 20.1% in 2025 → 17.9% in 2035
  • Metal ion chelators hold 42.8% of USA market value in 2025
  • Growth supported by clean-label and eco-certified product adoption in personal care

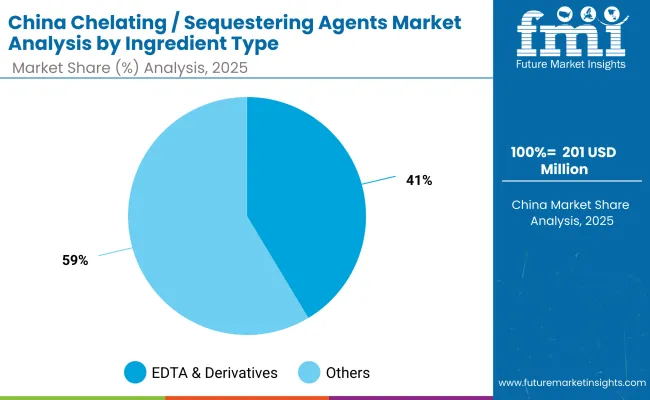
Opportunity Analysis of China Chelating / Sequestering Agents Market

China Chelating Sequestering Agents Market

China By Ingredient Type Value Share % 2025
EDTA & derivatives 41.4%
Others 58.6%

The Chelating / Sequestering Agents Market in China is forecast to expand rapidly, growing at a CAGR of 12.5% (2025 -2035), supported by the country’s role as one of the world’s largest producers and consumers of cosmetics. A major opportunity lies in the shift from EDTA toward biodegradable and biotechnology-derived chelators, aligning with tightening regulatory standards and consumer demand for eco-friendly formulations. Domestic brands are actively reformulating with citric acid and gluconates, while international companies are localizing clean-label products to meet rising demand from urban middle-class consumers. The integration of chelating agents in skin brightening, anti-aging, and microbiome-friendly formulations positions China as a growth hotspot for both global suppliers and domestic innovators.
  • Market size for China in 2025: USD 201 million
  • Share of EDTA & derivatives: 41.4% in 2025
  • Eco-certified and bio-based chelators are the largest growth opportunity due to sustainability regulations

Competitive Landscape of Chelating / Sequestering Agents Market

Chelating Sequestering Agents Market By Company

Company Global Value Share 2025
BASF 8.0%
Others 92.0%

The Chelating / Sequestering Agents Market is moderately fragmented, with a mix of global chemical giants, regional suppliers, and specialized innovators competing across diverse applications in personal care, cosmetics, and industrial formulations. BASF leads with an 8% global share, leveraging its broad chelator portfolio, extensive distribution, and focus on sustainable chemistry. Other multinational players such as Nouryon, Dow, Evonik, Clariant, and Solvay are expanding their presence through eco-friendly chelating solutions and biotechnology-driven alternatives that align with rising regulatory and consumer sustainability demands.

Mid-sized companies like Innospec, Seppic, and Jungbunzlauer are strengthening their positions by offering application-specific solutions, particularly in premium cosmetics, dermocosmetics, and natural product formulations. These players focus on clean-label and eco-certified chelators such as gluconates and citric acid derivatives to capture niche segments. Competitive differentiation is increasingly shifting from commodity EDTA-based products toward biodegradable, bio-based, and multifunctional chelators that deliver added value in stability, safety, and sustainability.

Innovation pipelines are focused on biotechnology-derived chelators, circular chemistry approaches, and compliance with COSMOS/ECOCERT standards, signaling a clear transition toward next-generation solutions. The ability to balance cost efficiency with environmental compliance will define long-term leadership, as consumer-facing brands demand greener ingredient portfolios from their suppliers.

Key Developments in Chelating / Sequestering Agents Market

  • On March 3, 2025, BASF announced the launch of a new line of biodegradable chelating agents targeting premium personal care formulations. The portfolio, designed to replace conventional EDTA, is COSMOS- and ECOCERT-compliant, reflecting the company’s broader strategy to align with sustainability-driven demand in Europe and Asia.
  • On July 22, 2025, Clariant unveiled a partnership with a leading Asian cosmetics manufacturer to introduce biotechnology-derived chelators for use in dermocosmetic products. The collaboration focuses on combining chelators with bio-actives to improve stability in sensitive-skin formulations, reinforcing Clariant’s push into high-value personal care markets.

Scope of the Report

Item Value
Quantitative Units USD 1,952.1 Million
Functional Role Metal ion chelators , Stabilizing agents, Hard-water neutralizers
I ngredient Type EDTA & derivatives, Gluconates, Citric acid & salts, Biotechnology-derived chelators
Delivery System Free form, Pre-dispersed solution, Powder concentrate
Physical Form Solution/concentrate, Powder, Granules
Application Skin care products, Hair care products, Bath & shower formulations, Color cosmetics
End Use Personal care manufacturing, Premium cosmetics, Dermocosmetic products
Regions Covered North America, Europe, Asia-Pacific, Latin America, Middle East & Africa
Country Covered United States, Canada, Germany, France, United Kingdom, China, Japan, India, Brazil, South Africa
Key Companies Profiled FARO Technologies, Inc., 3D Digital Corporation, 3D Systems, Inc., Autodesk, Inc., Artec 3D, Automated Precision, Inc. (API), Carl Zeiss Optotechnik GmbH, Creaform Inc., Direct Dimensions Inc., GOM GmbH, Hexagon AB, Konica Minolta, Inc., NextEngine Inc., Nikon Corporation, OGI Systems Ltd, and ShapeGrabber
Additional Attributes BASF, Nouryon , Clariant , Dow, Evonik , Ashland, Innospec , Seppic , Solvay, Jungbunzlauer

Key Segments

By Ingredient Type:

  • EDTA & derivatives
  • Gluconates
  • Citric acid & salts
  • Biotechnology-derived chelators

By Delivery System:

  • Free form
  • Pre-dispersed solution
  • Powder concentrate

By Physical Form:

  • Solution/concentrate
  • Powder
  • Granules

By Application:

  • Skin care products
  • Hair care products
  • Bath & shower formulations
  • Color cosmetics

Table of Content

  1. Executive Summary
    • Global Market Outlook
    • Demand-side Trends
    • Supply-side Trends
    • Technology Roadmap Analysis
    • Analysis and Recommendations
  2. Market Overview
    • Market Coverage / Taxonomy
    • Market Definition / Scope / Limitations
  3. Market Background
    • Market Dynamics
      • Drivers
      • Restraints
      • Opportunity
      • Trends
    • Scenario Forecast
      • Demand in Optimistic Scenario
      • Demand in Likely Scenario
      • Demand in Conservative Scenario
    • Opportunity Map Analysis
    • Product Life Cycle Analysis
    • Supply Chain Analysis
      • Supply Side Participants and their Roles
        • Producers
        • Mid-Level Participants (Traders/ Agents/ Brokers)
        • Wholesalers and Distributors
      • Value Added and Value Created at Node in the Supply Chain
      • List of Raw Material Suppliers
      • List of Existing and Potential Buyer’s
    • Investment Feasibility Matrix
    • Value Chain Analysis
      • Profit Margin Analysis
      • Wholesalers and Distributors
      • Retailers
    • PESTLE and Porter’s Analysis
    • Regulatory Landscape
      • By Key Regions
      • By Key Countries
    • Regional Parent Market Outlook
    • Production and Consumption Statistics
    • Import and Export Statistics
  4. Global Market Analysis 2020 to 2024 and Forecast, 2025 to 2035
    • Historical Market Size Value (USD Million) & Volume (Units) Analysis, 2020 to 2024
    • Current and Future Market Size Value (USD Million) & Volume (Units) Projections, 2025 to 2035
      • Y-o-Y Growth Trend Analysis
      • Absolute $ Opportunity Analysis
  5. Global Market Analysis 2020 to 2024 and Forecast 2025 to 2035, By Functional Role
    • Introduction / Key Findings
    • Historical Market Size Value (USD Million) & Volume (Units) Analysis By Functional Role, 2020 to 2024
    • Current and Future Market Size Value (USD Million) & Volume (Units) Analysis and Forecast By Functional Role, 2025 to 2035
      • Metal ion chelators
      • Stabilizing agents
      • Hard-water neutralizers
    • Y-o-Y Growth Trend Analysis By Functional Role, 2020 to 2024
    • Absolute $ Opportunity Analysis By Functional Role, 2025 to 2035
  6. Global Market Analysis 2020 to 2024 and Forecast 2025 to 2035, By Ingredient Type
    • Introduction / Key Findings
    • Historical Market Size Value (USD Million) & Volume (Units) Analysis By Ingredient Type, 2020 to 2024
    • Current and Future Market Size Value (USD Million) & Volume (Units) Analysis and Forecast By Ingredient Type, 2025 to 2035
      • EDTA & derivatives
      • Gluconates
      • Citric acid & salts
      • Biotechnology-derived chelators
    • Y-o-Y Growth Trend Analysis By Ingredient Type, 2020 to 2024
    • Absolute $ Opportunity Analysis By Ingredient Type, 2025 to 2035
  7. Global Market Analysis 2020 to 2024 and Forecast 2025 to 2035, By Delivery System
    • Introduction / Key Findings
    • Historical Market Size Value (USD Million) & Volume (Units) Analysis By Delivery System, 2020 to 2024
    • Current and Future Market Size Value (USD Million) & Volume (Units) Analysis and Forecast By Delivery System, 2025 to 2035
      • Free form
      • Pre-dispersed solution
      • Powder concentrate
    • Y-o-Y Growth Trend Analysis By Delivery System, 2020 to 2024
    • Absolute $ Opportunity Analysis By Delivery System, 2025 to 2035
  8. Global Market Analysis 2020 to 2024 and Forecast 2025 to 2035, By Physical Form
    • Introduction / Key Findings
    • Historical Market Size Value (USD Million) & Volume (Units) Analysis By Physical Form, 2020 to 2024
    • Current and Future Market Size Value (USD Million) & Volume (Units) Analysis and Forecast By Physical Form, 2025 to 2035
      • Solution/concentrate
      • Powder
      • Granules
    • Y-o-Y Growth Trend Analysis By Physical Form, 2020 to 2024
    • Absolute $ Opportunity Analysis By Physical Form, 2025 to 2035
  9. Global Market Analysis 2020 to 2024 and Forecast 2025 to 2035, By Application
    • Introduction / Key Findings
    • Historical Market Size Value (USD Million) & Volume (Units) Analysis By Application, 2020 to 2024
    • Current and Future Market Size Value (USD Million) & Volume (Units) Analysis and Forecast By Application, 2025 to 2035
      • Skin care products
      • Hair care products
      • Bath & shower formulations
      • Color cosmetics
    • Y-o-Y Growth Trend Analysis By Application, 2020 to 2024
    • Absolute $ Opportunity Analysis By Application, 2025 to 2035
  10. Global Market Analysis 2020 to 2024 and Forecast 2025 to 2035, By End Use
    • Introduction / Key Findings
    • Historical Market Size Value (USD Million) & Volume (Units) Analysis By End Use, 2020 to 2024
    • Current and Future Market Size Value (USD Million) & Volume (Units) Analysis and Forecast By End Use, 2025 to 2035
      • Personal care manufacturing
      • Premium cosmetics
      • Dermocosmetic products
    • Y-o-Y Growth Trend Analysis By End Use, 2020 to 2024
    • Absolute $ Opportunity Analysis By End Use, 2025 to 2035
  11. Global Market Analysis 2020 to 2024 and Forecast 2025 to 2035, By Region
    • Introduction
    • Historical Market Size Value (USD Million) & Volume (Units) Analysis By Region, 2020 to 2024
    • Current Market Size Value (USD Million) & Volume (Units) Analysis and Forecast By Region, 2025 to 2035
      • North America
      • Latin America
      • Europe
      • East Asia
      • South Asia & Pacific
      • Middle East and Africa
    • Market Attractiveness Analysis By Region
  12. North America Market Analysis 2020 to 2024 and Forecast 2025 to 2035, By Country
    • Historical Market Size Value (USD Million) & Volume (Units) Trend Analysis By Market Taxonomy, 2020 to 2024
    • Market Size Value (USD Million) & Volume (Units) Forecast By Market Taxonomy, 2025 to 2035
      • By Country
        • USA
        • Canada
      • By Functional Role
      • By Ingredient Type
      • By Delivery System
      • By Physical Form
      • By Application
      • By End Use
    • Market Attractiveness Analysis
      • By Country
      • By Functional Role
      • By Ingredient Type
      • By Delivery System
      • By Physical Form
      • By Application
      • By End Use
    • Key Takeaways
  13. Latin America Market Analysis 2020 to 2024 and Forecast 2025 to 2035, By Country
    • Historical Market Size Value (USD Million) & Volume (Units) Trend Analysis By Market Taxonomy, 2020 to 2024
    • Market Size Value (USD Million) & Volume (Units) Forecast By Market Taxonomy, 2025 to 2035
      • By Country
        • Brazil
        • Mexico
        • Colombia
        • Rest of Latin America
      • By Functional Role
      • By Ingredient Type
      • By Delivery System
      • By Physical Form
      • By Application
      • By End Use
    • Market Attractiveness Analysis
      • By Country
      • By Functional Role
      • By Ingredient Type
      • By Delivery System
      • By Physical Form
      • By Application
      • By End Use
    • Key Takeaways
  14. Europe Market Analysis 2020 to 2024 and Forecast 2025 to 2035, By Country
    • Historical Market Size Value (USD Million) & Volume (Units) Trend Analysis By Market Taxonomy, 2020 to 2024
    • Market Size Value (USD Million) & Volume (Units) Forecast By Market Taxonomy, 2025 to 2035
      • By Country
        • Germany
        • UK
        • France
        • Italy
        • Spain
        • Belgium
        • Netherlands
        • Nordic
        • Switzerland
        • Russia
        • Poland
        • Rest of Europe
      • By Functional Role
      • By Ingredient Type
      • By Delivery System
      • By Physical Form
      • By Application
      • By End Use
    • Market Attractiveness Analysis
      • By Country
      • By Functional Role
      • By Ingredient Type
      • By Delivery System
      • By Physical Form
      • By Application
      • By End Use
    • Key Takeaways
  15. East Asia Market Analysis 2020 to 2024 and Forecast 2025 to 2035, By Country
    • Historical Market Size Value (USD Million) & Volume (Units) Trend Analysis By Market Taxonomy, 2020 to 2024
    • Market Size Value (USD Million) & Volume (Units) Forecast By Market Taxonomy, 2025 to 2035
      • By Country
        • China
        • Japan
        • South Korea
      • By Functional Role
      • By Ingredient Type
      • By Delivery System
      • By Physical Form
      • By Application
      • By End Use
    • Market Attractiveness Analysis
      • By Country
      • By Functional Role
      • By Ingredient Type
      • By Delivery System
      • By Physical Form
      • By Application
      • By End Use
    • Key Takeaways
  16. South Asia & Pacific Market Analysis 2020 to 2024 and Forecast 2025 to 2035, By Country
    • Historical Market Size Value (USD Million) & Volume (Units) Trend Analysis By Market Taxonomy, 2020 to 2024
    • Market Size Value (USD Million) & Volume (Units) Forecast By Market Taxonomy, 2025 to 2035
      • By Country
        • India
        • Thailand
        • Malaysia
        • Indonesia
        • Singapore
        • Vietnam
        • Australia
        • New Zealand
        • Rest of South Asia
      • By Functional Role
      • By Ingredient Type
      • By Delivery System
      • By Physical Form
      • By Application
      • By End Use
    • Market Attractiveness Analysis
      • By Country
      • By Functional Role
      • By Ingredient Type
      • By Delivery System
      • By Physical Form
      • By Application
      • By End Use
    • Key Takeaways
  17. Middle East and Africa Market Analysis 2020 to 2024 and Forecast 2025 to 2035, By Country
    • Historical Market Size Value (USD Million) & Volume (Units) Trend Analysis By Market Taxonomy, 2020 to 2024
    • Market Size Value (USD Million) & Volume (Units) Forecast By Market Taxonomy, 2025 to 2035
      • By Country
        • Turkey
        • UAE
        • Saudi Arabia
        • Israel
        • Other GCC Countries
        • North Africa
        • South Africa
      • By Functional Role
      • By Ingredient Type
      • By Delivery System
      • By Physical Form
      • By Application
      • By End Use
    • Market Attractiveness Analysis
      • By Country
      • By Functional Role
      • By Ingredient Type
      • By Delivery System
      • By Physical Form
      • By Application
      • By End Use
    • Key Takeaways
  18. Key Countries Market Analysis
    • USA
      • Pricing Analysis
      • Market Share Analysis, 2024
        • By Functional Role
        • By Ingredient Type
        • By Delivery System
        • By Physical Form
        • By Application
        • By End Use
    • Canada
      • Pricing Analysis
      • Market Share Analysis, 2024
        • By Functional Role
        • By Ingredient Type
        • By Delivery System
        • By Physical Form
        • By Application
        • By End Use
    • Brazil
      • Pricing Analysis
      • Market Share Analysis, 2024
        • By Functional Role
        • By Ingredient Type
        • By Delivery System
        • By Physical Form
        • By Application
        • By End Use
    • Mexico
      • Pricing Analysis
      • Market Share Analysis, 2024
        • By Functional Role
        • By Ingredient Type
        • By Delivery System
        • By Physical Form
        • By Application
        • By End Use
    • Colombia
      • Pricing Analysis
      • Market Share Analysis, 2024
        • By Functional Role
        • By Ingredient Type
        • By Delivery System
        • By Physical Form
        • By Application
        • By End Use
    • Germany
      • Pricing Analysis
      • Market Share Analysis, 2024
        • By Functional Role
        • By Ingredient Type
        • By Delivery System
        • By Physical Form
        • By Application
        • By End Use
    • UK
      • Pricing Analysis
      • Market Share Analysis, 2024
        • By Functional Role
        • By Ingredient Type
        • By Delivery System
        • By Physical Form
        • By Application
        • By End Use
    • France
      • Pricing Analysis
      • Market Share Analysis, 2024
        • By Functional Role
        • By Ingredient Type
        • By Delivery System
        • By Physical Form
        • By Application
        • By End Use
    • Italy
      • Pricing Analysis
      • Market Share Analysis, 2024
        • By Functional Role
        • By Ingredient Type
        • By Delivery System
        • By Physical Form
        • By Application
        • By End Use
    • Spain
      • Pricing Analysis
      • Market Share Analysis, 2024
        • By Functional Role
        • By Ingredient Type
        • By Delivery System
        • By Physical Form
        • By Application
        • By End Use
    • Belgium
      • Pricing Analysis
      • Market Share Analysis, 2024
        • By Functional Role
        • By Ingredient Type
        • By Delivery System
        • By Physical Form
        • By Application
        • By End Use
    • Netherlands
      • Pricing Analysis
      • Market Share Analysis, 2024
        • By Functional Role
        • By Ingredient Type
        • By Delivery System
        • By Physical Form
        • By Application
        • By End Use
    • Nordic
      • Pricing Analysis
      • Market Share Analysis, 2024
        • By Functional Role
        • By Ingredient Type
        • By Delivery System
        • By Physical Form
        • By Application
        • By End Use
    • Switzerland
      • Pricing Analysis
      • Market Share Analysis, 2024
        • By Functional Role
        • By Ingredient Type
        • By Delivery System
        • By Physical Form
        • By Application
        • By End Use
    • Russia
      • Pricing Analysis
      • Market Share Analysis, 2024
        • By Functional Role
        • By Ingredient Type
        • By Delivery System
        • By Physical Form
        • By Application
        • By End Use
    • Poland
      • Pricing Analysis
      • Market Share Analysis, 2024
        • By Functional Role
        • By Ingredient Type
        • By Delivery System
        • By Physical Form
        • By Application
        • By End Use
    • China
      • Pricing Analysis
      • Market Share Analysis, 2024
        • By Functional Role
        • By Ingredient Type
        • By Delivery System
        • By Physical Form
        • By Application
        • By End Use
    • Japan
      • Pricing Analysis
      • Market Share Analysis, 2024
        • By Functional Role
        • By Ingredient Type
        • By Delivery System
        • By Physical Form
        • By Application
        • By End Use
    • South Korea
      • Pricing Analysis
      • Market Share Analysis, 2024
        • By Functional Role
        • By Ingredient Type
        • By Delivery System
        • By Physical Form
        • By Application
        • By End Use
    • India
      • Pricing Analysis
      • Market Share Analysis, 2024
        • By Functional Role
        • By Ingredient Type
        • By Delivery System
        • By Physical Form
        • By Application
        • By End Use
    • Thailand
      • Pricing Analysis
      • Market Share Analysis, 2024
        • By Functional Role
        • By Ingredient Type
        • By Delivery System
        • By Physical Form
        • By Application
        • By End Use
    • Indonesia
      • Pricing Analysis
      • Market Share Analysis, 2024
        • By Functional Role
        • By Ingredient Type
        • By Delivery System
        • By Physical Form
        • By Application
        • By End Use
    • Australia
      • Pricing Analysis
      • Market Share Analysis, 2024
        • By Functional Role
        • By Ingredient Type
        • By Delivery System
        • By Physical Form
        • By Application
        • By End Use
    • New Zealand
      • Pricing Analysis
      • Market Share Analysis, 2024
        • By Functional Role
        • By Ingredient Type
        • By Delivery System
        • By Physical Form
        • By Application
        • By End Use
    • Turkey
      • Pricing Analysis
      • Market Share Analysis, 2024
        • By Functional Role
        • By Ingredient Type
        • By Delivery System
        • By Physical Form
        • By Application
        • By End Use
    • UAE
      • Pricing Analysis
      • Market Share Analysis, 2024
        • By Functional Role
        • By Ingredient Type
        • By Delivery System
        • By Physical Form
        • By Application
        • By End Use
    • Saudi Arabia
      • Pricing Analysis
      • Market Share Analysis, 2024
        • By Functional Role
        • By Ingredient Type
        • By Delivery System
        • By Physical Form
        • By Application
        • By End Use
    • Israel
      • Pricing Analysis
      • Market Share Analysis, 2024
        • By Functional Role
        • By Ingredient Type
        • By Delivery System
        • By Physical Form
        • By Application
        • By End Use
    • North Africa
      • Pricing Analysis
      • Market Share Analysis, 2024
        • By Functional Role
        • By Ingredient Type
        • By Delivery System
        • By Physical Form
        • By Application
        • By End Use
    • South Africa
      • Pricing Analysis
      • Market Share Analysis, 2024
        • By Functional Role
        • By Ingredient Type
        • By Delivery System
        • By Physical Form
        • By Application
        • By End Use
  19. Market Structure Analysis
    • Competition Dashboard
    • Competition Benchmarking
    • Market Share Analysis of Top Players
      • By Regional
      • By Functional Role
      • By Ingredient Type
      • By Delivery System
      • By Physical Form
      • By Application
      • By End Use
  20. Competition Analysis
    • Competition Deep Dive
      • BASF
        • Overview
        • Product Portfolio
        • Profitability by Market Segments (Product/Age /Sales Channel/Region)
        • Sales Footprint
        • Strategy Overview
          • Marketing Strategy
          • Product Strategy
          • Channel Strategy
      • Nouryon
        • Overview
        • Product Portfolio
        • Profitability by Market Segments (Product/Age /Sales Channel/Region)
        • Sales Footprint
        • Strategy Overview
          • Marketing Strategy
          • Product Strategy
          • Channel Strategy
      • Clariant
        • Overview
        • Product Portfolio
        • Profitability by Market Segments (Product/Age /Sales Channel/Region)
        • Sales Footprint
        • Strategy Overview
          • Marketing Strategy
          • Product Strategy
          • Channel Strategy
      • Dow
        • Overview
        • Product Portfolio
        • Profitability by Market Segments (Product/Age /Sales Channel/Region)
        • Sales Footprint
        • Strategy Overview
          • Marketing Strategy
          • Product Strategy
          • Channel Strategy
      • Evonik
        • Overview
        • Product Portfolio
        • Profitability by Market Segments (Product/Age /Sales Channel/Region)
        • Sales Footprint
        • Strategy Overview
          • Marketing Strategy
          • Product Strategy
          • Channel Strategy
      • Ashland
        • Overview
        • Product Portfolio
        • Profitability by Market Segments (Product/Age /Sales Channel/Region)
        • Sales Footprint
        • Strategy Overview
          • Marketing Strategy
          • Product Strategy
          • Channel Strategy
      • Innospec
        • Overview
        • Product Portfolio
        • Profitability by Market Segments (Product/Age /Sales Channel/Region)
        • Sales Footprint
        • Strategy Overview
          • Marketing Strategy
          • Product Strategy
          • Channel Strategy
      • Seppic
        • Overview
        • Product Portfolio
        • Profitability by Market Segments (Product/Age /Sales Channel/Region)
        • Sales Footprint
        • Strategy Overview
          • Marketing Strategy
          • Product Strategy
          • Channel Strategy
      • Solvay
        • Overview
        • Product Portfolio
        • Profitability by Market Segments (Product/Age /Sales Channel/Region)
        • Sales Footprint
        • Strategy Overview
          • Marketing Strategy
          • Product Strategy
          • Channel Strategy
      • Jungbunzlauer
        • Overview
        • Product Portfolio
        • Profitability by Market Segments (Product/Age /Sales Channel/Region)
        • Sales Footprint
        • Strategy Overview
          • Marketing Strategy
          • Product Strategy
          • Channel Strategy
      • Others
        • Overview
        • Product Portfolio
        • Profitability by Market Segments (Product/Age /Sales Channel/Region)
        • Sales Footprint
        • Strategy Overview
          • Marketing Strategy
          • Product Strategy
          • Channel Strategy
  21. Assumptions & Acronyms Used
  22. Research Methodology

List of Tables

  • Table 1: Global Market Value (USD Million) Forecast by Region, 2020-2035
  • Table 2: Global Market Volume (Units) Forecast by Region, 2020-2035
  • Table 3: Global Market Value (USD Million) Forecast by Functional Role, 2020-2035
  • Table 4: Global Market Volume (Units) Forecast by Functional Role, 2020-2035
  • Table 5: Global Market Value (USD Million) Forecast by Ingredient Type, 2020-2035
  • Table 6: Global Market Volume (Units) Forecast by Ingredient Type, 2020-2035
  • Table 7: Global Market Value (USD Million) Forecast by Delivery System, 2020-2035
  • Table 8: Global Market Volume (Units) Forecast by Delivery System, 2020-2035
  • Table 9: Global Market Value (USD Million) Forecast by Physical Form, 2020-2035
  • Table 10: Global Market Volume (Units) Forecast by Physical Form, 2020-2035
  • Table 11: Global Market Value (USD Million) Forecast by Application, 2020-2035
  • Table 12: Global Market Volume (Units) Forecast by Application, 2020-2035
  • Table 13: Global Market Value (USD Million) Forecast by End Use, 2020-2035
  • Table 14: Global Market Volume (Units) Forecast by End Use, 2020-2035
  • Table 15: North America Market Value (USD Million) Forecast by Country, 2020-2035
  • Table 16: North America Market Volume (Units) Forecast by Country, 2020-2035
  • Table 17: North America Market Value (USD Million) Forecast by Functional Role, 2020-2035
  • Table 18: North America Market Volume (Units) Forecast by Functional Role, 2020-2035
  • Table 19: North America Market Value (USD Million) Forecast by Ingredient Type, 2020-2035
  • Table 20: North America Market Volume (Units) Forecast by Ingredient Type, 2020-2035
  • Table 21: North America Market Value (USD Million) Forecast by Delivery System, 2020-2035
  • Table 22: North America Market Volume (Units) Forecast by Delivery System, 2020-2035
  • Table 23: North America Market Value (USD Million) Forecast by Physical Form, 2020-2035
  • Table 24: North America Market Volume (Units) Forecast by Physical Form, 2020-2035
  • Table 25: North America Market Value (USD Million) Forecast by Application, 2020-2035
  • Table 26: North America Market Volume (Units) Forecast by Application, 2020-2035
  • Table 27: North America Market Value (USD Million) Forecast by End Use, 2020-2035
  • Table 28: North America Market Volume (Units) Forecast by End Use, 2020-2035
  • Table 29: Latin America Market Value (USD Million) Forecast by Country, 2020-2035
  • Table 30: Latin America Market Volume (Units) Forecast by Country, 2020-2035
  • Table 31: Latin America Market Value (USD Million) Forecast by Functional Role, 2020-2035
  • Table 32: Latin America Market Volume (Units) Forecast by Functional Role, 2020-2035
  • Table 33: Latin America Market Value (USD Million) Forecast by Ingredient Type, 2020-2035
  • Table 34: Latin America Market Volume (Units) Forecast by Ingredient Type, 2020-2035
  • Table 35: Latin America Market Value (USD Million) Forecast by Delivery System, 2020-2035
  • Table 36: Latin America Market Volume (Units) Forecast by Delivery System, 2020-2035
  • Table 37: Latin America Market Value (USD Million) Forecast by Physical Form, 2020-2035
  • Table 38: Latin America Market Volume (Units) Forecast by Physical Form, 2020-2035
  • Table 39: Latin America Market Value (USD Million) Forecast by Application, 2020-2035
  • Table 40: Latin America Market Volume (Units) Forecast by Application, 2020-2035
  • Table 41: Latin America Market Value (USD Million) Forecast by End Use, 2020-2035
  • Table 42: Latin America Market Volume (Units) Forecast by End Use, 2020-2035
  • Table 43: Europe Market Value (USD Million) Forecast by Country, 2020-2035
  • Table 44: Europe Market Volume (Units) Forecast by Country, 2020-2035
  • Table 45: Europe Market Value (USD Million) Forecast by Functional Role, 2020-2035
  • Table 46: Europe Market Volume (Units) Forecast by Functional Role, 2020-2035
  • Table 47: Europe Market Value (USD Million) Forecast by Ingredient Type, 2020-2035
  • Table 48: Europe Market Volume (Units) Forecast by Ingredient Type, 2020-2035
  • Table 49: Europe Market Value (USD Million) Forecast by Delivery System, 2020-2035
  • Table 50: Europe Market Volume (Units) Forecast by Delivery System, 2020-2035
  • Table 51: Europe Market Value (USD Million) Forecast by Physical Form, 2020-2035
  • Table 52: Europe Market Volume (Units) Forecast by Physical Form, 2020-2035
  • Table 53: Europe Market Value (USD Million) Forecast by Application, 2020-2035
  • Table 54: Europe Market Volume (Units) Forecast by Application, 2020-2035
  • Table 55: Europe Market Value (USD Million) Forecast by End Use, 2020-2035
  • Table 56: Europe Market Volume (Units) Forecast by End Use, 2020-2035
  • Table 57: East Asia Market Value (USD Million) Forecast by Country, 2020-2035
  • Table 58: East Asia Market Volume (Units) Forecast by Country, 2020-2035
  • Table 59: East Asia Market Value (USD Million) Forecast by Functional Role, 2020-2035
  • Table 60: East Asia Market Volume (Units) Forecast by Functional Role, 2020-2035
  • Table 61: East Asia Market Value (USD Million) Forecast by Ingredient Type, 2020-2035
  • Table 62: East Asia Market Volume (Units) Forecast by Ingredient Type, 2020-2035
  • Table 63: East Asia Market Value (USD Million) Forecast by Delivery System, 2020-2035
  • Table 64: East Asia Market Volume (Units) Forecast by Delivery System, 2020-2035
  • Table 65: East Asia Market Value (USD Million) Forecast by Physical Form, 2020-2035
  • Table 66: East Asia Market Volume (Units) Forecast by Physical Form, 2020-2035
  • Table 67: East Asia Market Value (USD Million) Forecast by Application, 2020-2035
  • Table 68: East Asia Market Volume (Units) Forecast by Application, 2020-2035
  • Table 69: East Asia Market Value (USD Million) Forecast by End Use, 2020-2035
  • Table 70: East Asia Market Volume (Units) Forecast by End Use, 2020-2035
  • Table 71: South Asia & Pacific Market Value (USD Million) Forecast by Country, 2020-2035
  • Table 72: South Asia & Pacific Market Volume (Units) Forecast by Country, 2020-2035
  • Table 73: South Asia & Pacific Market Value (USD Million) Forecast by Functional Role, 2020-2035
  • Table 74: South Asia & Pacific Market Volume (Units) Forecast by Functional Role, 2020-2035
  • Table 75: South Asia & Pacific Market Value (USD Million) Forecast by Ingredient Type, 2020-2035
  • Table 76: South Asia & Pacific Market Volume (Units) Forecast by Ingredient Type, 2020-2035
  • Table 77: South Asia & Pacific Market Value (USD Million) Forecast by Delivery System, 2020-2035
  • Table 78: South Asia & Pacific Market Volume (Units) Forecast by Delivery System, 2020-2035
  • Table 79: South Asia & Pacific Market Value (USD Million) Forecast by Physical Form, 2020-2035
  • Table 80: South Asia & Pacific Market Volume (Units) Forecast by Physical Form, 2020-2035
  • Table 81: South Asia & Pacific Market Value (USD Million) Forecast by Application, 2020-2035
  • Table 82: South Asia & Pacific Market Volume (Units) Forecast by Application, 2020-2035
  • Table 83: South Asia & Pacific Market Value (USD Million) Forecast by End Use, 2020-2035
  • Table 84: South Asia & Pacific Market Volume (Units) Forecast by End Use, 2020-2035
  • Table 85: Middle East and Africa Market Value (USD Million) Forecast by Country, 2020-2035
  • Table 86: Middle East and Africa Market Volume (Units) Forecast by Country, 2020-2035
  • Table 87: Middle East and Africa Market Value (USD Million) Forecast by Functional Role, 2020-2035
  • Table 88: Middle East and Africa Market Volume (Units) Forecast by Functional Role, 2020-2035
  • Table 89: Middle East and Africa Market Value (USD Million) Forecast by Ingredient Type, 2020-2035
  • Table 90: Middle East and Africa Market Volume (Units) Forecast by Ingredient Type, 2020-2035
  • Table 91: Middle East and Africa Market Value (USD Million) Forecast by Delivery System, 2020-2035
  • Table 92: Middle East and Africa Market Volume (Units) Forecast by Delivery System, 2020-2035
  • Table 93: Middle East and Africa Market Value (USD Million) Forecast by Physical Form, 2020-2035
  • Table 94: Middle East and Africa Market Volume (Units) Forecast by Physical Form, 2020-2035
  • Table 95: Middle East and Africa Market Value (USD Million) Forecast by Application, 2020-2035
  • Table 96: Middle East and Africa Market Volume (Units) Forecast by Application, 2020-2035
  • Table 97: Middle East and Africa Market Value (USD Million) Forecast by End Use, 2020-2035
  • Table 98: Middle East and Africa Market Volume (Units) Forecast by End Use, 2020-2035

List of Figures

  • Figure 1: Global Market Value (USD Million) by Functional Role, 2025-2035
  • Figure 2: Global Market Value (USD Million) by Ingredient Type, 2025-2035
  • Figure 3: Global Market Value (USD Million) by Delivery System, 2025-2035
  • Figure 4: Global Market Value (USD Million) by Physical Form, 2025-2035
  • Figure 5: Global Market Value (USD Million) by Application, 2025-2035
  • Figure 6: Global Market Value (USD Million) by End Use, 2025-2035
  • Figure 7: Global Market Value (USD Million) by Region, 2025-2035
  • Figure 8: Global Market Value (USD Million) Analysis by Region, 2020-2035
  • Figure 9: Global Market Volume (Units) Analysis by Region, 2020-2035
  • Figure 10: Global Market Value Share (%) and BPS Analysis by Region, 2025-2035
  • Figure 11: Global Market Y-o-Y Growth (%) Projections by Region, 2025-2035
  • Figure 12: Global Market Value (USD Million) Analysis by Functional Role, 2020-2035
  • Figure 13: Global Market Volume (Units) Analysis by Functional Role, 2020-2035
  • Figure 14: Global Market Value Share (%) and BPS Analysis by Functional Role, 2025-2035
  • Figure 15: Global Market Y-o-Y Growth (%) Projections by Functional Role, 2025-2035
  • Figure 16: Global Market Value (USD Million) Analysis by Ingredient Type, 2020-2035
  • Figure 17: Global Market Volume (Units) Analysis by Ingredient Type, 2020-2035
  • Figure 18: Global Market Value Share (%) and BPS Analysis by Ingredient Type, 2025-2035
  • Figure 19: Global Market Y-o-Y Growth (%) Projections by Ingredient Type, 2025-2035
  • Figure 20: Global Market Value (USD Million) Analysis by Delivery System, 2020-2035
  • Figure 21: Global Market Volume (Units) Analysis by Delivery System, 2020-2035
  • Figure 22: Global Market Value Share (%) and BPS Analysis by Delivery System, 2025-2035
  • Figure 23: Global Market Y-o-Y Growth (%) Projections by Delivery System, 2025-2035
  • Figure 24: Global Market Value (USD Million) Analysis by Physical Form, 2020-2035
  • Figure 25: Global Market Volume (Units) Analysis by Physical Form, 2020-2035
  • Figure 26: Global Market Value Share (%) and BPS Analysis by Physical Form, 2025-2035
  • Figure 27: Global Market Y-o-Y Growth (%) Projections by Physical Form, 2025-2035
  • Figure 28: Global Market Value (USD Million) Analysis by Application, 2020-2035
  • Figure 29: Global Market Volume (Units) Analysis by Application, 2020-2035
  • Figure 30: Global Market Value Share (%) and BPS Analysis by Application, 2025-2035
  • Figure 31: Global Market Y-o-Y Growth (%) Projections by Application, 2025-2035
  • Figure 32: Global Market Value (USD Million) Analysis by End Use, 2020-2035
  • Figure 33: Global Market Volume (Units) Analysis by End Use, 2020-2035
  • Figure 34: Global Market Value Share (%) and BPS Analysis by End Use, 2025-2035
  • Figure 35: Global Market Y-o-Y Growth (%) Projections by End Use, 2025-2035
  • Figure 36: Global Market Attractiveness by Functional Role, 2025-2035
  • Figure 37: Global Market Attractiveness by Ingredient Type, 2025-2035
  • Figure 38: Global Market Attractiveness by Delivery System, 2025-2035
  • Figure 39: Global Market Attractiveness by Physical Form, 2025-2035
  • Figure 40: Global Market Attractiveness by Application, 2025-2035
  • Figure 41: Global Market Attractiveness by End Use, 2025-2035
  • Figure 42: Global Market Attractiveness by Region, 2025-2035
  • Figure 43: North America Market Value (USD Million) by Functional Role, 2025-2035
  • Figure 44: North America Market Value (USD Million) by Ingredient Type, 2025-2035
  • Figure 45: North America Market Value (USD Million) by Delivery System, 2025-2035
  • Figure 46: North America Market Value (USD Million) by Physical Form, 2025-2035
  • Figure 47: North America Market Value (USD Million) by Application, 2025-2035
  • Figure 48: North America Market Value (USD Million) by End Use, 2025-2035
  • Figure 49: North America Market Value (USD Million) by Country, 2025-2035
  • Figure 50: North America Market Value (USD Million) Analysis by Country, 2020-2035
  • Figure 51: North America Market Volume (Units) Analysis by Country, 2020-2035
  • Figure 52: North America Market Value Share (%) and BPS Analysis by Country, 2025-2035
  • Figure 53: North America Market Y-o-Y Growth (%) Projections by Country, 2025-2035
  • Figure 54: North America Market Value (USD Million) Analysis by Functional Role, 2020-2035
  • Figure 55: North America Market Volume (Units) Analysis by Functional Role, 2020-2035
  • Figure 56: North America Market Value Share (%) and BPS Analysis by Functional Role, 2025-2035
  • Figure 57: North America Market Y-o-Y Growth (%) Projections by Functional Role, 2025-2035
  • Figure 58: North America Market Value (USD Million) Analysis by Ingredient Type, 2020-2035
  • Figure 59: North America Market Volume (Units) Analysis by Ingredient Type, 2020-2035
  • Figure 60: North America Market Value Share (%) and BPS Analysis by Ingredient Type, 2025-2035
  • Figure 61: North America Market Y-o-Y Growth (%) Projections by Ingredient Type, 2025-2035
  • Figure 62: North America Market Value (USD Million) Analysis by Delivery System, 2020-2035
  • Figure 63: North America Market Volume (Units) Analysis by Delivery System, 2020-2035
  • Figure 64: North America Market Value Share (%) and BPS Analysis by Delivery System, 2025-2035
  • Figure 65: North America Market Y-o-Y Growth (%) Projections by Delivery System, 2025-2035
  • Figure 66: North America Market Value (USD Million) Analysis by Physical Form, 2020-2035
  • Figure 67: North America Market Volume (Units) Analysis by Physical Form, 2020-2035
  • Figure 68: North America Market Value Share (%) and BPS Analysis by Physical Form, 2025-2035
  • Figure 69: North America Market Y-o-Y Growth (%) Projections by Physical Form, 2025-2035
  • Figure 70: North America Market Value (USD Million) Analysis by Application, 2020-2035
  • Figure 71: North America Market Volume (Units) Analysis by Application, 2020-2035
  • Figure 72: North America Market Value Share (%) and BPS Analysis by Application, 2025-2035
  • Figure 73: North America Market Y-o-Y Growth (%) Projections by Application, 2025-2035
  • Figure 74: North America Market Value (USD Million) Analysis by End Use, 2020-2035
  • Figure 75: North America Market Volume (Units) Analysis by End Use, 2020-2035
  • Figure 76: North America Market Value Share (%) and BPS Analysis by End Use, 2025-2035
  • Figure 77: North America Market Y-o-Y Growth (%) Projections by End Use, 2025-2035
  • Figure 78: North America Market Attractiveness by Functional Role, 2025-2035
  • Figure 79: North America Market Attractiveness by Ingredient Type, 2025-2035
  • Figure 80: North America Market Attractiveness by Delivery System, 2025-2035
  • Figure 81: North America Market Attractiveness by Physical Form, 2025-2035
  • Figure 82: North America Market Attractiveness by Application, 2025-2035
  • Figure 83: North America Market Attractiveness by End Use, 2025-2035
  • Figure 84: North America Market Attractiveness by Country, 2025-2035
  • Figure 85: Latin America Market Value (USD Million) by Functional Role, 2025-2035
  • Figure 86: Latin America Market Value (USD Million) by Ingredient Type, 2025-2035
  • Figure 87: Latin America Market Value (USD Million) by Delivery System, 2025-2035
  • Figure 88: Latin America Market Value (USD Million) by Physical Form, 2025-2035
  • Figure 89: Latin America Market Value (USD Million) by Application, 2025-2035
  • Figure 90: Latin America Market Value (USD Million) by End Use, 2025-2035
  • Figure 91: Latin America Market Value (USD Million) by Country, 2025-2035
  • Figure 92: Latin America Market Value (USD Million) Analysis by Country, 2020-2035
  • Figure 93: Latin America Market Volume (Units) Analysis by Country, 2020-2035
  • Figure 94: Latin America Market Value Share (%) and BPS Analysis by Country, 2025-2035
  • Figure 95: Latin America Market Y-o-Y Growth (%) Projections by Country, 2025-2035
  • Figure 96: Latin America Market Value (USD Million) Analysis by Functional Role, 2020-2035
  • Figure 97: Latin America Market Volume (Units) Analysis by Functional Role, 2020-2035
  • Figure 98: Latin America Market Value Share (%) and BPS Analysis by Functional Role, 2025-2035
  • Figure 99: Latin America Market Y-o-Y Growth (%) Projections by Functional Role, 2025-2035
  • Figure 100: Latin America Market Value (USD Million) Analysis by Ingredient Type, 2020-2035
  • Figure 101: Latin America Market Volume (Units) Analysis by Ingredient Type, 2020-2035
  • Figure 102: Latin America Market Value Share (%) and BPS Analysis by Ingredient Type, 2025-2035
  • Figure 103: Latin America Market Y-o-Y Growth (%) Projections by Ingredient Type, 2025-2035
  • Figure 104: Latin America Market Value (USD Million) Analysis by Delivery System, 2020-2035
  • Figure 105: Latin America Market Volume (Units) Analysis by Delivery System, 2020-2035
  • Figure 106: Latin America Market Value Share (%) and BPS Analysis by Delivery System, 2025-2035
  • Figure 107: Latin America Market Y-o-Y Growth (%) Projections by Delivery System, 2025-2035
  • Figure 108: Latin America Market Value (USD Million) Analysis by Physical Form, 2020-2035
  • Figure 109: Latin America Market Volume (Units) Analysis by Physical Form, 2020-2035
  • Figure 110: Latin America Market Value Share (%) and BPS Analysis by Physical Form, 2025-2035
  • Figure 111: Latin America Market Y-o-Y Growth (%) Projections by Physical Form, 2025-2035
  • Figure 112: Latin America Market Value (USD Million) Analysis by Application, 2020-2035
  • Figure 113: Latin America Market Volume (Units) Analysis by Application, 2020-2035
  • Figure 114: Latin America Market Value Share (%) and BPS Analysis by Application, 2025-2035
  • Figure 115: Latin America Market Y-o-Y Growth (%) Projections by Application, 2025-2035
  • Figure 116: Latin America Market Value (USD Million) Analysis by End Use, 2020-2035
  • Figure 117: Latin America Market Volume (Units) Analysis by End Use, 2020-2035
  • Figure 118: Latin America Market Value Share (%) and BPS Analysis by End Use, 2025-2035
  • Figure 119: Latin America Market Y-o-Y Growth (%) Projections by End Use, 2025-2035
  • Figure 120: Latin America Market Attractiveness by Functional Role, 2025-2035
  • Figure 121: Latin America Market Attractiveness by Ingredient Type, 2025-2035
  • Figure 122: Latin America Market Attractiveness by Delivery System, 2025-2035
  • Figure 123: Latin America Market Attractiveness by Physical Form, 2025-2035
  • Figure 124: Latin America Market Attractiveness by Application, 2025-2035
  • Figure 125: Latin America Market Attractiveness by End Use, 2025-2035
  • Figure 126: Latin America Market Attractiveness by Country, 2025-2035
  • Figure 127: Europe Market Value (USD Million) by Functional Role, 2025-2035
  • Figure 128: Europe Market Value (USD Million) by Ingredient Type, 2025-2035
  • Figure 129: Europe Market Value (USD Million) by Delivery System, 2025-2035
  • Figure 130: Europe Market Value (USD Million) by Physical Form, 2025-2035
  • Figure 131: Europe Market Value (USD Million) by Application, 2025-2035
  • Figure 132: Europe Market Value (USD Million) by End Use, 2025-2035
  • Figure 133: Europe Market Value (USD Million) by Country, 2025-2035
  • Figure 134: Europe Market Value (USD Million) Analysis by Country, 2020-2035
  • Figure 135: Europe Market Volume (Units) Analysis by Country, 2020-2035
  • Figure 136: Europe Market Value Share (%) and BPS Analysis by Country, 2025-2035
  • Figure 137: Europe Market Y-o-Y Growth (%) Projections by Country, 2025-2035
  • Figure 138: Europe Market Value (USD Million) Analysis by Functional Role, 2020-2035
  • Figure 139: Europe Market Volume (Units) Analysis by Functional Role, 2020-2035
  • Figure 140: Europe Market Value Share (%) and BPS Analysis by Functional Role, 2025-2035
  • Figure 141: Europe Market Y-o-Y Growth (%) Projections by Functional Role, 2025-2035
  • Figure 142: Europe Market Value (USD Million) Analysis by Ingredient Type, 2020-2035
  • Figure 143: Europe Market Volume (Units) Analysis by Ingredient Type, 2020-2035
  • Figure 144: Europe Market Value Share (%) and BPS Analysis by Ingredient Type, 2025-2035
  • Figure 145: Europe Market Y-o-Y Growth (%) Projections by Ingredient Type, 2025-2035
  • Figure 146: Europe Market Value (USD Million) Analysis by Delivery System, 2020-2035
  • Figure 147: Europe Market Volume (Units) Analysis by Delivery System, 2020-2035
  • Figure 148: Europe Market Value Share (%) and BPS Analysis by Delivery System, 2025-2035
  • Figure 149: Europe Market Y-o-Y Growth (%) Projections by Delivery System, 2025-2035
  • Figure 150: Europe Market Value (USD Million) Analysis by Physical Form, 2020-2035
  • Figure 151: Europe Market Volume (Units) Analysis by Physical Form, 2020-2035
  • Figure 152: Europe Market Value Share (%) and BPS Analysis by Physical Form, 2025-2035
  • Figure 153: Europe Market Y-o-Y Growth (%) Projections by Physical Form, 2025-2035
  • Figure 154: Europe Market Value (USD Million) Analysis by Application, 2020-2035
  • Figure 155: Europe Market Volume (Units) Analysis by Application, 2020-2035
  • Figure 156: Europe Market Value Share (%) and BPS Analysis by Application, 2025-2035
  • Figure 157: Europe Market Y-o-Y Growth (%) Projections by Application, 2025-2035
  • Figure 158: Europe Market Value (USD Million) Analysis by End Use, 2020-2035
  • Figure 159: Europe Market Volume (Units) Analysis by End Use, 2020-2035
  • Figure 160: Europe Market Value Share (%) and BPS Analysis by End Use, 2025-2035
  • Figure 161: Europe Market Y-o-Y Growth (%) Projections by End Use, 2025-2035
  • Figure 162: Europe Market Attractiveness by Functional Role, 2025-2035
  • Figure 163: Europe Market Attractiveness by Ingredient Type, 2025-2035
  • Figure 164: Europe Market Attractiveness by Delivery System, 2025-2035
  • Figure 165: Europe Market Attractiveness by Physical Form, 2025-2035
  • Figure 166: Europe Market Attractiveness by Application, 2025-2035
  • Figure 167: Europe Market Attractiveness by End Use, 2025-2035
  • Figure 168: Europe Market Attractiveness by Country, 2025-2035
  • Figure 169: East Asia Market Value (USD Million) by Functional Role, 2025-2035
  • Figure 170: East Asia Market Value (USD Million) by Ingredient Type, 2025-2035
  • Figure 171: East Asia Market Value (USD Million) by Delivery System, 2025-2035
  • Figure 172: East Asia Market Value (USD Million) by Physical Form, 2025-2035
  • Figure 173: East Asia Market Value (USD Million) by Application, 2025-2035
  • Figure 174: East Asia Market Value (USD Million) by End Use, 2025-2035
  • Figure 175: East Asia Market Value (USD Million) by Country, 2025-2035
  • Figure 176: East Asia Market Value (USD Million) Analysis by Country, 2020-2035
  • Figure 177: East Asia Market Volume (Units) Analysis by Country, 2020-2035
  • Figure 178: East Asia Market Value Share (%) and BPS Analysis by Country, 2025-2035
  • Figure 179: East Asia Market Y-o-Y Growth (%) Projections by Country, 2025-2035
  • Figure 180: East Asia Market Value (USD Million) Analysis by Functional Role, 2020-2035
  • Figure 181: East Asia Market Volume (Units) Analysis by Functional Role, 2020-2035
  • Figure 182: East Asia Market Value Share (%) and BPS Analysis by Functional Role, 2025-2035
  • Figure 183: East Asia Market Y-o-Y Growth (%) Projections by Functional Role, 2025-2035
  • Figure 184: East Asia Market Value (USD Million) Analysis by Ingredient Type, 2020-2035
  • Figure 185: East Asia Market Volume (Units) Analysis by Ingredient Type, 2020-2035
  • Figure 186: East Asia Market Value Share (%) and BPS Analysis by Ingredient Type, 2025-2035
  • Figure 187: East Asia Market Y-o-Y Growth (%) Projections by Ingredient Type, 2025-2035
  • Figure 188: East Asia Market Value (USD Million) Analysis by Delivery System, 2020-2035
  • Figure 189: East Asia Market Volume (Units) Analysis by Delivery System, 2020-2035
  • Figure 190: East Asia Market Value Share (%) and BPS Analysis by Delivery System, 2025-2035
  • Figure 191: East Asia Market Y-o-Y Growth (%) Projections by Delivery System, 2025-2035
  • Figure 192: East Asia Market Value (USD Million) Analysis by Physical Form, 2020-2035
  • Figure 193: East Asia Market Volume (Units) Analysis by Physical Form, 2020-2035
  • Figure 194: East Asia Market Value Share (%) and BPS Analysis by Physical Form, 2025-2035
  • Figure 195: East Asia Market Y-o-Y Growth (%) Projections by Physical Form, 2025-2035
  • Figure 196: East Asia Market Value (USD Million) Analysis by Application, 2020-2035
  • Figure 197: East Asia Market Volume (Units) Analysis by Application, 2020-2035
  • Figure 198: East Asia Market Value Share (%) and BPS Analysis by Application, 2025-2035
  • Figure 199: East Asia Market Y-o-Y Growth (%) Projections by Application, 2025-2035
  • Figure 200: East Asia Market Value (USD Million) Analysis by End Use, 2020-2035
  • Figure 201: East Asia Market Volume (Units) Analysis by End Use, 2020-2035
  • Figure 202: East Asia Market Value Share (%) and BPS Analysis by End Use, 2025-2035
  • Figure 203: East Asia Market Y-o-Y Growth (%) Projections by End Use, 2025-2035
  • Figure 204: East Asia Market Attractiveness by Functional Role, 2025-2035
  • Figure 205: East Asia Market Attractiveness by Ingredient Type, 2025-2035
  • Figure 206: East Asia Market Attractiveness by Delivery System, 2025-2035
  • Figure 207: East Asia Market Attractiveness by Physical Form, 2025-2035
  • Figure 208: East Asia Market Attractiveness by Application, 2025-2035
  • Figure 209: East Asia Market Attractiveness by End Use, 2025-2035
  • Figure 210: East Asia Market Attractiveness by Country, 2025-2035
  • Figure 211: South Asia & Pacific Market Value (USD Million) by Functional Role, 2025-2035
  • Figure 212: South Asia & Pacific Market Value (USD Million) by Ingredient Type, 2025-2035
  • Figure 213: South Asia & Pacific Market Value (USD Million) by Delivery System, 2025-2035
  • Figure 214: South Asia & Pacific Market Value (USD Million) by Physical Form, 2025-2035
  • Figure 215: South Asia & Pacific Market Value (USD Million) by Application, 2025-2035
  • Figure 216: South Asia & Pacific Market Value (USD Million) by End Use, 2025-2035
  • Figure 217: South Asia & Pacific Market Value (USD Million) by Country, 2025-2035
  • Figure 218: South Asia & Pacific Market Value (USD Million) Analysis by Country, 2020-2035
  • Figure 219: South Asia & Pacific Market Volume (Units) Analysis by Country, 2020-2035
  • Figure 220: South Asia & Pacific Market Value Share (%) and BPS Analysis by Country, 2025-2035
  • Figure 221: South Asia & Pacific Market Y-o-Y Growth (%) Projections by Country, 2025-2035
  • Figure 222: South Asia & Pacific Market Value (USD Million) Analysis by Functional Role, 2020-2035
  • Figure 223: South Asia & Pacific Market Volume (Units) Analysis by Functional Role, 2020-2035
  • Figure 224: South Asia & Pacific Market Value Share (%) and BPS Analysis by Functional Role, 2025-2035
  • Figure 225: South Asia & Pacific Market Y-o-Y Growth (%) Projections by Functional Role, 2025-2035
  • Figure 226: South Asia & Pacific Market Value (USD Million) Analysis by Ingredient Type, 2020-2035
  • Figure 227: South Asia & Pacific Market Volume (Units) Analysis by Ingredient Type, 2020-2035
  • Figure 228: South Asia & Pacific Market Value Share (%) and BPS Analysis by Ingredient Type, 2025-2035
  • Figure 229: South Asia & Pacific Market Y-o-Y Growth (%) Projections by Ingredient Type, 2025-2035
  • Figure 230: South Asia & Pacific Market Value (USD Million) Analysis by Delivery System, 2020-2035
  • Figure 231: South Asia & Pacific Market Volume (Units) Analysis by Delivery System, 2020-2035
  • Figure 232: South Asia & Pacific Market Value Share (%) and BPS Analysis by Delivery System, 2025-2035
  • Figure 233: South Asia & Pacific Market Y-o-Y Growth (%) Projections by Delivery System, 2025-2035
  • Figure 234: South Asia & Pacific Market Value (USD Million) Analysis by Physical Form, 2020-2035
  • Figure 235: South Asia & Pacific Market Volume (Units) Analysis by Physical Form, 2020-2035
  • Figure 236: South Asia & Pacific Market Value Share (%) and BPS Analysis by Physical Form, 2025-2035
  • Figure 237: South Asia & Pacific Market Y-o-Y Growth (%) Projections by Physical Form, 2025-2035
  • Figure 238: South Asia & Pacific Market Value (USD Million) Analysis by Application, 2020-2035
  • Figure 239: South Asia & Pacific Market Volume (Units) Analysis by Application, 2020-2035
  • Figure 240: South Asia & Pacific Market Value Share (%) and BPS Analysis by Application, 2025-2035
  • Figure 241: South Asia & Pacific Market Y-o-Y Growth (%) Projections by Application, 2025-2035
  • Figure 242: South Asia & Pacific Market Value (USD Million) Analysis by End Use, 2020-2035
  • Figure 243: South Asia & Pacific Market Volume (Units) Analysis by End Use, 2020-2035
  • Figure 244: South Asia & Pacific Market Value Share (%) and BPS Analysis by End Use, 2025-2035
  • Figure 245: South Asia & Pacific Market Y-o-Y Growth (%) Projections by End Use, 2025-2035
  • Figure 246: South Asia & Pacific Market Attractiveness by Functional Role, 2025-2035
  • Figure 247: South Asia & Pacific Market Attractiveness by Ingredient Type, 2025-2035
  • Figure 248: South Asia & Pacific Market Attractiveness by Delivery System, 2025-2035
  • Figure 249: South Asia & Pacific Market Attractiveness by Physical Form, 2025-2035
  • Figure 250: South Asia & Pacific Market Attractiveness by Application, 2025-2035
  • Figure 251: South Asia & Pacific Market Attractiveness by End Use, 2025-2035
  • Figure 252: South Asia & Pacific Market Attractiveness by Country, 2025-2035
  • Figure 253: Middle East and Africa Market Value (USD Million) by Functional Role, 2025-2035
  • Figure 254: Middle East and Africa Market Value (USD Million) by Ingredient Type, 2025-2035
  • Figure 255: Middle East and Africa Market Value (USD Million) by Delivery System, 2025-2035
  • Figure 256: Middle East and Africa Market Value (USD Million) by Physical Form, 2025-2035
  • Figure 257: Middle East and Africa Market Value (USD Million) by Application, 2025-2035
  • Figure 258: Middle East and Africa Market Value (USD Million) by End Use, 2025-2035
  • Figure 259: Middle East and Africa Market Value (USD Million) by Country, 2025-2035
  • Figure 260: Middle East and Africa Market Value (USD Million) Analysis by Country, 2020-2035
  • Figure 261: Middle East and Africa Market Volume (Units) Analysis by Country, 2020-2035
  • Figure 262: Middle East and Africa Market Value Share (%) and BPS Analysis by Country, 2025-2035
  • Figure 263: Middle East and Africa Market Y-o-Y Growth (%) Projections by Country, 2025-2035
  • Figure 264: Middle East and Africa Market Value (USD Million) Analysis by Functional Role, 2020-2035
  • Figure 265: Middle East and Africa Market Volume (Units) Analysis by Functional Role, 2020-2035
  • Figure 266: Middle East and Africa Market Value Share (%) and BPS Analysis by Functional Role, 2025-2035
  • Figure 267: Middle East and Africa Market Y-o-Y Growth (%) Projections by Functional Role, 2025-2035
  • Figure 268: Middle East and Africa Market Value (USD Million) Analysis by Ingredient Type, 2020-2035
  • Figure 269: Middle East and Africa Market Volume (Units) Analysis by Ingredient Type, 2020-2035
  • Figure 270: Middle East and Africa Market Value Share (%) and BPS Analysis by Ingredient Type, 2025-2035
  • Figure 271: Middle East and Africa Market Y-o-Y Growth (%) Projections by Ingredient Type, 2025-2035
  • Figure 272: Middle East and Africa Market Value (USD Million) Analysis by Delivery System, 2020-2035
  • Figure 273: Middle East and Africa Market Volume (Units) Analysis by Delivery System, 2020-2035
  • Figure 274: Middle East and Africa Market Value Share (%) and BPS Analysis by Delivery System, 2025-2035
  • Figure 275: Middle East and Africa Market Y-o-Y Growth (%) Projections by Delivery System, 2025-2035
  • Figure 276: Middle East and Africa Market Value (USD Million) Analysis by Physical Form, 2020-2035
  • Figure 277: Middle East and Africa Market Volume (Units) Analysis by Physical Form, 2020-2035
  • Figure 278: Middle East and Africa Market Value Share (%) and BPS Analysis by Physical Form, 2025-2035
  • Figure 279: Middle East and Africa Market Y-o-Y Growth (%) Projections by Physical Form, 2025-2035
  • Figure 280: Middle East and Africa Market Value (USD Million) Analysis by Application, 2020-2035
  • Figure 281: Middle East and Africa Market Volume (Units) Analysis by Application, 2020-2035
  • Figure 282: Middle East and Africa Market Value Share (%) and BPS Analysis by Application, 2025-2035
  • Figure 283: Middle East and Africa Market Y-o-Y Growth (%) Projections by Application, 2025-2035
  • Figure 284: Middle East and Africa Market Value (USD Million) Analysis by End Use, 2020-2035
  • Figure 285: Middle East and Africa Market Volume (Units) Analysis by End Use, 2020-2035
  • Figure 286: Middle East and Africa Market Value Share (%) and BPS Analysis by End Use, 2025-2035
  • Figure 287: Middle East and Africa Market Y-o-Y Growth (%) Projections by End Use, 2025-2035
  • Figure 288: Middle East and Africa Market Attractiveness by Functional Role, 2025-2035
  • Figure 289: Middle East and Africa Market Attractiveness by Ingredient Type, 2025-2035
  • Figure 290: Middle East and Africa Market Attractiveness by Delivery System, 2025-2035
  • Figure 291: Middle East and Africa Market Attractiveness by Physical Form, 2025-2035
  • Figure 292: Middle East and Africa Market Attractiveness by Application, 2025-2035
  • Figure 293: Middle East and Africa Market Attractiveness by End Use, 2025-2035
  • Figure 294: Middle East and Africa Market Attractiveness by Country, 2025-2035

Frequently Asked Questions

How big is the Chelating / Sequestering Agents Market in 2025?

The global Chelating / Sequestering Agents Market is estimated to be valued at USD 1,952.1 million in 2025.

What will be the size of Chelating / Sequestering Agents Market in 2035?

The market size for the Chelating / Sequestering Agents Market is projected to reach USD 4,023.1 million by 2035.

How much will be the Chelating / Sequestering Agents Market growth between 2025 and 2035?

The Chelating / Sequestering Agents Market is expected to grow at a 7.5% CAGR between 2025 and 2035.

What are the key ingredient types in the Chelating / Sequestering Agents Market?

The key ingredient types in the Chelating / Sequestering Agents Market are EDTA & derivatives, Gluconates, Citric acid & salts, and Biotechnology-derived chelators.

Which range segment to contribute significant share in the Chelating / Sequestering Agents Market in 2025?

In terms of functional role, the metal ion chelators segment is projected to command the largest share at 48.1% of the Chelating / Sequestering Agents Market in 2025.

Explore Similar Insights

Future Market Insights

Chelating / Sequestering Agents Market

Chat With

MaRIA

Hi There, I am MaRIA, Your Market Research Intelligence Assistant. How may I help you?