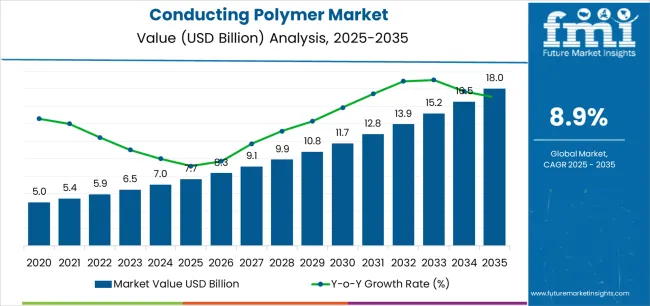
The Conducting Polymer Market is estimated to be valued at USD 7.7 billion in 2025 and is projected to reach USD 18.0 billion by 2035, registering a compound annual growth rate (CAGR) of 8.9% over the forecast period.
The conducting polymer market is experiencing significant growth driven by increasing demand for lightweight, flexible, and durable materials in electronics, energy storage, and packaging applications. The ability of conducting polymers to combine electrical conductivity with polymeric flexibility has enabled their integration into advanced technologies such as sensors, batteries, and actuators.
The market benefits from ongoing research aimed at improving conductivity, environmental stability, and scalability for mass production. Rising adoption in flexible electronics and anti-static components has further enhanced growth prospects.
With the expansion of the renewable energy and smart devices industries, demand for high-performance polymeric materials is expected to rise steadily. The future outlook is strengthened by advancements in inherently conductive polymers and eco-friendly production methods, positioning the market for sustained expansion..

| Metric | Value |
|---|---|
| Conducting Polymer Market Estimated Value in (2025 E) | USD 7.7 billion |
| Conducting Polymer Market Forecast Value in (2035 F) | USD 18.0 billion |
| Forecast CAGR (2025 to 2035) | 8.9% |
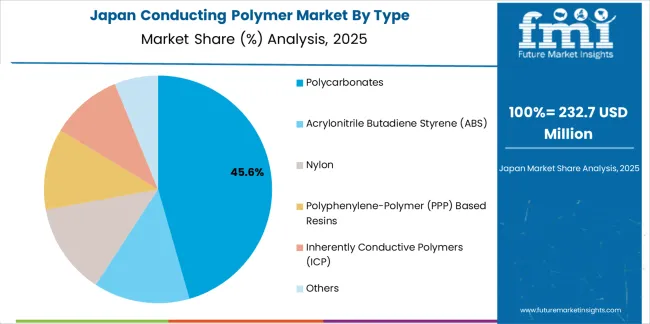
The market is segmented by Type and Application and region. By Type, the market is divided into Polycarbonates, Acrylonitrile Butadiene Styrene (ABS), Nylon, Polyphenylene-Polymer (PPP) Based Resins, Inherently Conductive Polymers (ICP), and Others. In terms of Application, the market is classified into Anti-Static Packaging, Capacitors, Actuators & Sensors, Batteries, Solar Energy, and Others. Regionally, the market is classified into North America, Latin America, Western Europe, Eastern Europe, Balkan & Baltic Countries, Russia & Belarus, Central Asia, East Asia, South Asia & Pacific, and the Middle East & Africa.

The polycarbonates segment leads the type category with approximately 47.30% share, attributed to its excellent mechanical strength, electrical insulation, and optical clarity combined with moderate conductivity when modified with additives. These properties make polycarbonates suitable for use in lightweight electronic components and structural applications.
The segment’s growth is reinforced by increasing demand from the automotive and electronics industries for materials offering both strength and electrical performance. Manufacturers are leveraging polycarbonate-based composites for improved processing flexibility and cost efficiency.
With growing interest in recyclable and high-performance materials, the polycarbonates segment is expected to maintain its dominance within the conducting polymer landscape..

The anti-static packaging segment accounts for approximately 38.60% share of the application category, supported by growing demand from the electronics and semiconductor industries. Conducting polymers are widely utilized in this segment to prevent electrostatic discharge, protecting sensitive electronic components during storage and transportation.
The increasing production of consumer electronics and expansion of the semiconductor supply chain have strengthened this demand. Lightweight and customizable packaging solutions also contribute to widespread adoption.
With rising exports of electronic goods and greater emphasis on component safety, the anti-static packaging segment is projected to remain a major growth contributor in the conducting polymer market..
Widening Usage in Biomedical Applications is a Key Market-shaping Trend
Global sales of conducting polymers increased at a CAGR of 12.0% from 2020 to 2025. Total market valuation at the end of 2025 reached around USD 6.3 billion. In the assessment period, the global market for conducting is expected to progress at 9.4% CAGR.
Several factors are anticipated to boost the growth of the conducting polymer industry during the assessment period. These include the rising usage of conducting polymers across industries like electronics, automotive, and medical devices, the growing need for lightweight materials, and the expanding renewable energy sector.
Conducting polymers are increasingly replacing metals and other conventional materials in a wide variety of electronic devices. This is due to their attractive benefits, such as lightweight, flexibility, versatility, and low cost. Hence, the growing demand for electronic devices is expected to play a crucial role in fostering market growth through 2035.
Rising Miniaturization Trend in the Electronics Industry
In the contemporary world, demand for compact, lighter, and more flexible electronics like wearable devices and foldable smartphones is rising rapidly. This, in turn, is expected to bolster conducting polymer sales throughout the forecast period.
Conducting polymers are becoming ideal for compact and flexible electronic devices. This is because they offer unique advantages, such as lightweight properties and the ability to be printed onto flexible substrates.
The growing popularity of printed electronics globally is set to create opportunities for conducting polymers as conducting inks and components.
Growing Demand for Efficient Energy Storage Solutions
As the world continues to embrace renewable energy and electric vehicles, the need for efficient energy storage solutions like batteries and supercapacitors is rising exponentially. This is expected to uplift demand for conductive polymers as they are used in these energy storage devices due to their high electrical conductivity and electrochemical properties.
| Particular | Value CAGR |
|---|---|
| H1 | 9.1% (2025 to 2035) |
| H2 | 9.3% (2025 to 2035) |
| H1 | 9.9% (2025 to 2035) |
| H2 | 9.5% (2025 to 2035) |
The table below highlights the conducting polymer market revenue in top nations. The United States, China, and Japan are projected to remain the top three consumers of conducting polymers, with expected valuations of USD 18 billion, USD 2.7 billion, and USD 1.9 billion, respectively, in 2035.
China and the United States will continue to witness high demand for conducting polymers. This can be attributed to the rising trend of miniaturization in the electronics industry, the growing demand for LEDs, and the expanding renewable energy sector.
| Countries | Projected Conducting Polymer Market Value (2035) |
|---|---|
| United States | USD 18 billion |
| China | USD 2.7 billion |
| Japan | USD 1.9 billion |
| South Korea | USD 1.1 billion |
| United Kingdom | USD 698.1 million |
The below table shows the estimated growth rates of the top countries. South Korea, Japan, and the United Kingdom are estimated to record higher CAGRs of 11.3%, 10.8%, and 10.4%, respectively, through 2035.
| Countries | Expected Conducting Polymer Market CAGR (2025 to 2035) |
|---|---|
| United States | 9.7% |
| China | 9.9% |
| Japan | 10.8% |
| South Korea | 11.3% |
| United Kingdom | 10.4% |
The United States conducting polymer market is poised to exhibit robust growth, totaling a valuation of USD 18 billion in 2035. Accordingly, sales of conducting polymers in the United States will likely rise at a CAGR of 9.7% between 2025 and 2035. Some of the key drivers/trends include:
There is a significant market opportunity for conducting polymers in the United States. This is due to the nation’s booming renewable energy sector and growing demand for energy storage solutions to support renewable energy sources and electric vehicles.
Conducting polymers are being gradually used in batteries, supercapacitors, and other energy storage devices, and the trend will likely escalate during the forecast period. This can be attributed to their high capacitance and fast charge-discharge rates.
The United States has become a hub for research and development when it comes to conducting polymers. Several government agencies, academic institutions, and private companies in the United States are investing vigorously in research and development to improve the properties of conducting polymers and explore new applications. This will likely foster market growth.
Another prominent factor expected to increase the United States' conducting polymer market share is the expanding usage of conducting polymers in biomedical applications. These polymers hold promise for medical applications like tissue engineering, drug delivery systems, and biosensors.
Demand for conducting polymers in China is anticipated to rise at a healthy CAGR of 9.9% throughout the forecast period. By 2035, China conducting polymer market size is set to reach USD 2.7 billion, driven by factors like:
When it comes to electronic devices, China leads from the forefront. It is the leading producer and consumer of electronic devices, such as computers and smartphones. This is driving demand for conducting polymers in the country, and the trend will likely continue through 2035.
Conducting polymers are widely used for applications such as OLEDs, printed circuit boards, sensors, and flexible electronics. Hence, the growing production of electronic devices in China is set to fuel conducting polymer sales throughout the assessment period.
China’s government is actively supporting the development of advanced materials through policies, funding programs, and incentives. Initiatives like the National Key Research and Development Program and the Made in China 2025 plan provide support to companies and research institutions, fostering innovation and triggering market growth.

Japan's conducting polymer market value is projected to increase at a CAGR of 10.8% during the forecast period, totaling around USD 1.9 billion by the end of 2035. This is attributable to factors like:
Amid rising environmental concerns, Japan’s government is encouraging the adoption of electric vehicles (EVs) to reduce greenhouse gas emissions. This is expected to uplift demand for conducting polymers as they are often used in several EV components, such as charging cables and batteries.
Japan-based companies are renowned for their manufacturing excellence and technological expertise. They produce high-quality conducting polymers using advanced manufacturing processes and quality control measures. Growing adoption of these high-quality polymers across various industries will likely boost the market.
The below section offers in-depth insights into top segments and their respective CAGRs for the projection period. The polycarbonate segment is set to grow at a higher CAGR of 9.2% during the forecast period. By application, the anti-static packaging segment will likely advance at 9.0% CAGR through 2035.
| Top Segment | Polycarbonates (Type) |
|---|---|
| Estimated CAGR (2025 to 2035) | 9.2% |
Demand for polycarbonates is projected to grow rapidly during the assessment period. According to the latest analysis, the polycarbonate segment will likely thrive at 9.2% CAGR between 2025 and 2035.
Polycarbonates are becoming a highly popular type of conducting polymers across diverse industries. This is due to their excellent properties, including transparency, flexibility, lightweight, and durability.
| Top Segment | Anti-static Packaging (Application) |
|---|---|
| Estimated CAGR (2025 to 2035) | 9.0% |
Conducting polymers are mostly used for anti-static packaging applications, making it a top revenue generation segment. Emerging stats reveal the anti-static packaging segment will thrive at a healthy CAGR of 9.0% throughout the forecast period.
Conducting polymers have become popular anti-static materials owing to their several advantages, including:
Due to their tendency to dissipate static electricity, conducting polymers are widely used in anti-static applications. They prevent damage to sensitive electronic components and devices during handling, storage, and transportation.
Several companies are incorporating conducting polymers, such as polyaniline (PANI), into packaging materials or coatings. This is because they provide a path for the controlled dissipation of electrostatic charge, thereby helping to prevent the buildup of static electricity, which can cause ESD.
Conducting polymers are suitable for integration into several packaging formats, such as films, foams, plastic, and paper. Similarly, they can be applied as additives or coatings to packaging materials to impart surface conductivity.
Certain conducting polymers are biodegradable and eco-friendly. They offer a sustainable alternative to traditional anti-static additives such as antistatic agents. Hence, the growing preference of packaging companies to use eco-friendly conducting materials will further boost the target segment.

Key manufacturers of conducting polymers are heavily investing in research and development to introduce novel solutions with improved features. They are integrating metallic fibers into polymers to enhance their conductivity.
Several conducting polymer companies are also employing strategies like distribution agreements, facility expansions, acquisitions, partnerships, mergers, and collaborations. These strategies will likely help them boost their revenue and fortify their market positions.
Recent Developments in the Conducting Polymer Market
| Attribute | Details |
|---|---|
| Estimated Market Value (2025) | USD 7.0 billion |
| Projected Market Value (2035) | USD 17.2 billion |
| Anticipated Growth Rate (2025 to 2035) | 9.4% CAGR |
| Forecast Period | 2025 to 2035 |
| Historical Data Available for | 2020 to 2025 |
| Market Analysis | Value (USD billion), Volume (tons), and CAGR for 2025 to 2035 |
| Key Regions Covered | Latin America; North America; Western Europe; Eastern Europe; South Asia and Pacific; East Asia; and Middle East & Africa |
| Key Countries Covered | Canada, United States, Mexico, Brazil, Chile, Peru, Argentina, Germany, France, Italy, Spain, United Kingdom, Netherlands, Belgium, Nordic, Russia, Poland, China, Japan, South Korea, India, Thailand, Malaysia, Indonesia, Singapore, Australia, New Zealand, GCC Countries, South Africa, Central Africa, and others |
| Key Market Segments Covered | Type, Application, and Region |
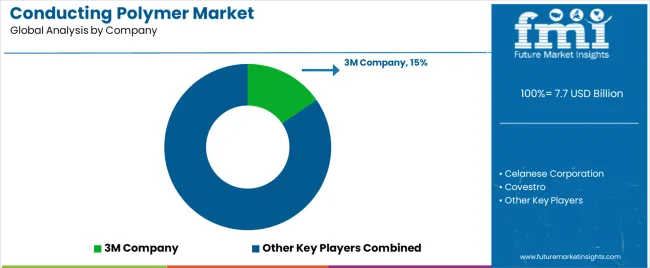
| Key Companies Profiled | Celanese Corporation; 3M Company; Covestro; Solvay; Premix Group; Polyone Corporation; SABIC; Eeonyx; Polyone Corporation; Agfa Gevaert |
The global conducting polymer market is estimated to be valued at USD 7.7 billion in 2025.
The market size for the conducting polymer market is projected to reach USD 18.0 billion by 2035.
The conducting polymer market is expected to grow at a 8.9% CAGR between 2025 and 2035.
The key product types in conducting polymer market are polycarbonates, acrylonitrile butadiene styrene (abs), nylon, polyphenylene-polymer (ppp) based resins, inherently conductive polymers (icp) and others.
In terms of application, anti-static packaging segment to command 38.6% share in the conducting polymer market in 2025.


Our Research Products

The "Full Research Suite" delivers actionable market intel, deep dives on markets or technologies, so clients act faster, cut risk, and unlock growth.

The Leaderboard benchmarks and ranks top vendors, classifying them as Established Leaders, Leading Challengers, or Disruptors & Challengers.

Locates where complements amplify value and substitutes erode it, forecasting net impact by horizon

We deliver granular, decision-grade intel: market sizing, 5-year forecasts, pricing, adoption, usage, revenue, and operational KPIs—plus competitor tracking, regulation, and value chains—across 60 countries broadly.

Spot the shifts before they hit your P&L. We track inflection points, adoption curves, pricing moves, and ecosystem plays to show where demand is heading, why it is changing, and what to do next across high-growth markets and disruptive tech

Real-time reads of user behavior. We track shifting priorities, perceptions of today’s and next-gen services, and provider experience, then pace how fast tech moves from trial to adoption, blending buyer, consumer, and channel inputs with social signals (#WhySwitch, #UX).

Partner with our analyst team to build a custom report designed around your business priorities. From analysing market trends to assessing competitors or crafting bespoke datasets, we tailor insights to your needs.
Supplier Intelligence
Discovery & Profiling
Capacity & Footprint
Performance & Risk
Compliance & Governance
Commercial Readiness
Who Supplies Whom
Scorecards & Shortlists
Playbooks & Docs
Category Intelligence
Definition & Scope
Demand & Use Cases
Cost Drivers
Market Structure
Supply Chain Map
Trade & Policy
Operating Norms
Deliverables
Buyer Intelligence
Account Basics
Spend & Scope
Procurement Model
Vendor Requirements
Terms & Policies
Entry Strategy
Pain Points & Triggers
Outputs
Pricing Analysis
Benchmarks
Trends
Should-Cost
Indexation
Landed Cost
Commercial Terms
Deliverables
Brand Analysis
Positioning & Value Prop
Share & Presence
Customer Evidence
Go-to-Market
Digital & Reputation
Compliance & Trust
KPIs & Gaps
Outputs
Full Research Suite comprises of:
Market outlook & trends analysis
Interviews & case studies
Strategic recommendations
Vendor profiles & capabilities analysis
5-year forecasts
8 regions and 60+ country-level data splits
Market segment data splits
12 months of continuous data updates
DELIVERED AS:
PDF EXCEL ONLINE
Polymer Mixing Unit Market Size and Share Forecast Outlook 2025 to 2035
Polymeric Brominated Flame Retardants Market Size and Share Forecast Outlook 2025 to 2035
Polymer-based Prefilled Syringe Market Size and Share Forecast Outlook 2025 to 2035
Polymer Modified Bitumen Market Forecast and Outlook 2025 to 2035
Polymer Stabilizers Market Size and Share Forecast Outlook 2025 to 2035
Polymeric Adsorbents Market Size and Share Forecast Outlook 2025 to 2035
Polymerization Initiator Market Size and Share Forecast Outlook 2025 to 2035
Polymer Processing Aid (PPA) Market Size and Share Forecast Outlook 2025 to 2035
Polymer Feed System Market Size and Share Forecast Outlook 2025 to 2035
Polymer Bearings Market Size and Share Forecast Outlook 2025 to 2035
Polymer Surge Arrester Market Size and Share Forecast Outlook 2025 to 2035
Polymer Nanomembrane Market Size and Share Forecast Outlook 2025 to 2035
Polymeric Sand Market Analysis - Size, Share, and Forecast Outlook 2025 to 2035
Polymer Binders Market Size and Share Forecast Outlook 2025 to 2035
Polymer Emulsions Market Size and Share Forecast Outlook 2025 to 2035
Polymer Memory Market Size and Share Forecast Outlook 2025 to 2035
Polymer Gel Market Size and Share Forecast Outlook 2025 to 2035
Polymeric Microcapsules Market Size and Share Forecast Outlook 2025 to 2035
Polymer Fillers Market Analysis - Size, Share, and Forecast 2025 to 2035
Polymer Coated Fabrics Market Trends 2025 to 2035

Thank you!
You will receive an email from our Business Development Manager. Please be sure to check your SPAM/JUNK folder too.
Chat With
MaRIA