European Union stevia sales are likely to expand from USD 231.0 million in 2025 to approximately USD 387.2 million by 2035, recording an absolute increase of USD 154.5 million over the forecast period. This translates into total growth of 66.9%, with demand forecast to expand at a compound annual growth rate (CAGR) of 5.3% between 2025 and 2035. The overall industry size is expected to grow by nearly 1.7X during the same period, supported by the increasing consumer shift toward natural sweeteners, growing sugar reduction initiatives across food and beverage manufacturers, and developing applications across powder extract, liquid, and leaf formats throughout European retail and industrial channels.
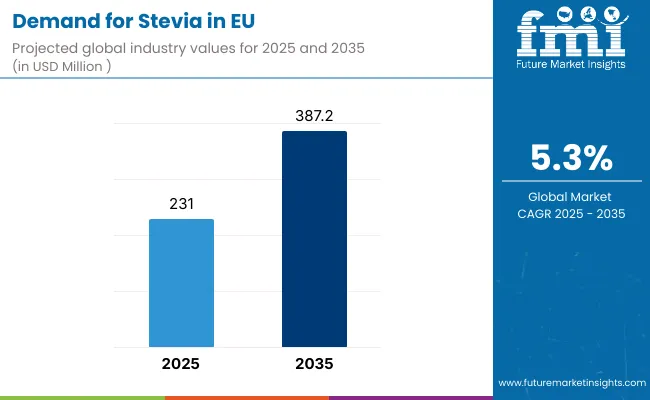
Between 2025 and 2030, EU stevia demand is projected to expand from USD 231.0 million to USD 297.6 million, resulting in a value increase of USD 66.6 million, which represents 43.1% of the total forecast growth for the decade. This phase of development will be shaped by rising consumer demand for natural zero-calorie sweeteners, increasing regulatory pressure on sugar reduction, and growing mainstream acceptance of stevia across beverage reformulations, bakery applications, and tabletop sweetener products. Manufacturers are expanding their product portfolios to address the evolving preferences for improved taste profiles, reduced bitter aftertaste, and functionally optimized formulations comparable to sugar and artificial sweeteners.
From 2030 to 2035, sales are forecast to grow from USD 297.6 million to USD 387.2 million, adding another USD 87.9 million, which constitutes 56.9% of the overall ten-year expansion. This period is expected to be characterized by further expansion of liquid stevia formats, integration of blended sweetener systems for enhanced taste performance, and development of innovative applications targeting diverse consumer preferences across dairy, confectionery, and snack categories. The growing emphasis on clean-label formulations and increasing consumer willingness to accept premium pricing for natural sweeteners will drive demand for high-quality stevia products that deliver authentic sugar-like taste experiences with zero-calorie benefits.
Between 2020 and 2025, EU stevia sales experienced steady expansion at a CAGR of 5.3%, growing from USD 178.8 million to USD 231.0 million. This period was driven by increasing health consciousness among European consumers, rising obesity concerns and diabetes prevalence, and growing recognition of natural sweetener benefits over artificial alternatives. The industry developed as major food and beverage companies and specialized ingredient suppliers recognized the commercial potential of stevia-based sugar replacement. Product innovations, improved extraction techniques, and taste profile enhancements began establishing consumer confidence and mainstream acceptance of stevia-sweetened products.
Industry expansion is being supported by the rapid increase in health-conscious consumers across European countries and the corresponding demand for natural, zero-calorie, and functionally effective sweeteners with proven performance in sugar reduction applications. Modern food and beverage manufacturers rely on stevia as a critical ingredient for sugar replacement, calorie reduction, clean-label positioning, and regulatory compliance with sugar reduction targets, driving demand for products that match or exceed sugar's functional properties, including sweetness intensity, taste profile, and formulation stability. Even minor health concerns, such as weight management goals, diabetes risk awareness, or sugar consumption reduction objectives, can drive comprehensive adoption of stevia-sweetened alternatives to maintain wellness objectives and support healthier dietary patterns.
The growing awareness of natural sweeteners and increasing recognition of stevia's health benefits are driving demand for stevia ingredients from certified suppliers with appropriate quality credentials and complete regulatory approval documentation. Regulatory authorities are increasingly establishing clear guidelines for stevia usage levels, acceptable glycoside compositions, and labeling requirements to maintain consumer safety and ensure product consistency. Scientific research studies and clinical evaluations are providing evidence supporting stevia's safety profile and metabolic advantages, requiring specialized extraction methods and standardized production protocols for optimal sweetness profiles, minimal aftertaste characteristics, and appropriate purity specifications, including rebaudioside content optimization and stevioside ratio management.
Sales are segmented by product type (form), application, distribution channel, nature, and country. By product type, demand is divided into powder extract, liquid, and leaf formats. Based on application, sales are categorized into beverages, bakery & confectionery, dairy, tabletop, snacks, and others. In terms of distribution channel, demand is segmented into B2B/ingredients, foodservice, and retail/household. By nature, sales are classified into conventional and unconventional. Regionally, demand is focused on Germany, France, Italy, Spain, the Netherlands, and the Rest of Europe.
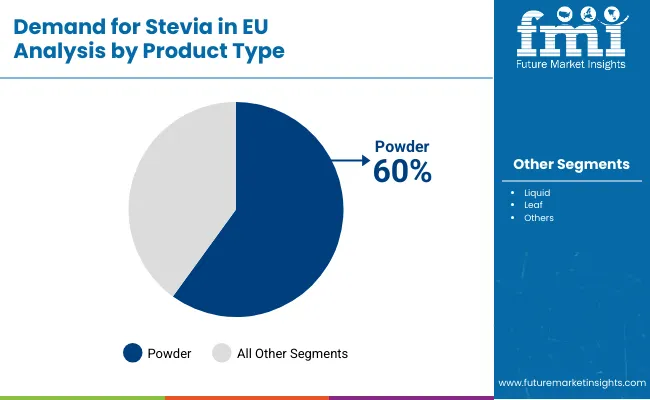
The powder extract segment is projected to account for 60.0% of EU stevia sales in 2025, declining slightly to 58.0% by 2035, maintaining its dominant position as the preferred format across European food and beverage manufacturers. This commanding position is fundamentally supported by powder extract's exceptional functional versatility, superior shelf stability, ease of transportation and storage, and comprehensive formulation compatibility enabling widespread industrial adoption. The powder extract format delivers exceptional manufacturer appeal, providing ingredient suppliers with a product category that facilitates large-scale production, standardized quality specifications, and cost-effective logistics essential for category growth.
This segment benefits from mature extraction technology, well-established supply chains, and extensive availability from multiple stevia suppliers who maintain rigorous purity standards and continuous process optimization. Additionally, powder extract offers versatility across various applications, including beverage formulations, baked goods, dairy products, tabletop sweeteners, and confectionery items, supported by proven formulation technologies that address traditional challenges in taste optimization and sweetness delivery.
The powder extract segment's slight share decline to 58.0% by 2035 reflects faster growth in liquid formats rather than declining powder demand, as liquid stevia adoption accelerates for beverage applications throughout the forecast period.
Key advantages:
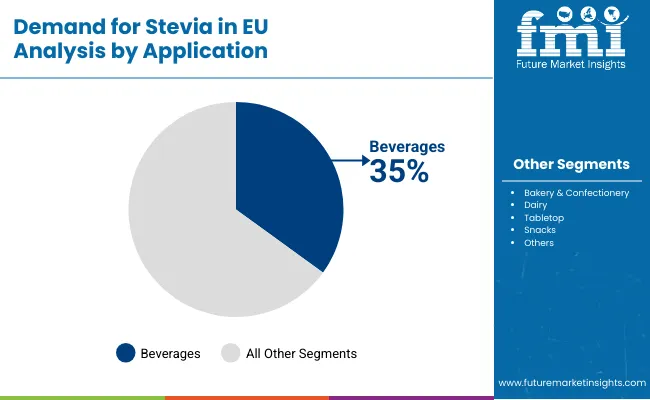
Beverages are strategically estimated to control 35.0% of total European stevia sales in 2025, expanding to 36.0% by 2035, reflecting the critical importance of beverage reformulation for driving category accessibility and consumer exposure. European beverage manufacturers consistently demonstrate growing adoption of stevia that delivers sugar reduction, calorie management, and clean-label positioning across carbonated soft drinks, functional beverages, dairy drinks, and ready-to-drink teas.
The segment provides essential reformulation opportunities through sugar replacement, calorie reduction, natural sweetener claims, and regulatory compliance with sugar reduction initiatives. Major European beverage companies, including Coca-Cola, PepsiCo, Danone, Nestlé, and regional beverage producers, systematically reformulate products with stevia, often featuring reduced-sugar variants, zero-calorie options, and naturally sweetened alternatives that normalize stevia consumption and drive consumer trial.
The segment's growing share reflects continued beverage reformulation momentum, with beverages maintaining leading position as the primary driver of stevia adoption throughout the forecast period.
Success factors:
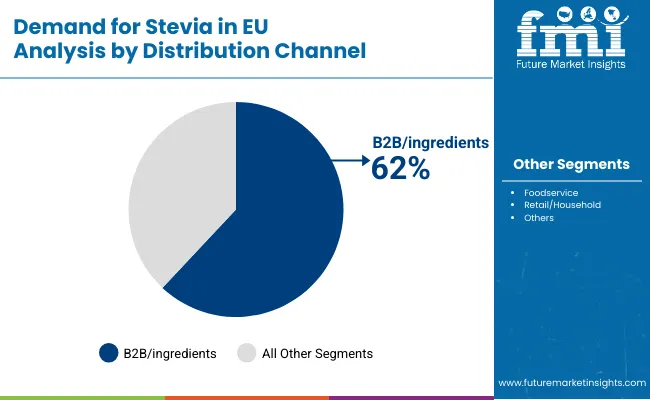
B2B/ingredients channels are strategically estimated to control 62.0% of total European stevia sales in 2025, declining to 60.0% by 2035, reflecting the critical importance of industrial ingredient supply for driving category volume and manufacturer adoption. European ingredient distributors and direct manufacturer relationships consistently demonstrate strong demand for bulk stevia that delivers cost-effective sweetening, consistent quality, and technical support across food and beverage manufacturing applications.
The segment provides essential supply chain infrastructure through bulk ingredient distribution, technical formulation support, quality assurance documentation, and regulatory compliance assistance. Major ingredient suppliers and food manufacturers systematically procure stevia through B2B channels, creating reliable demand supported by long-term supply agreements and strategic supplier partnerships.
The segment's slight share decline reflects growing foodservice and retail penetration, while B2B maintains dominant positioning throughout the forecast period.
Success factors:
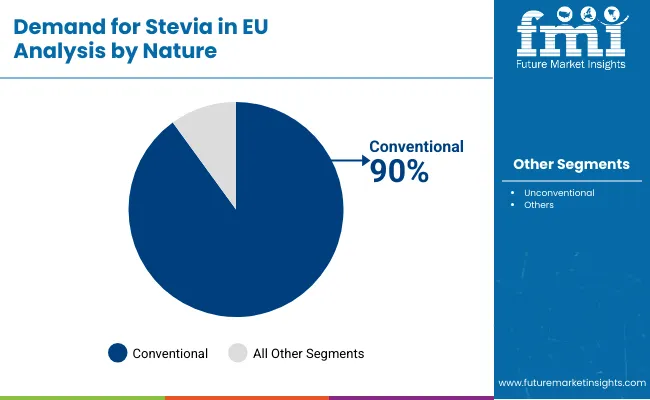
Conventional stevia products are strategically positioned to contribute 90.0% of total European sales in 2025, declining to 86.0% by 2035, representing stevia produced through standard cultivation and extraction without organic certification requirements. These conventional products successfully deliver functional performance and competitive pricing while ensuring adequate quality for mainstream food and beverage applications that prioritize functionality and cost-effectiveness over organic certification.
Conventional production serves price-conscious manufacturers, volume applications, and mass-market products requiring cost-effective stevia at competitive price points compared to sugar and artificial sweeteners. The segment derives significant competitive advantages from established supply chains, cultivation economies of scale, and the ability to meet substantial volume requirements from major food and beverage manufacturers without organic certification constraints limiting raw material sourcing options.
The segment's declining share through 2035 reflects the category's evolution toward organic and unconventional products, which grow from 10.0% in 2025 to 14.0% in 2035, as health-conscious consumers and premium brands increasingly prioritize organic certification and sustainable sourcing.
Competitive advantages:
EU stevia sales are advancing steadily due to increasing consumer demand for natural sweeteners, growing regulatory pressure on sugar reduction, and rising health consciousness regarding sugar consumption. However, the industry faces challenges, including persistent taste perception issues with bitter aftertaste for some consumers, higher price points compared to artificial sweeteners limiting mass adoption, and formulation complexity requiring specialized technical expertise. Continued innovation in taste optimization technologies and glycoside profiling remains central to industry development.
The rapidly accelerating development of taste optimization technologies is fundamentally transforming stevia from niche natural sweeteners with notable aftertaste to mainstream sugar replacers, enabling taste profiles, sweetness characteristics, and flavor experiences previously unattainable through standard stevia extracts alone. Advanced purification platforms featuring rebaudioside enrichment, glycoside profiling, and taste modulation allow manufacturers to create premium stevia ingredients with superior sweetness quality, minimal bitter aftertaste, and genuine sugar-like satisfaction comparable to sucrose. These taste innovations prove particularly transformative for beverage manufacturers, including major soft drink producers, functional beverage companies, and dairy drink manufacturers, where taste acceptance proves essential for consumer adoption and repeat purchase.
Major stevia suppliers invest heavily in extraction technology upgrades, taste masking development, and sensory optimization for refined formulations, recognizing that superior-tasting stevia represents breakthrough solutions for taste perception challenges limiting category expansion. Manufacturers collaborate with flavor houses, food scientists, and sensory experts to develop optimized extracts that improve taste while maintaining cost-effectiveness and regulatory compliance supporting mainstream positioning.
Modern food and beverage manufacturers systematically implement stevia-sugar blending systems, including hybrid sweetener formulations combining stevia with sugar, erythritol, or other natural sweeteners that deliver balanced sweetness, improved taste profiles, and calorie reduction comparable to full-sugar products. Strategic integration of blending technologies optimized for specific applications enables manufacturers to position products as naturally sweetened with reduced calories where blended formulations directly determine consumer acceptance and taste satisfaction. These blending improvements prove essential for mass-market positioning, as mainstream consumers demand taste quality, acceptable sweetness delivery, and minimal aftertaste supporting broad demographic appeal.
Companies implement extensive formulation optimization programs, sweetener system partnerships with ingredient suppliers, and sensory testing targeting consumer acceptance, including taste preference validation, sweetness perception research, and repeat purchase prediction throughout product development. Manufacturers leverage blending strategies in product innovation, marketing positioning featuring partial sugar reduction claims, and taste communication, positioning blended products as optimized alternatives delivering natural sweetening with superior taste.
European beverage manufacturers increasingly prioritize liquid stevia formats featuring concentrated solutions, standardized sweetness levels, and application-specific formulations supporting precise dosing requirements and simplified processing efficiency. This format innovation trend enables manufacturers to achieve superior beverage performance through easy dispersibility, homogeneous sweetness distribution, and processing simplification resonating with beverage producers seeking competitive advantages through manufacturing efficiency. Liquid format adoption proves particularly important for beverage applications where rapid mixing, consistent sweetness delivery, and processing speed determine production economics and product quality.
The development of sophisticated liquid stevia products, including flavor-enhanced variants, glycoside-optimized concentrations, and application-specific formulations expands manufacturers' abilities to create beverage-ready solutions delivering optimal performance without formulation compromises. Producers collaborate with beverage companies, processing equipment suppliers, and application laboratories to develop liquid formats balancing functionality with processing compatibility, supporting adoption and industry standardization while maintaining quality specifications across beverage manufacturing operations.
| Country | CAGR % (2025-2035) |
|---|---|
| Spain | 5.7% |
| France | 5.5% |
| Italy | 5.5% |
| Netherlands | 5.4% |
| Germany | 5.1% |
| Rest of Europe | 5.0% |
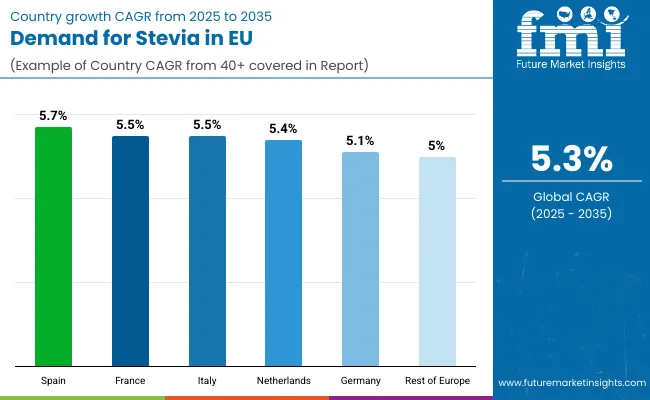
EU stevia sales demonstrate solid growth across major European economies, with Spain leading expansion at 5.7% CAGR through 2035, driven by health consciousness and beverage industry innovation. France and Italy show robust growth at 5.5% CAGR each through increasing wellness awareness and food reformulation. Netherlands maintains 5.4% CAGR, benefiting from progressive consumer attitudes. Germany records 5.1% CAGR reflecting established market maturity. Rest of Europe demonstrates 5.0% CAGR across diverse smaller operations. Overall, sales show consistent regional development reflecting EU-wide dietary shifts toward natural sweeteners and sugar reduction acceptance.
Revenue from stevia in Germany is projected to exhibit steady growth with a CAGR of 5.1% through 2035, driven by exceptionally well-developed health consciousness, comprehensive food and beverage manufacturing infrastructure, and strong consumer commitment to natural ingredients throughout the country. Germany's sophisticated understanding of nutritional wellness and internationally recognized leadership in health-focused food products are creating substantial demand for stevia across beverage, bakery, dairy, and tabletop applications.
Major food and beverage manufacturers, including Nestlé Germany, Danone Deutschland, Red Bull, and numerous specialized beverage producers, systematically incorporate stevia into product reformulations, often dedicating product lines to reduced-sugar alternatives and positioning them prominently to encourage consumer trial. German demand benefits from high health awareness, substantial disposable income supporting premium natural ingredients, and cultural receptivity to dietary innovation that naturally supports stevia adoption across mainstream consumers beyond core health-focused demographics.
Growth drivers:
Revenue from stevia in France is expanding at a CAGR of 5.5%, supported by evolving consumer attitudes toward sugar reduction despite France's strong culinary tradition and taste-focused food culture. France's growing health consciousness among younger urban consumers and increasing diabetes awareness are gradually driving demand for natural sweetener alternatives across diverse application segments.
Major food and beverage companies, including Danone, Nestlé France, Orangina Schweppes, and specialized beverage producers, gradually establish comprehensive stevia-sweetened product ranges to serve continuously growing wellness demand. French sales particularly benefit from sophisticated taste standards demanding superior quality, driving product innovation and taste optimization within the stevia category. Consumer education initiatives and health authority recommendations significantly enhance penetration rates despite historical preference for traditional sweeteners in French gastronomy.
Success factors:
Revenue from stevia in Italy is growing at a robust CAGR of 5.5%, fundamentally driven by increasing health consciousness, progressive urban consumer segments, and gradual modernization of Italian dietary patterns to incorporate natural sweeteners. Italy's traditionally sugar-conscious Mediterranean diet is accommodating stevia options as consumers recognize health benefits and wellness advantages of reducing refined sugar consumption while maintaining taste satisfaction.
Major food and beverage manufacturers, including Ferrero, Barilla, San Pellegrino, and numerous regional producers, strategically invest in stevia category development and consumer education programs to address growing interest in natural sweeteners. Italian sales particularly benefit from health-focused positioning, creating natural adoption among wellness-conscious consumers, combined with increasing obesity awareness in urban centers contributing to expansion through health-driven reformulation.
Development factors:
Demand for stevia in Spain is projected to grow at a CAGR of 5.7%, substantially supported by growing health consciousness among younger Spanish consumers, expanding beverage reformulation activity through major manufacturers, and increasing awareness of obesity and diabetes prevention. Spanish consumer interest in wellness and natural nutrition positions stevia as aligned with health-focused dietary evolution across beverages, dairy products, and tabletop applications.
Major beverage and food companies, including Coca-Cola España, PepsiCo Spain, Danone España, and regional producers, systematically expand stevia-sweetened offerings, with reduced-sugar soft drinks and naturally sweetened beverages proving particularly successful in driving mainstream adoption through accessible pricing and prominent retail placement. Spain's growing wellness culture supports stevia trial among health-conscious consumers seeking natural alternatives to sugar and artificial sweeteners.
Growth enablers:
Demand for stevia in the Netherlands is expanding at a CAGR of 5.4%, fundamentally driven by progressive consumer attitudes, strong health consciousness, and comprehensive retail support for natural and health-focused products across mainstream and specialized channels. Dutch consumers demonstrate particularly high receptivity to natural sweeteners and willingness to adopt sugar alternatives for health and wellness reasons.
Netherlands sales significantly benefit from well-developed health food retail infrastructure, including Albert Heijn's extensive natural products sections, specialized organic stores, and progressive food culture embracing dietary innovation. Major food and beverage companies systematically incorporate stevia into Dutch market products, with successful launches often expanding to broader European markets through the Netherlands' role as innovation testing ground for European food categories.
Innovation drivers:
EU stevia sales are projected to grow from USD 231.0 million in 2025 to USD 387.2 million by 2035, registering a CAGR of 5.3% over the forecast period. Spain is expected to demonstrate the strongest growth trajectory with a 5.7% CAGR, supported by growing health consciousness, expanding beverage reformulation activity, and increasing retail availability of stevia-sweetened products. France and Italy follow with 5.5% CAGR each, attributed to health trends and food industry innovation.
Germany maintains the largest share at 28.6% in 2025, driven by established health consciousness and advanced food manufacturing infrastructure, while growing at 5.0% CAGR. Netherlands demonstrates 5.4% CAGR, while Rest of Europe shows 5.0% CAGR, reflecting diverse regional development stages.
EU stevia sales are defined by competition among global ingredient companies, specialized stevia producers, and agricultural processors. Companies are investing in extraction technologies, taste optimization, glycoside profiling, and application development to deliver high-quality, great-tasting, and cost-competitive stevia solutions. Strategic partnerships with food and beverage manufacturers, distribution expansion initiatives, and technical service capabilities emphasizing formulation support and taste optimization are central to strengthening competitive position.
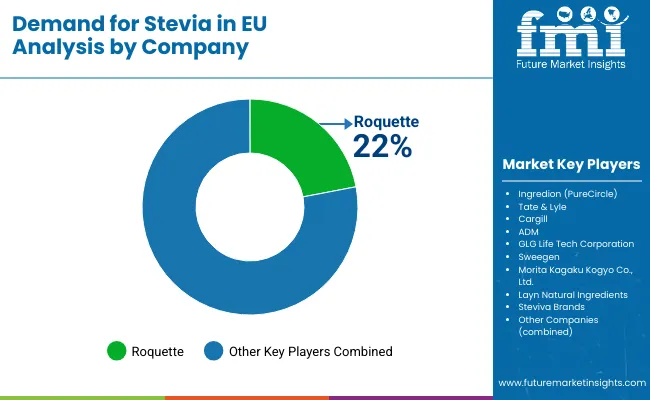
Major participants include Roquette with an estimated 22.0% share, leveraging its ingredient expertise, European manufacturing presence, and established relationships with food and beverage companies through comprehensive sweetener portfolio operations. Roquette benefits from technical formulation capabilities, extensive distribution networks, and ability to position stevia alongside complementary ingredients, supporting mainstream acceptance and industrial prominence.
Ingredion (PureCircle) holds approximately 18.0% share, emphasizing stevia specialization through PureCircle acquisition, innovative glycoside development, and reformulation program support. Ingredion's success in developing superior-tasting stevia extracts with optimized sweetness profiles creates strong positioning and customer acceptance, supported by technical capabilities and application development expertise.
Tate & Lyle accounts for roughly 14.0% share through its position as global sweetener leader with comprehensive blending systems, providing taste-optimized stevia solutions through hybrid sweetener development. The company benefits from sweetener expertise, global customer relationships, and comprehensive technical support helping manufacturers navigate formulation challenges, supporting premium positioning and application-focused marketing.
Cargill represents approximately 12.0% share, supporting growth through taste modulation partnerships, extensive agricultural integration, and quality positioning across global operations. Cargill leverages stevia cultivation expertise, processing scale, and innovation capabilities addressing taste challenges, attracting quality-focused customers seeking reliable stevia sources with technical differentiation.
ADM represents approximately 8.0% share, emphasizing integrated ingredient solutions, natural sweetener systems, and comprehensive application support. ADM leverages global ingredient portfolio, agricultural expertise, and customer relationships supporting stevia adoption across diverse food and beverage applications.
Other companies collectively hold 26.0% share, reflecting competitive dynamics within European stevia sales, where numerous regional stevia producers, specialized extraction companies, agricultural cooperatives, and ingredient distributors serve specific customer requirements, regional operations, and niche applications. This competitive environment provides opportunities for differentiation through superior taste profiles, organic certification, specialized glycoside compositions, and technical service excellence resonating with food and beverage manufacturers seeking reliable natural sweetener sources.
| Item | Value |
|---|---|
| Quantitative Units | USD 387.2 million |
| Product Type (Form) | Powder Extract, Liquid, Leaf |
| Application | Beverages, Bakery & Confectionery, Dairy, Tabletop, Snacks, Others |
| Distribution Channel | B2B/Ingredients, Foodservice, Retail/Household |
| Nature | Conventional, Unconventional |
| Countries Covered | Germany, France, Italy, Spain, the Netherlands, and the Rest of Europe |
| Key Companies Profiled | Roquette, Ingredion (PureCircle), Tate & Lyle, Cargill, ADM |
| Additional Attributes | Dollar sales by product type (form), application, distribution channel, and nature; regional demand trends across major European economies; competitive landscape analysis with global ingredient companies and specialized stevia producers; customer preferences for various stevia formats and taste profiles; integration with food and beverage reformulation initiatives; innovations in extraction technologies and taste optimization; adoption across beverage, bakery, dairy, and tabletop applications; regulatory framework analysis for natural sweetener approval and usage levels; supply chain strategies including agricultural sourcing and glycoside profiling; and penetration analysis for mainstream and health-conscious European consumers. |
Product Type (Form)
The global demand for stevia in EU is estimated to be valued at USD 231.0 million in 2025.
The market size for the demand for stevia in EU is projected to reach USD 387.2 million by 2035.
The demand for stevia in EU is expected to grow at a 5.3% CAGR between 2025 and 2035.
The key product types in demand for stevia in EU are powder extract, liquid and leaf.
In terms of application, beverages segment to command 35.0% share in the demand for stevia in EU in 2025.


Our Research Products

The "Full Research Suite" delivers actionable market intel, deep dives on markets or technologies, so clients act faster, cut risk, and unlock growth.

The Leaderboard benchmarks and ranks top vendors, classifying them as Established Leaders, Leading Challengers, or Disruptors & Challengers.

Locates where complements amplify value and substitutes erode it, forecasting net impact by horizon

We deliver granular, decision-grade intel: market sizing, 5-year forecasts, pricing, adoption, usage, revenue, and operational KPIs—plus competitor tracking, regulation, and value chains—across 60 countries broadly.

Spot the shifts before they hit your P&L. We track inflection points, adoption curves, pricing moves, and ecosystem plays to show where demand is heading, why it is changing, and what to do next across high-growth markets and disruptive tech

Real-time reads of user behavior. We track shifting priorities, perceptions of today’s and next-gen services, and provider experience, then pace how fast tech moves from trial to adoption, blending buyer, consumer, and channel inputs with social signals (#WhySwitch, #UX).

Partner with our analyst team to build a custom report designed around your business priorities. From analysing market trends to assessing competitors or crafting bespoke datasets, we tailor insights to your needs.
Supplier Intelligence
Discovery & Profiling
Capacity & Footprint
Performance & Risk
Compliance & Governance
Commercial Readiness
Who Supplies Whom
Scorecards & Shortlists
Playbooks & Docs
Category Intelligence
Definition & Scope
Demand & Use Cases
Cost Drivers
Market Structure
Supply Chain Map
Trade & Policy
Operating Norms
Deliverables
Buyer Intelligence
Account Basics
Spend & Scope
Procurement Model
Vendor Requirements
Terms & Policies
Entry Strategy
Pain Points & Triggers
Outputs
Pricing Analysis
Benchmarks
Trends
Should-Cost
Indexation
Landed Cost
Commercial Terms
Deliverables
Brand Analysis
Positioning & Value Prop
Share & Presence
Customer Evidence
Go-to-Market
Digital & Reputation
Compliance & Trust
KPIs & Gaps
Outputs
Full Research Suite comprises of:
Market outlook & trends analysis
Interviews & case studies
Strategic recommendations
Vendor profiles & capabilities analysis
5-year forecasts
8 regions and 60+ country-level data splits
Market segment data splits
12 months of continuous data updates
DELIVERED AS:
PDF EXCEL ONLINE
Western Europe Stevia Market Analysis by Extract, End-use Industry, and Country Through 2035
Europe Radiotherapy Patient Positioning Market Size and Share Forecast Outlook 2025 to 2035
Europe Polyvinyl Alcohol Industry Analysis Size and Share Forecast Outlook 2025 to 2035
Europe Cruise Market Forecast and Outlook 2025 to 2035
Europium Market Forecast and Outlook 2025 to 2035
Eucommia Leaf Extract Market Size and Share Forecast Outlook 2025 to 2035
Europe Massage Therapy Service Market Size and Share Forecast Outlook 2025 to 2035
Europe Cement Market Analysis Size and Share Forecast Outlook 2025 to 2035
European Union Tourism Industry Size and Share Forecast Outlook 2025 to 2035
Europe Injection Molding Machines Market Size and Share Forecast Outlook 2025 to 2035
Europe Injection Moulders Market Size and Share Forecast Outlook 2025 to 2035
Europe and MENA Generic Oncology Drug Market Size and Share Forecast Outlook 2025 to 2035
Europe Masking Tapes Market Size and Share Forecast Outlook 2025 to 2035
Europe Liners Market Size and Share Forecast Outlook 2025 to 2035
Europe Dermal Fillers Market Size and Share Forecast Outlook 2025 to 2035
Europe Trolley Bus Market Size and Share Forecast Outlook 2025 to 2035
EU Battery Passport Solutions Market Analysis - Size, Share, and Forecast Outlook 2025 to 2035
Europe Protease Market Size and Share Forecast Outlook 2025 to 2035
Europe Luxury Packaging Market Size and Share Forecast Outlook 2025 to 2035
Europe & USA Consumer Electronics Packaging Market Size and Share Forecast Outlook 2025 to 2035

Thank you!
You will receive an email from our Business Development Manager. Please be sure to check your SPAM/JUNK folder too.
Chat With
MaRIA