Exfoliants Peeling Agents Market Size and Share Forecast Outlook 2025 to 2035

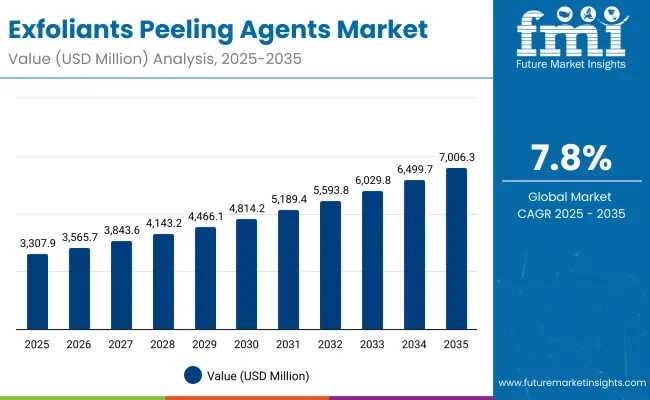
A valuation of USD 3,307.9 million is anticipated for the Exfoliants Peeling Agents Market in 2025, which is projected to rise to USD 7,006.3 million by 2035. This increase of USD 3,698.4 million over the decade reflects a near doubling of market size, achieved at a CAGR of 7.8%. Market expansion is expected to be powered by surging demand for high-performance raw materials across skincare and dermatology formulations, supported by advanced delivery systems and rising dermatology engagement worldwide.
Quick Stats for Exfoliants Peeling Agents Market

  • Market Value (2025): USD 3,307.9 million
  • Market Forecast Value (2035): USD 7,006.3 million
  • Market Forecast CAGR (2025 to 2035): 7.8%
  • Leading Segment in 2025: Synthetic sources (59.7%)
  • Key Growth Regions: North America, East Asia, South Asia & Pacific, Europe
  • Top Key Players: DSM-Firmenich, BASF, Croda, Clariant, Evonik, Symrise, Givaudan, Ashland, Seppic, Provital

Exfoliants Peeling Agents Market

Exfoliants Peeling Agents Market Key Takeaways

Metric Value
Exfoliants Peeling Agents Market Estimated Value in (2025E) USD 3,307.9 million
Exfoliants Peeling Agents Market Forecast Value in (2035F) USD 7,006.3 million
Forecast CAGR (2025 to 2035) 7.80%

During the initial five-year period from 2025 to 2030, growth is forecasted from USD 3,307.9 million to USD 4,814.2 million, adding USD 1,506.3 million, equivalent to around 41% of the decade’s expansion. This phase is likely to be defined by broad-based adoption of exfoliant actives across consumer skincare and professional treatment formulations. Synthetic sources are expected to dominate with a 59.7% share in 2025, reflecting their scalability and cost advantages in formulation supply. In the same year, liquid concentrates are anticipated to lead physical form preferences with 52% share, indicating a strong alignment with ease-of-use in product integration.

From 2030 to 2035, the market is projected to rise further from USD 4,814.2 million to USD 7,006.3 million, contributing USD 2,192.1 million or 59% of total decade growth. This acceleration is predicted to be driven by premiumization trends in Asia-Pacific, higher adoption of encapsulated systems for controlled release, and a growing pivot toward bio-based exfoliants that align with sustainability goals.

From 2020 to 2024, the category of exfoliants and peeling agents experienced steady advancement as awareness of scientifically backed skin solutions increased globally. By 2025, the market is projected at USD 3,307.9 million, setting the stage for significant growth over the next decade. Expansion to USD 7,006.3 million by 2035 is anticipated, representing more than a twofold increase in value.

Competitive positioning is expected to evolve, with raw material suppliers focusing not only on traditional synthetic actives but also on natural-origin and fermentation-derived alternatives. While synthetic ingredients dominate in 2025 due to cost and consistency advantages, demand for botanical and encapsulated systems is predicted to rise rapidly, fueled by premium skincare and dermatology-driven formulations.

Regional momentum is forecasted to be led by Asia-Pacific, particularly China and India, where double-digit CAGRs are projected. Established leaders such as DSM-Firmenich and BASF are expected to retain prominence, though competitive intensity is likely to be shaped by innovation in bio-based sourcing, delivery systems, and sustainable formulation approaches. Ecosystem strength and innovation in controlled-release actives are predicted to determine long-term differentiation.

Why the Exfoliants Peeling Agents Market is growing?

Growth in the Exfoliants Peeling Agents Market is being fueled by increasing consumer demand for clinically validated skincare solutions that deliver visible results. Rising awareness of skin health and preventive dermatology is driving the adoption of chemical and bio-based exfoliants across both mass-market and premium product ranges. The preference for clean-label formulations is pushing suppliers to innovate with botanical and fermentation-derived ingredients, while synthetic actives continue to hold prominence due to scalability and reliability. Technological advances in encapsulation and controlled-release systems are enabling improved stability and efficacy, thereby expanding formulation opportunities. Strong momentum is being observed in Asia-Pacific markets, where younger demographics and higher spending on skincare are accelerating adoption. Professional dermatology treatments are also contributing to demand as advanced peeling agents gain acceptance in clinical practice. With sustainability and performance positioned as key drivers, innovation pipelines are expected to ensure sustained market expansion through 2035.

Segmental Analysis

The Exfoliants Peeling Agents Market has been segmented across type, source, and delivery system to highlight the structural drivers of demand within the raw materials landscape. Each segment provides unique insights into how ingredient selection, formulation practices, and evolving consumer expectations are shaping growth. By type, Alpha Hydroxy Acids (AHAs) and other exfoliant categories are considered, offering a view into performance-driven adoption. By source, the balance between synthetic options and botanical or fruit-derived alternatives is examined, reflecting the shift between scalability and naturality. By delivery system, the focus lies on free-form actives and advanced systems such as encapsulated solutions, illustrating the technological evolution influencing stability and efficacy. This segmentation framework enables a forward-looking understanding of how the market is expected to expand through 2035.
Insights into the Type Segment with AHAs Holding Strong Demand

Exfoliants Peeling Agents Market By Type

Type Market Value Share, 2025
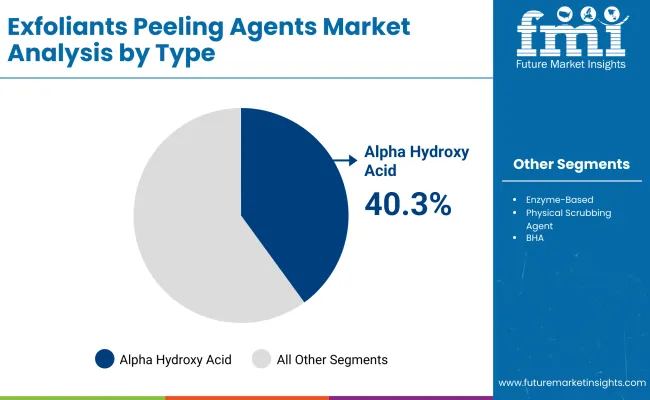
Alpha hydroxy acids (AHA) 40.3%
Others 59.7%

The type segment is expected to be led by Alpha Hydroxy Acids (AHAs), holding 40.3% share in 2025, equivalent to USD 1333.08 million. AHAs are widely adopted due to their efficacy in skin renewal, gentle exfoliation, and compatibility across consumer and professional formulations. Demand is being supported by proven clinical outcomes and high consumer awareness. The remaining 59.7% share, valued at USD 1974.82 million, is attributed to other exfoliant types, offering broader options for formulators. Continued innovation in multi-acid blends and hybrid exfoliants is anticipated to expand usage in advanced dermatology and skincare. With premium skincare growth accelerating, AHAs are expected to maintain a strong foothold in the market.
Insights into the Source Segment with Synthetic Variants Leading

Exfoliants Peeling Agents Market By Source

Source Market Value Share, 2025
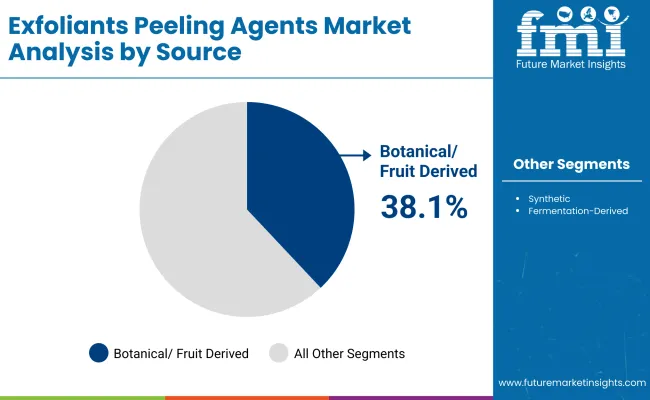
Botanical/fruit derived 38.1%
Others 61.9%

The source segment is projected to be dominated by synthetic ingredients, accounting for 61.9% of the market in 2025 with USD 2047.59 million in value. Synthetic-origin exfoliants are being preferred for their consistency, cost-effectiveness, and scalability in industrial production, making them critical for large-volume personal care and dermatology formulations. Botanical and fruit-derived ingredients are expected to represent 38.1% share, valued at USD 1260.31 million, as naturality-driven trends continue to shape consumer preference. Over the forecast period, the balance between synthetic and bio-based sourcing is anticipated to evolve, with sustainability and regulatory guidelines influencing supplier strategies. Growth is predicted to be led by hybrid sourcing models, ensuring both performance reliability and alignment with clean-label claims.
Insights into the Delivery System Segment with Free Form Dominating

Exfoliants Peeling Agents Market By Delivery System

Delivery System Market Value Share, 2025
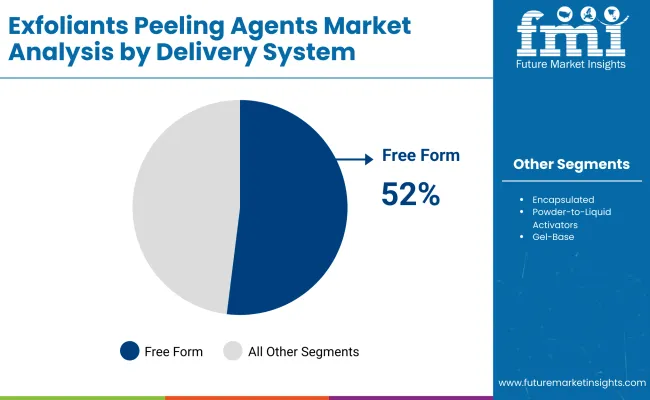
Free form 52%
Others 48.0%

The delivery system segment is forecasted to be led by free-form actives, which are anticipated to hold 52% market share in 2025, valued at USD 1720.11 million. Free-form exfoliants are widely integrated into mass-market skincare and dermatology applications due to ease of formulation and broad compatibility with multiple product formats. Other systems, including encapsulated and gel-based solutions, are estimated to account for 48% share (USD 1587.79 million), reflecting growing importance in premium and controlled-release applications. Over the next decade, encapsulation technologies are expected to gain momentum, driven by rising demand for enhanced stability and targeted delivery. Nevertheless, free-form systems are likely to retain dominance in volume terms, ensuring accessibility across mainstream consumer categories.

What are the Drivers, Restraints, and Key Trends of the Exfoliants Peeling Agents Market?

Complex formulation requirements and evolving dermatology standards are reshaping the Exfoliants Peeling Agents Market, as scalability, bio-based sourcing, and clinical validation gain priority. Despite challenges in regulatory compliance and cost dynamics, long-term growth is expected to remain strong across global ingredient supply chains.

Integration of Dermatology-Backed Claims in Ingredient Development

Market expansion is being reinforced by the integration of dermatology-backed efficacy claims into ingredient innovation pipelines. Exfoliant actives are increasingly being validated through controlled clinical studies, ensuring credibility with professional dermatologists and formulators. Such evidence-based positioning is anticipated to elevate trust among end-use brands, particularly within the premium skincare and medical-grade formulation segments. This alignment with clinical dermatology is expected to improve adoption in therapeutic and preventive care contexts, creating new revenue pathways for raw material suppliers.

Rising Cost Pressures in Bio-Based Ingredient Sourcing

Growth potential is being constrained by escalating costs associated with botanical and fruit-derived exfoliants, which require complex extraction processes and strict compliance with sustainable sourcing standards. Supply fluctuations caused by agricultural variability and rising certification expenses are expected to add further strain. While demand for natural-origin solutions is increasing, limited scalability and price volatility could restrict broader application in cost-sensitive product categories. Formulators may be compelled to adopt hybrid models blending synthetic and bio-based actives, balancing sustainability with affordability.
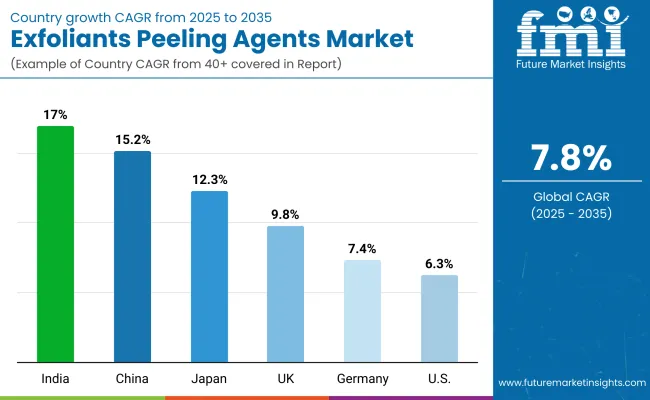
Analysis of Exfoliants Peeling Agents Market By Key Countries

Country Wise Exfoliants Peeling Agents Market

Country CAGR
China 15.2%
USA 6.3%
India 17.0%
UK 9.8%
Germany 7.4%
Japan 12.3%

The global Exfoliants Peeling Agents Market is projected to demonstrate distinct growth patterns across key countries, shaped by consumer sophistication, dermatology integration, and regional sourcing ecosystems. Asia-Pacific is expected to emerge as the fastest-expanding region, supported by China at a 15.2% CAGR and India at 17.0%. Growth in these markets is anticipated to be driven by younger demographics, rapid premiumization of skincare, and greater dermatology engagement in urban centers. India’s trajectory is further strengthened by evolving domestic manufacturing capabilities in cosmetics and increasing alignment with international quality benchmarks.

Japan is forecasted to expand at 12.3% CAGR, supported by demand for high-performance formulations rooted in science-led beauty traditions. Europe maintains a strong growth outlook, with the UK at 9.8% and Germany at 7.4%, reflecting stringent regulatory standards and brand emphasis on sustainability. Broader Europe at 9.1% CAGR is expected to benefit from clean-label ingredient mandates and advanced dermatology practices.

The USA is projected to grow more moderately at 6.3%, reflecting maturity of its skincare market, though opportunities are being created in professional dermatology and clinical peeling solutions. Collectively, country-level trends indicate that innovation pipelines and sustainability credentials will play decisive roles in competitive positioning.
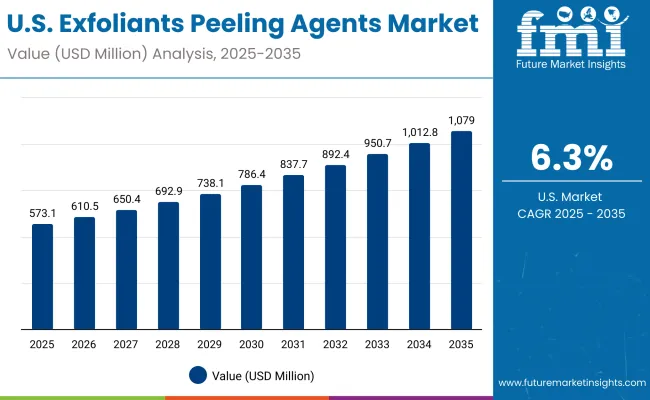
Sales Outlook for Exfoliants Peeling Agents in the United States

Usa Exfoliants Peeling Agents Market

Year USA Exfoliants Peeling Agents Market (USD Million)
2025 573.13
2026 610.56
2027 650.44
2028 692.92
2029 738.18
2030 786.40
2031 837.76
2032 892.48
2033 950.77
2034 1012.87
2035 1079.03

The Exfoliants Peeling Agents Market in the United States is projected to expand at a CAGR of 6.3% during 2025-2035, reflecting steady but mature growth dynamics in one of the most established skincare and dermatology markets. Sales are expected to increase from USD 573.13 million in 2025 to USD 1,079.03 million by 2035, supported by both consumer and professional demand. Professional dermatology treatments are anticipated to play a crucial role, as chemical peeling and advanced exfoliation become widely integrated into clinical practices. Consumer-driven adoption is predicted to continue through mass-market skincare, while premium brands are likely to focus on encapsulated actives for differentiated product positioning.

  • Professional dermatology adoption is strengthening as exfoliants are increasingly integrated into in-office treatments and clinical-grade formulations.
  • Premium skincare brands are projected to favor encapsulated actives, reflecting consumer preference for efficacy, safety, and science-backed solutions.
  • Market maturity is expected to create opportunities for sustainability-driven repositioning, especially in botanical and fruit-derived ingredient categories.

Growth and Expansion Outlook for Exfoliants Peeling Agents Market in the United Kingdom

The Exfoliants Peeling Agents Market in the United Kingdom is projected to expand at a CAGR of 9.8% between 2025 and 2035, reflecting steady demand growth across both consumer skincare and professional treatment channels. A combination of regulatory-driven safety standards and high consumer awareness is expected to guide ingredient adoption. Synthetic actives are anticipated to retain a strong share, though botanical derivatives are gaining visibility as clean-label claims grow in importance. Professional dermatology usage is forecasted to rise as advanced peeling agents are introduced into clinical practices, strengthening supplier opportunities in medical-grade formulations.

  • Regulatory emphasis on product safety is supporting demand for clinically validated actives.
  • Botanical sourcing is being promoted as brands align with clean-label strategies.
  • Professional dermatology treatments are contributing to demand for controlled-release actives.

Growth and Expansion Outlook for Exfoliants Peeling Agents Market in India

The Exfoliants Peeling Agents Market in India is forecasted to grow at a CAGR of 17.0% through 2025–2035, making it one of the fastest-expanding global markets. Strong growth is being enabled by a young consumer base, rising disposable incomes, and premium skincare adoption. Domestic manufacturing capacity for cosmetic ingredients is being scaled, while global suppliers are targeting localized innovation tailored to Indian consumer needs. Dermatology engagement in urban centers is expected to accelerate uptake of professional-grade peeling agents, particularly in preventative and corrective skincare.

  • Local production capacity is being scaled to meet affordability and volume needs.
  • Younger demographics are driving premium skincare adoption at rapid pace.
  • Dermatology adoption in metros is expanding the role of professional peeling solutions.

Sales Outlook for Exfoliants Peeling Agents in China

The Exfoliants Peeling Agents Market in China is projected to expand at a CAGR of 15.2% from 2025 to 2035, supported by premiumization trends and widespread adoption of dermatology treatments. Demand is anticipated to accelerate as advanced exfoliants become central to anti-aging and corrective skincare categories. International and domestic brands are investing in localized ingredient sourcing to meet consumer expectations for transparency and efficacy. Regulatory frameworks encouraging safer formulations are expected to support the adoption of encapsulated and bio-based exfoliants.
  • Premiumization of skincare is reinforcing demand for high-performance exfoliants.
  • Dermatology treatments are accelerating clinical adoption of advanced peeling agents.
  • Localized ingredient sourcing is aligning with consumer demand for safety and transparency.

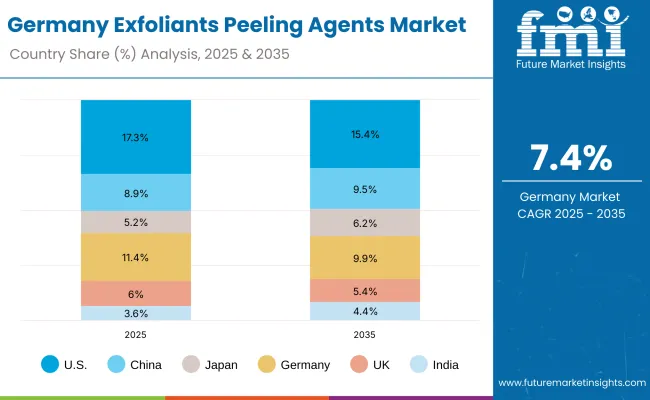
In-depth Analysis of Exfoliants Peeling Agents in Germany

Europe Exfoliants Peeling Agents Market

Country 2025
USA 17.3%
China 8.9%
Japan 5.2%
Germany 11.4%
UK 6.0%
India 3.6%
Country 2035
USA 15.4%
China 9.5%
Japan 6.2%
Germany 9.9%
UK 5.4%
India 4.4%

The Exfoliants Peeling Agents Market in Germany is forecasted to expand at a CAGR of 7.4% during 2025–2035, reflecting stable growth supported by regulatory compliance and high brand innovation. Sustainability-driven sourcing is expected to be prioritized, as Germany continues to be a hub for clean-label and eco-friendly personal care. Professional dermatology treatments are predicted to remain integral to demand, with medical-grade peeling solutions gaining traction in therapeutic contexts. Established skincare brands are anticipated to favor controlled-release and bio-based actives to strengthen premium positioning.
  • Regulatory frameworks are encouraging sustainability and clean-label adoption.
  • Medical-grade formulations are reinforcing dermatology-led usage of exfoliants.
  • Controlled-release systems are being positioned for premium product differentiation.

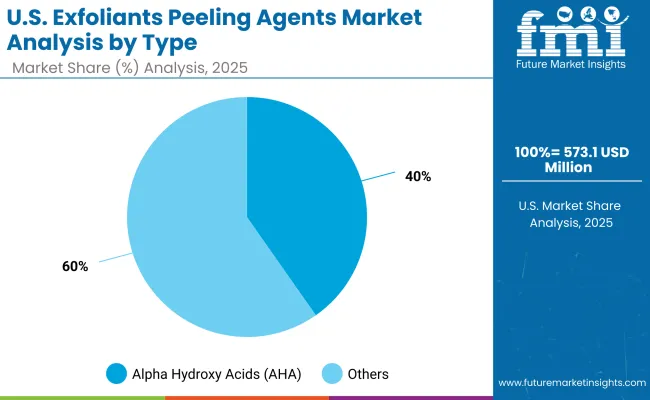
Growth Outlook for Exfoliants Peeling Agents Market in USA

Us Exfoliants Peeling Agents Market

USA By Type Market Value Share, 2025
Alpha hydroxy acids (AHA) 40.3%
Others 59.7%

The Exfoliants Peeling Agents Market in the USA is projected at USD 573.13 million in 2025. AHAs contribute 40.3% (USD 230.97 million), while other exfoliant categories represent 59.7% (USD 342.16 million), highlighting a diversified reliance on multiple active ingredients. The continued significance of AHAs stems from their proven role in skin renewal and compatibility across both consumer and professional formulations. Their adoption is expected to be reinforced by dermatology-led evidence and increasing demand in premium skincare. The larger share of other exfoliants reflects the expanding spectrum of actives, including PHAs, enzyme-based ingredients, and physical scrubbing agents, which provide formulators with flexibility to tailor performance and sustainability claims. Over the next decade, USA growth is anticipated to be supported by innovation in hybrid blends and encapsulated delivery systems that enhance efficacy and safety.
  • The USA Exfoliants Peeling Agents Market is projected at USD 573.13 million in 2025.
  • AHAs hold a 40.3% share, equivalent to USD 230.97 million.
  • Other exfoliants dominate with 59.7%, reflecting wider ingredient diversity and innovation.
  • Premium skincare and dermatology-led claims are expected to reinforce AHA usage.

Opportunity Analysis of China Exfoliants Peeling Agents Market

China Exfoliants Peeling Agents Market

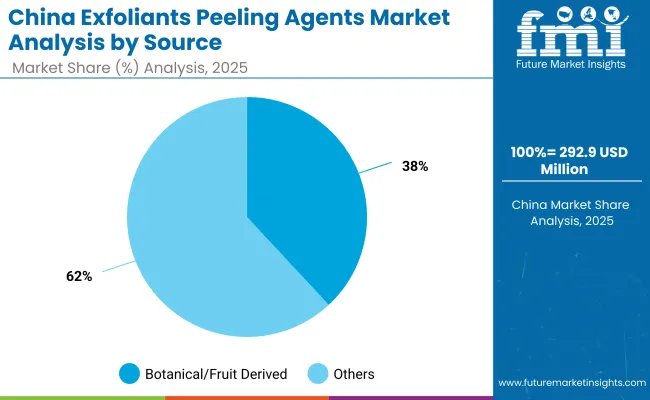
China By Source Market Value Share, 2025
Botanical/fruit derived 38.1%
Others 61.9%

The Exfoliants Peeling Agents Market in China is projected at USD 292.93 million in 2025. Botanical and fruit-derived exfoliants contribute 38.1% (USD 111.61 million), while other sources dominate with 61.9% (USD 181.32 million). The stronger share of synthetic and alternative sources reflects their scalability and consistency in large-scale production, which aligns with China’s rapidly expanding skincare and personal care sector. Botanical-derived actives, however, are expected to see accelerating demand as clean-label claims and consumer preference for natural-origin solutions gain prominence in premium skincare. The market’s long-term growth is anticipated to be reinforced by regulatory encouragement for safer, high-quality formulations and increasing dermatology adoption of clinically validated bio-based actives. Hybrid sourcing strategies that combine performance-driven synthetics with sustainability-linked botanicals are likely to define the competitive positioning of suppliers in China.
  • The China market is projected at USD 292.93 million in 2025.
  • Botanical/fruit-derived exfoliants hold 38.1%, equivalent to USD 111.61 million.
  • Other sources dominate with 61.9%, reflecting scalability and volume supply.
  • Rising demand for natural-origin actives is expected to strengthen botanical growth.

Competitive Landscape of Exfoliants Peeling Agents Market

Exfoliants Peeling Agents Market By Company

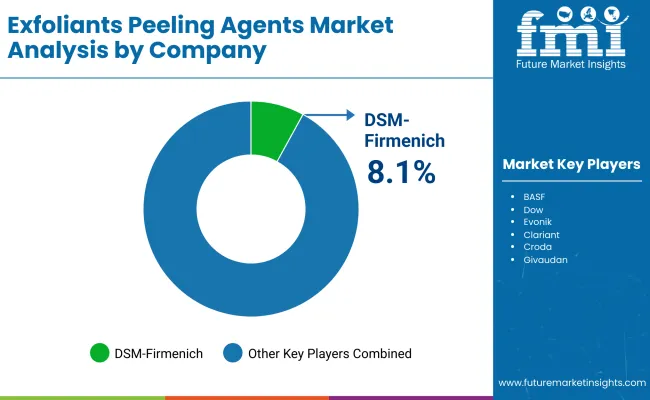
Company Global Value Share 2025
DSM-Firmenich 8.1%
Others 91.9%

The Exfoliants Peeling Agents Market is moderately fragmented, with global leaders, mid-sized innovators, and niche ingredient specialists competing across a wide spectrum of formulation needs. Global suppliers such as DSM-Firmenich, BASF, Croda, Clariant, Evonik, Symrise, and Givaudan are recognized as core participants in this market. Their leadership is anchored in diversified ingredient portfolios, extensive R&D pipelines, and global distribution networks that cater to skincare, haircare, and professional dermatology channels. DSM-Firmenich is estimated to dominate with a global share of 8.1% in 2025, and its leadership is expected to have been established with a slightly lower but significant share in 2024 (around 7.9%), reflecting strong positioning in active ingredient innovation.

Mid-sized companies including Ashland, Seppic, and Provital are strengthening their presence through botanical and fermentation-derived actives, supported by sustainability claims and partnerships with global skincare brands. These players are increasingly targeting encapsulated and controlled-release delivery systems to compete in premium and professional-grade formulations.

Niche-focused innovators are developing highly specialized exfoliants tailored for dermatology, natural cosmetics, and hybrid formulations, with differentiation achieved through sustainability-driven sourcing and clinical validation. Competitive dynamics are shifting toward evidence-based efficacy, bio-based alternatives, and integrated ingredient platforms that align with dermatology-backed claims and consumer preference for safety and transparency.

Key Developments in Exfoliants Peeling Agents Market

  • On May 13, 2025, new amendments to the EU Cosmetics Regulation (Commission Regulation (EU) 2025/877) were published, adding 21 ingredients to the prohibited list and revising one restricted ingredient under Regulation (EC) No 1223/2009.
  • On May 1, 2025, full safety assessment dossiers were mandated in China for all cosmetic registrations and notifications, in compliance with the 2021 Technical Guidelines for Cosmetics Safety Assessment.

Scope of the Report

Item Value
Quantitative Units USD 3,307.9 million (2025); USD 7,006.3 million (2035); 7.8% CAGR (2025 to 2035)
Type Alpha hydroxy acids (AHA); Others (BHA, PHA, enzyme-based, physical scrubbing agents)
Source Botanical/fruit derived; Others (synthetic & fermentation-derived)
Delivery System Free form; Others (encapsulated, powder-to-liquid activators, gel-base systems)
Application Facial peels & serums; Body scrubs; Scalp exfoliants; Professional chemical peels
End-use Industry Skincare brands; Hair & scalp care brands; Professional dermatology/clinics
Regions Covered North America; Europe; East Asia; South Asia & Pacific; Latin America; Middle East & Africa
Countries Covered United States; China; India; United Kingdom; Germany; Japan
Key Companies Profiled DSM-Firmenich; BASF; Croda; Clariant; Evonik; Symrise; Givaudan; Ashland; Seppic; Provital
Additional Attributes Segment shares (e.g., Synthetic 59.7% vs Botanical 38.1% in 2025; Free form 52%); country growth (India 17.0% CAGR; China 15.2%; USA 6.3%); sustainability and clean-label sourcing; innovation in encapsulation/controlled release; regulatory compliance shaping reformulation; professional dermatology adoption; premiumization in Asia; USA value path USD 573.13 million (2025) → USD 1,079.03 million (2035).

Key Segments

By Type:

  • Alpha hydroxy acids (AHA)
  • Beta hydroxy acids (BHA)
  • Poly hydroxy acids (PHA)
  • Enzyme-based exfoliants
  • Physical scrubbing agents

By Source:

  • Synthetic
  • Botanical/fruit derived
  • Fermentation-derived

By Delivery System:

  • Free form
  • Encapsulated
  • Powder-to-liquid activators

By Physical Form:

  • Liquid concentrate
  • Powder
  • Gel base

By Application:

  • Facial peels & serums
  • Body scrubs
  • Scalp exfoliants
  • Professional chemical peels

By End Use:

  • Skincare brands
  • Hair & scalp care
  • Professional dermatology

By Region:

  • North America
  • Latin America
  • Europe
  • East Asia
  • South Asia & Pacific
  • Middle East and Africa

Table of Content

  1. Executive Summary
    • Global Market Outlook
    • Demand-side Trends
    • Supply-side Trends
    • Technology Roadmap Analysis
    • Analysis and Recommendations
  2. Market Overview
    • Market Coverage / Taxonomy
    • Market Definition / Scope / Limitations
  3. Market Background
    • Market Dynamics
      • Drivers
      • Restraints
      • Opportunity
      • Trends
    • Scenario Forecast
      • Demand in Optimistic Scenario
      • Demand in Likely Scenario
      • Demand in Conservative Scenario
    • Opportunity Map Analysis
    • Product Life Cycle Analysis
    • Supply Chain Analysis
      • Supply Side Participants and their Roles
        • Producers
        • Mid-Level Participants (Traders/ Agents/ Brokers)
        • Wholesalers and Distributors
      • Value Added and Value Created at Node in the Supply Chain
      • List of Raw Material Suppliers
      • List of Existing and Potential Buyer’s
    • Investment Feasibility Matrix
    • Value Chain Analysis
      • Profit Margin Analysis
      • Wholesalers and Distributors
      • Retailers
    • PESTLE and Porter’s Analysis
    • Regulatory Landscape
      • By Key Regions
      • By Key Countries
    • Regional Parent Market Outlook
    • Production and Consumption Statistics
    • Import and Export Statistics
  4. Global Market Analysis 2020-2024 and Forecast, 2025-2035
    • Historical Market Size Value (USD Million) & Volume (Units) Analysis, 2020-2024
    • Current and Future Market Size Value (USD Million) & Volume (Units) Projections, 2025-2035
      • Y-o-Y Growth Trend Analysis
      • Absolute $ Opportunity Analysis
  5. Global Market Analysis 2020-2024 and Forecast 2025-2035, By Type
    • Introduction / Key Findings
    • Historical Market Size Value (USD Million) & Volume (Units) Analysis By Type, 2020-2024
    • Current and Future Market Size Value (USD Million) & Volume (Units) Analysis and Forecast By Type, 2025-2035
      • Alpha hydroxy acids (AHA)
      • Beta hydroxy acids (BHA)
      • Poly hydroxy acids (PHA)
      • Enzyme-based exfoliants
      • Physical scrubbing agents
    • Y-o-Y Growth Trend Analysis By Type, 2020-2024
    • Absolute $ Opportunity Analysis By Type, 2025-2035
  6. Global Market Analysis 2020-2024 and Forecast 2025-2035, By Source
    • Introduction / Key Findings
    • Historical Market Size Value (USD Million) & Volume (Units) Analysis By Source, 2020-2024
    • Current and Future Market Size Value (USD Million) & Volume (Units) Analysis and Forecast By Source, 2025-2035
      • Synthetic
      • Botanical/fruit derived
      • Fermentation-derived
    • Y-o-Y Growth Trend Analysis By Source, 2020-2024
    • Absolute $ Opportunity Analysis By Source, 2025-2035
  7. Global Market Analysis 2020-2024 and Forecast 2025-2035, By Delivery System
    • Introduction / Key Findings
    • Historical Market Size Value (USD Million) & Volume (Units) Analysis By Delivery System, 2020-2024
    • Current and Future Market Size Value (USD Million) & Volume (Units) Analysis and Forecast By Delivery System, 2025-2035
      • Free form
      • Encapsulated
      • Powder-to-liquid activators
    • Y-o-Y Growth Trend Analysis By Delivery System, 2020-2024
    • Absolute $ Opportunity Analysis By Delivery System, 2025-2035
  8. Global Market Analysis 2020-2024 and Forecast 2025-2035, By Physical Form
    • Introduction / Key Findings
    • Historical Market Size Value (USD Million) & Volume (Units) Analysis By Physical Form, 2020-2024
    • Current and Future Market Size Value (USD Million) & Volume (Units) Analysis and Forecast By Physical Form, 2025-2035
      • Liquid concentrate
      • Powder
      • Gel base
    • Y-o-Y Growth Trend Analysis By Physical Form, 2020-2024
    • Absolute $ Opportunity Analysis By Physical Form, 2025-2035
  9. Global Market Analysis 2020-2024 and Forecast 2025-2035, By Application
    • Introduction / Key Findings
    • Historical Market Size Value (USD Million) & Volume (Units) Analysis By Application, 2020-2024
    • Current and Future Market Size Value (USD Million) & Volume (Units) Analysis and Forecast By Application, 2025-2035
      • Facial peels & serums
      • Body scrubs
      • Scalp exfoliants
      • Professional chemical peels
    • Y-o-Y Growth Trend Analysis By Application, 2020-2024
    • Absolute $ Opportunity Analysis By Application, 2025-2035
  10. Global Market Analysis 2020-2024 and Forecast 2025-2035, By End Use
    • Introduction / Key Findings
    • Historical Market Size Value (USD Million) & Volume (Units) Analysis By End Use, 2020-2024
    • Current and Future Market Size Value (USD Million) & Volume (Units) Analysis and Forecast By End Use, 2025-2035
      • Skincare brands
      • Hair & scalp care
      • Professional dermatology
    • Y-o-Y Growth Trend Analysis By End Use, 2020-2024
    • Absolute $ Opportunity Analysis By End Use, 2025-2035
  11. Global Market Analysis 2020-2024 and Forecast 2025-2035, By Region
    • Introduction
    • Historical Market Size Value (USD Million) & Volume (Units) Analysis By Region, 2020-2024
    • Current Market Size Value (USD Million) & Volume (Units) Analysis and Forecast By Region, 2025-2035
      • North America
      • Latin America
      • Europe
      • East Asia
      • South Asia & Pacific
      • Middle East and Africa
    • Market Attractiveness Analysis By Region
  12. North America Market Analysis 2020-2024 and Forecast 2025-2035, By Country
    • Historical Market Size Value (USD Million) & Volume (Units) Trend Analysis By Market Taxonomy, 2020-2024
    • Market Size Value (USD Million) & Volume (Units) Forecast By Market Taxonomy, 2025-2035
      • By Country
        • U.S.
        • Canada
      • By Type
      • By Source
      • By Delivery System
      • By Physical Form
      • By Application
      • By End Use
    • Market Attractiveness Analysis
      • By Country
      • By Type
      • By Source
      • By Delivery System
      • By Physical Form
      • By Application
      • By End Use
    • Key Takeaways
  13. Latin America Market Analysis 2020-2024 and Forecast 2025-2035, By Country
    • Historical Market Size Value (USD Million) & Volume (Units) Trend Analysis By Market Taxonomy, 2020-2024
    • Market Size Value (USD Million) & Volume (Units) Forecast By Market Taxonomy, 2025-2035
      • By Country
        • Brazil
        • Mexico
        • Colombia
        • Rest of Latin America
      • By Type
      • By Source
      • By Delivery System
      • By Physical Form
      • By Application
      • By End Use
    • Market Attractiveness Analysis
      • By Country
      • By Type
      • By Source
      • By Delivery System
      • By Physical Form
      • By Application
      • By End Use
    • Key Takeaways
  14. Europe Market Analysis 2020-2024 and Forecast 2025-2035, By Country
    • Historical Market Size Value (USD Million) & Volume (Units) Trend Analysis By Market Taxonomy, 2020-2024
    • Market Size Value (USD Million) & Volume (Units) Forecast By Market Taxonomy, 2025-2035
      • By Country
        • Germany
        • U.K.
        • France
        • Italy
        • Spain
        • Belgium
        • Netherlands
        • Nordic
        • Switzerland
        • Russia
        • Poland
        • Rest of Europe
      • By Type
      • By Source
      • By Delivery System
      • By Physical Form
      • By Application
      • By End Use
    • Market Attractiveness Analysis
      • By Country
      • By Type
      • By Source
      • By Delivery System
      • By Physical Form
      • By Application
      • By End Use
    • Key Takeaways
  15. East Asia Market Analysis 2020-2024 and Forecast 2025-2035, By Country
    • Historical Market Size Value (USD Million) & Volume (Units) Trend Analysis By Market Taxonomy, 2020-2024
    • Market Size Value (USD Million) & Volume (Units) Forecast By Market Taxonomy, 2025-2035
      • By Country
        • China
        • Japan
        • South Korea
      • By Type
      • By Source
      • By Delivery System
      • By Physical Form
      • By Application
      • By End Use
    • Market Attractiveness Analysis
      • By Country
      • By Type
      • By Source
      • By Delivery System
      • By Physical Form
      • By Application
      • By End Use
    • Key Takeaways
  16. South Asia & Pacific Market Analysis 2020-2024 and Forecast 2025-2035, By Country
    • Historical Market Size Value (USD Million) & Volume (Units) Trend Analysis By Market Taxonomy, 2020-2024
    • Market Size Value (USD Million) & Volume (Units) Forecast By Market Taxonomy, 2025-2035
      • By Country
        • India
        • Thailand
        • Malaysia
        • Indonesia
        • Singapore
        • Vietnam
        • Australia
        • New Zealand
        • Rest of South Asia
      • By Type
      • By Source
      • By Delivery System
      • By Physical Form
      • By Application
      • By End Use
    • Market Attractiveness Analysis
      • By Country
      • By Type
      • By Source
      • By Delivery System
      • By Physical Form
      • By Application
      • By End Use
    • Key Takeaways
  17. Middle East and Africa Market Analysis 2020-2024 and Forecast 2025-2035, By Country
    • Historical Market Size Value (USD Million) & Volume (Units) Trend Analysis By Market Taxonomy, 2020-2024
    • Market Size Value (USD Million) & Volume (Units) Forecast By Market Taxonomy, 2025-2035
      • By Country
        • Turkey
        • UAE
        • Saudi Arabia
        • Israel
        • Other GCC Countries
        • North Africa
        • South Africa
      • By Type
      • By Source
      • By Delivery System
      • By Physical Form
      • By Application
      • By End Use
    • Market Attractiveness Analysis
      • By Country
      • By Type
      • By Source
      • By Delivery System
      • By Physical Form
      • By Application
      • By End Use
    • Key Takeaways
  18. Key Countries Market Analysis
    • U.S.
      • Pricing Analysis
      • Market Share Analysis, 2024
        • By Type
        • By Source
        • By Delivery System
        • By Physical Form
        • By Application
        • By End Use
    • Canada
      • Pricing Analysis
      • Market Share Analysis, 2024
        • By Type
        • By Source
        • By Delivery System
        • By Physical Form
        • By Application
        • By End Use
    • Brazil
      • Pricing Analysis
      • Market Share Analysis, 2024
        • By Type
        • By Source
        • By Delivery System
        • By Physical Form
        • By Application
        • By End Use
    • Mexico
      • Pricing Analysis
      • Market Share Analysis, 2024
        • By Type
        • By Source
        • By Delivery System
        • By Physical Form
        • By Application
        • By End Use
    • Colombia
      • Pricing Analysis
      • Market Share Analysis, 2024
        • By Type
        • By Source
        • By Delivery System
        • By Physical Form
        • By Application
        • By End Use
    • Germany
      • Pricing Analysis
      • Market Share Analysis, 2024
        • By Type
        • By Source
        • By Delivery System
        • By Physical Form
        • By Application
        • By End Use
    • U.K.
      • Pricing Analysis
      • Market Share Analysis, 2024
        • By Type
        • By Source
        • By Delivery System
        • By Physical Form
        • By Application
        • By End Use
    • France
      • Pricing Analysis
      • Market Share Analysis, 2024
        • By Type
        • By Source
        • By Delivery System
        • By Physical Form
        • By Application
        • By End Use
    • Italy
      • Pricing Analysis
      • Market Share Analysis, 2024
        • By Type
        • By Source
        • By Delivery System
        • By Physical Form
        • By Application
        • By End Use
    • Spain
      • Pricing Analysis
      • Market Share Analysis, 2024
        • By Type
        • By Source
        • By Delivery System
        • By Physical Form
        • By Application
        • By End Use
    • Belgium
      • Pricing Analysis
      • Market Share Analysis, 2024
        • By Type
        • By Source
        • By Delivery System
        • By Physical Form
        • By Application
        • By End Use
    • Netherlands
      • Pricing Analysis
      • Market Share Analysis, 2024
        • By Type
        • By Source
        • By Delivery System
        • By Physical Form
        • By Application
        • By End Use
    • Nordic
      • Pricing Analysis
      • Market Share Analysis, 2024
        • By Type
        • By Source
        • By Delivery System
        • By Physical Form
        • By Application
        • By End Use
    • Switzerland
      • Pricing Analysis
      • Market Share Analysis, 2024
        • By Type
        • By Source
        • By Delivery System
        • By Physical Form
        • By Application
        • By End Use
    • Russia
      • Pricing Analysis
      • Market Share Analysis, 2024
        • By Type
        • By Source
        • By Delivery System
        • By Physical Form
        • By Application
        • By End Use
    • Poland
      • Pricing Analysis
      • Market Share Analysis, 2024
        • By Type
        • By Source
        • By Delivery System
        • By Physical Form
        • By Application
        • By End Use
    • China
      • Pricing Analysis
      • Market Share Analysis, 2024
        • By Type
        • By Source
        • By Delivery System
        • By Physical Form
        • By Application
        • By End Use
    • Japan
      • Pricing Analysis
      • Market Share Analysis, 2024
        • By Type
        • By Source
        • By Delivery System
        • By Physical Form
        • By Application
        • By End Use
    • South Korea
      • Pricing Analysis
      • Market Share Analysis, 2024
        • By Type
        • By Source
        • By Delivery System
        • By Physical Form
        • By Application
        • By End Use
    • India
      • Pricing Analysis
      • Market Share Analysis, 2024
        • By Type
        • By Source
        • By Delivery System
        • By Physical Form
        • By Application
        • By End Use
    • Thailand
      • Pricing Analysis
      • Market Share Analysis, 2024
        • By Type
        • By Source
        • By Delivery System
        • By Physical Form
        • By Application
        • By End Use
    • Indonesia
      • Pricing Analysis
      • Market Share Analysis, 2024
        • By Type
        • By Source
        • By Delivery System
        • By Physical Form
        • By Application
        • By End Use
    • Australia
      • Pricing Analysis
      • Market Share Analysis, 2024
        • By Type
        • By Source
        • By Delivery System
        • By Physical Form
        • By Application
        • By End Use
    • New Zealand
      • Pricing Analysis
      • Market Share Analysis, 2024
        • By Type
        • By Source
        • By Delivery System
        • By Physical Form
        • By Application
        • By End Use
    • Turkey
      • Pricing Analysis
      • Market Share Analysis, 2024
        • By Type
        • By Source
        • By Delivery System
        • By Physical Form
        • By Application
        • By End Use
    • UAE
      • Pricing Analysis
      • Market Share Analysis, 2024
        • By Type
        • By Source
        • By Delivery System
        • By Physical Form
        • By Application
        • By End Use
    • Saudi Arabia
      • Pricing Analysis
      • Market Share Analysis, 2024
        • By Type
        • By Source
        • By Delivery System
        • By Physical Form
        • By Application
        • By End Use
    • Israel
      • Pricing Analysis
      • Market Share Analysis, 2024
        • By Type
        • By Source
        • By Delivery System
        • By Physical Form
        • By Application
        • By End Use
    • North Africa
      • Pricing Analysis
      • Market Share Analysis, 2024
        • By Type
        • By Source
        • By Delivery System
        • By Physical Form
        • By Application
        • By End Use
    • South Africa
      • Pricing Analysis
      • Market Share Analysis, 2024
        • By Type
        • By Source
        • By Delivery System
        • By Physical Form
        • By Application
        • By End Use
  19. Market Structure Analysis
    • Competition Dashboard
    • Competition Benchmarking
    • Market Share Analysis of Top Players
      • By Regional
      • By Type
      • By Source
      • By Delivery System
      • By Physical Form
      • By Application
      • By End Use
  20. Competition Analysis
    • Competition Deep Dive
      • DSM-Firmenich
        • Overview
        • Product Portfolio
        • Profitability by Market Segments (Product/Age /Sales Channel/Region)
        • Sales Footprint
        • Strategy Overview
          • Marketing Strategy
          • Product Strategy
          • Channel Strategy
      • BASF
        • Overview
        • Product Portfolio
        • Profitability by Market Segments (Product/Age /Sales Channel/Region)
        • Sales Footprint
        • Strategy Overview
          • Marketing Strategy
          • Product Strategy
          • Channel Strategy
      • Croda
        • Overview
        • Product Portfolio
        • Profitability by Market Segments (Product/Age /Sales Channel/Region)
        • Sales Footprint
        • Strategy Overview
          • Marketing Strategy
          • Product Strategy
          • Channel Strategy
      • Clariant
        • Overview
        • Product Portfolio
        • Profitability by Market Segments (Product/Age /Sales Channel/Region)
        • Sales Footprint
        • Strategy Overview
          • Marketing Strategy
          • Product Strategy
          • Channel Strategy
      • Evonik
        • Overview
        • Product Portfolio
        • Profitability by Market Segments (Product/Age /Sales Channel/Region)
        • Sales Footprint
        • Strategy Overview
          • Marketing Strategy
          • Product Strategy
          • Channel Strategy
      • Symrise
        • Overview
        • Product Portfolio
        • Profitability by Market Segments (Product/Age /Sales Channel/Region)
        • Sales Footprint
        • Strategy Overview
          • Marketing Strategy
          • Product Strategy
          • Channel Strategy
      • Givaudan
        • Overview
        • Product Portfolio
        • Profitability by Market Segments (Product/Age /Sales Channel/Region)
        • Sales Footprint
        • Strategy Overview
          • Marketing Strategy
          • Product Strategy
          • Channel Strategy
      • Ashland
        • Overview
        • Product Portfolio
        • Profitability by Market Segments (Product/Age /Sales Channel/Region)
        • Sales Footprint
        • Strategy Overview
          • Marketing Strategy
          • Product Strategy
          • Channel Strategy
      • Seppic
        • Overview
        • Product Portfolio
        • Profitability by Market Segments (Product/Age /Sales Channel/Region)
        • Sales Footprint
        • Strategy Overview
          • Marketing Strategy
          • Product Strategy
          • Channel Strategy
      • Provital
        • Overview
        • Product Portfolio
        • Profitability by Market Segments (Product/Age /Sales Channel/Region)
        • Sales Footprint
        • Strategy Overview
          • Marketing Strategy
          • Product Strategy
          • Channel Strategy
      • Others
        • Overview
        • Product Portfolio
        • Profitability by Market Segments (Product/Age /Sales Channel/Region)
        • Sales Footprint
        • Strategy Overview
          • Marketing Strategy
          • Product Strategy
          • Channel Strategy
  21. Assumptions & Acronyms Used
  22. Research Methodology

List of Tables

  • Table 1: Global Market Value (USD Million) Forecast by Region, 2020-2035
  • Table 2: Global Market Volume (Units) Forecast by Region, 2020-2035
  • Table 3: Global Market Value (USD Million) Forecast by Type, 2020-2035
  • Table 4: Global Market Volume (Units) Forecast by Type, 2020-2035
  • Table 5: Global Market Value (USD Million) Forecast by Source, 2020-2035
  • Table 6: Global Market Volume (Units) Forecast by Source, 2020-2035
  • Table 7: Global Market Value (USD Million) Forecast by Delivery System, 2020-2035
  • Table 8: Global Market Volume (Units) Forecast by Delivery System, 2020-2035
  • Table 9: Global Market Value (USD Million) Forecast by Physical Form, 2020-2035
  • Table 10: Global Market Volume (Units) Forecast by Physical Form, 2020-2035
  • Table 11: Global Market Value (USD Million) Forecast by Application, 2020-2035
  • Table 12: Global Market Volume (Units) Forecast by Application, 2020-2035
  • Table 13: Global Market Value (USD Million) Forecast by End Use, 2020-2035
  • Table 14: Global Market Volume (Units) Forecast by End Use, 2020-2035
  • Table 15: North America Market Value (USD Million) Forecast by Country, 2020-2035
  • Table 16: North America Market Volume (Units) Forecast by Country, 2020-2035
  • Table 17: North America Market Value (USD Million) Forecast by Type, 2020-2035
  • Table 18: North America Market Volume (Units) Forecast by Type, 2020-2035
  • Table 19: North America Market Value (USD Million) Forecast by Source, 2020-2035
  • Table 20: North America Market Volume (Units) Forecast by Source, 2020-2035
  • Table 21: North America Market Value (USD Million) Forecast by Delivery System, 2020-2035
  • Table 22: North America Market Volume (Units) Forecast by Delivery System, 2020-2035
  • Table 23: North America Market Value (USD Million) Forecast by Physical Form, 2020-2035
  • Table 24: North America Market Volume (Units) Forecast by Physical Form, 2020-2035
  • Table 25: North America Market Value (USD Million) Forecast by Application, 2020-2035
  • Table 26: North America Market Volume (Units) Forecast by Application, 2020-2035
  • Table 27: North America Market Value (USD Million) Forecast by End Use, 2020-2035
  • Table 28: North America Market Volume (Units) Forecast by End Use, 2020-2035
  • Table 29: Latin America Market Value (USD Million) Forecast by Country, 2020-2035
  • Table 30: Latin America Market Volume (Units) Forecast by Country, 2020-2035
  • Table 31: Latin America Market Value (USD Million) Forecast by Type, 2020-2035
  • Table 32: Latin America Market Volume (Units) Forecast by Type, 2020-2035
  • Table 33: Latin America Market Value (USD Million) Forecast by Source, 2020-2035
  • Table 34: Latin America Market Volume (Units) Forecast by Source, 2020-2035
  • Table 35: Latin America Market Value (USD Million) Forecast by Delivery System, 2020-2035
  • Table 36: Latin America Market Volume (Units) Forecast by Delivery System, 2020-2035
  • Table 37: Latin America Market Value (USD Million) Forecast by Physical Form, 2020-2035
  • Table 38: Latin America Market Volume (Units) Forecast by Physical Form, 2020-2035
  • Table 39: Latin America Market Value (USD Million) Forecast by Application, 2020-2035
  • Table 40: Latin America Market Volume (Units) Forecast by Application, 2020-2035
  • Table 41: Latin America Market Value (USD Million) Forecast by End Use, 2020-2035
  • Table 42: Latin America Market Volume (Units) Forecast by End Use, 2020-2035
  • Table 43: Europe Market Value (USD Million) Forecast by Country, 2020-2035
  • Table 44: Europe Market Volume (Units) Forecast by Country, 2020-2035
  • Table 45: Europe Market Value (USD Million) Forecast by Type, 2020-2035
  • Table 46: Europe Market Volume (Units) Forecast by Type, 2020-2035
  • Table 47: Europe Market Value (USD Million) Forecast by Source, 2020-2035
  • Table 48: Europe Market Volume (Units) Forecast by Source, 2020-2035
  • Table 49: Europe Market Value (USD Million) Forecast by Delivery System, 2020-2035
  • Table 50: Europe Market Volume (Units) Forecast by Delivery System, 2020-2035
  • Table 51: Europe Market Value (USD Million) Forecast by Physical Form, 2020-2035
  • Table 52: Europe Market Volume (Units) Forecast by Physical Form, 2020-2035
  • Table 53: Europe Market Value (USD Million) Forecast by Application, 2020-2035
  • Table 54: Europe Market Volume (Units) Forecast by Application, 2020-2035
  • Table 55: Europe Market Value (USD Million) Forecast by End Use, 2020-2035
  • Table 56: Europe Market Volume (Units) Forecast by End Use, 2020-2035
  • Table 57: East Asia Market Value (USD Million) Forecast by Country, 2020-2035
  • Table 58: East Asia Market Volume (Units) Forecast by Country, 2020-2035
  • Table 59: East Asia Market Value (USD Million) Forecast by Type, 2020-2035
  • Table 60: East Asia Market Volume (Units) Forecast by Type, 2020-2035
  • Table 61: East Asia Market Value (USD Million) Forecast by Source, 2020-2035
  • Table 62: East Asia Market Volume (Units) Forecast by Source, 2020-2035
  • Table 63: East Asia Market Value (USD Million) Forecast by Delivery System, 2020-2035
  • Table 64: East Asia Market Volume (Units) Forecast by Delivery System, 2020-2035
  • Table 65: East Asia Market Value (USD Million) Forecast by Physical Form, 2020-2035
  • Table 66: East Asia Market Volume (Units) Forecast by Physical Form, 2020-2035
  • Table 67: East Asia Market Value (USD Million) Forecast by Application, 2020-2035
  • Table 68: East Asia Market Volume (Units) Forecast by Application, 2020-2035
  • Table 69: East Asia Market Value (USD Million) Forecast by End Use, 2020-2035
  • Table 70: East Asia Market Volume (Units) Forecast by End Use, 2020-2035
  • Table 71: South Asia & Pacific Market Value (USD Million) Forecast by Country, 2020-2035
  • Table 72: South Asia & Pacific Market Volume (Units) Forecast by Country, 2020-2035
  • Table 73: South Asia & Pacific Market Value (USD Million) Forecast by Type, 2020-2035
  • Table 74: South Asia & Pacific Market Volume (Units) Forecast by Type, 2020-2035
  • Table 75: South Asia & Pacific Market Value (USD Million) Forecast by Source, 2020-2035
  • Table 76: South Asia & Pacific Market Volume (Units) Forecast by Source, 2020-2035
  • Table 77: South Asia & Pacific Market Value (USD Million) Forecast by Delivery System, 2020-2035
  • Table 78: South Asia & Pacific Market Volume (Units) Forecast by Delivery System, 2020-2035
  • Table 79: South Asia & Pacific Market Value (USD Million) Forecast by Physical Form, 2020-2035
  • Table 80: South Asia & Pacific Market Volume (Units) Forecast by Physical Form, 2020-2035
  • Table 81: South Asia & Pacific Market Value (USD Million) Forecast by Application, 2020-2035
  • Table 82: South Asia & Pacific Market Volume (Units) Forecast by Application, 2020-2035
  • Table 83: South Asia & Pacific Market Value (USD Million) Forecast by End Use, 2020-2035
  • Table 84: South Asia & Pacific Market Volume (Units) Forecast by End Use, 2020-2035
  • Table 85: Middle East and Africa Market Value (USD Million) Forecast by Country, 2020-2035
  • Table 86: Middle East and Africa Market Volume (Units) Forecast by Country, 2020-2035
  • Table 87: Middle East and Africa Market Value (USD Million) Forecast by Type, 2020-2035
  • Table 88: Middle East and Africa Market Volume (Units) Forecast by Type, 2020-2035
  • Table 89: Middle East and Africa Market Value (USD Million) Forecast by Source, 2020-2035
  • Table 90: Middle East and Africa Market Volume (Units) Forecast by Source, 2020-2035
  • Table 91: Middle East and Africa Market Value (USD Million) Forecast by Delivery System, 2020-2035
  • Table 92: Middle East and Africa Market Volume (Units) Forecast by Delivery System, 2020-2035
  • Table 93: Middle East and Africa Market Value (USD Million) Forecast by Physical Form, 2020-2035
  • Table 94: Middle East and Africa Market Volume (Units) Forecast by Physical Form, 2020-2035
  • Table 95: Middle East and Africa Market Value (USD Million) Forecast by Application, 2020-2035
  • Table 96: Middle East and Africa Market Volume (Units) Forecast by Application, 2020-2035
  • Table 97: Middle East and Africa Market Value (USD Million) Forecast by End Use, 2020-2035
  • Table 98: Middle East and Africa Market Volume (Units) Forecast by End Use, 2020-2035

List of Figures

  • Figure 1: Global Market Value (USD Million) by Type, 2025-2035
  • Figure 2: Global Market Value (USD Million) by Source, 2025-2035
  • Figure 3: Global Market Value (USD Million) by Delivery System, 2025-2035
  • Figure 4: Global Market Value (USD Million) by Physical Form, 2025-2035
  • Figure 5: Global Market Value (USD Million) by Application, 2025-2035
  • Figure 6: Global Market Value (USD Million) by End Use, 2025-2035
  • Figure 7: Global Market Value (USD Million) by Region, 2025-2035
  • Figure 8: Global Market Value (USD Million) Analysis by Region, 2020-2035
  • Figure 9: Global Market Volume (Units) Analysis by Region, 2020-2035
  • Figure 10: Global Market Value Share (%) and BPS Analysis by Region, 2025-2035
  • Figure 11: Global Market Y-o-Y Growth (%) Projections by Region, 2025-2035
  • Figure 12: Global Market Value (USD Million) Analysis by Type, 2020-2035
  • Figure 13: Global Market Volume (Units) Analysis by Type, 2020-2035
  • Figure 14: Global Market Value Share (%) and BPS Analysis by Type, 2025-2035
  • Figure 15: Global Market Y-o-Y Growth (%) Projections by Type, 2025-2035
  • Figure 16: Global Market Value (USD Million) Analysis by Source, 2020-2035
  • Figure 17: Global Market Volume (Units) Analysis by Source, 2020-2035
  • Figure 18: Global Market Value Share (%) and BPS Analysis by Source, 2025-2035
  • Figure 19: Global Market Y-o-Y Growth (%) Projections by Source, 2025-2035
  • Figure 20: Global Market Value (USD Million) Analysis by Delivery System, 2020-2035
  • Figure 21: Global Market Volume (Units) Analysis by Delivery System, 2020-2035
  • Figure 22: Global Market Value Share (%) and BPS Analysis by Delivery System, 2025-2035
  • Figure 23: Global Market Y-o-Y Growth (%) Projections by Delivery System, 2025-2035
  • Figure 24: Global Market Value (USD Million) Analysis by Physical Form, 2020-2035
  • Figure 25: Global Market Volume (Units) Analysis by Physical Form, 2020-2035
  • Figure 26: Global Market Value Share (%) and BPS Analysis by Physical Form, 2025-2035
  • Figure 27: Global Market Y-o-Y Growth (%) Projections by Physical Form, 2025-2035
  • Figure 28: Global Market Value (USD Million) Analysis by Application, 2020-2035
  • Figure 29: Global Market Volume (Units) Analysis by Application, 2020-2035
  • Figure 30: Global Market Value Share (%) and BPS Analysis by Application, 2025-2035
  • Figure 31: Global Market Y-o-Y Growth (%) Projections by Application, 2025-2035
  • Figure 32: Global Market Value (USD Million) Analysis by End Use, 2020-2035
  • Figure 33: Global Market Volume (Units) Analysis by End Use, 2020-2035
  • Figure 34: Global Market Value Share (%) and BPS Analysis by End Use, 2025-2035
  • Figure 35: Global Market Y-o-Y Growth (%) Projections by End Use, 2025-2035
  • Figure 36: Global Market Attractiveness by Type, 2025-2035
  • Figure 37: Global Market Attractiveness by Source, 2025-2035
  • Figure 38: Global Market Attractiveness by Delivery System, 2025-2035
  • Figure 39: Global Market Attractiveness by Physical Form, 2025-2035
  • Figure 40: Global Market Attractiveness by Application, 2025-2035
  • Figure 41: Global Market Attractiveness by End Use, 2025-2035
  • Figure 42: Global Market Attractiveness by Region, 2025-2035
  • Figure 43: North America Market Value (USD Million) by Type, 2025-2035
  • Figure 44: North America Market Value (USD Million) by Source, 2025-2035
  • Figure 45: North America Market Value (USD Million) by Delivery System, 2025-2035
  • Figure 46: North America Market Value (USD Million) by Physical Form, 2025-2035
  • Figure 47: North America Market Value (USD Million) by Application, 2025-2035
  • Figure 48: North America Market Value (USD Million) by End Use, 2025-2035
  • Figure 49: North America Market Value (USD Million) by Country, 2025-2035
  • Figure 50: North America Market Value (USD Million) Analysis by Country, 2020-2035
  • Figure 51: North America Market Volume (Units) Analysis by Country, 2020-2035
  • Figure 52: North America Market Value Share (%) and BPS Analysis by Country, 2025-2035
  • Figure 53: North America Market Y-o-Y Growth (%) Projections by Country, 2025-2035
  • Figure 54: North America Market Value (USD Million) Analysis by Type, 2020-2035
  • Figure 55: North America Market Volume (Units) Analysis by Type, 2020-2035
  • Figure 56: North America Market Value Share (%) and BPS Analysis by Type, 2025-2035
  • Figure 57: North America Market Y-o-Y Growth (%) Projections by Type, 2025-2035
  • Figure 58: North America Market Value (USD Million) Analysis by Source, 2020-2035
  • Figure 59: North America Market Volume (Units) Analysis by Source, 2020-2035
  • Figure 60: North America Market Value Share (%) and BPS Analysis by Source, 2025-2035
  • Figure 61: North America Market Y-o-Y Growth (%) Projections by Source, 2025-2035
  • Figure 62: North America Market Value (USD Million) Analysis by Delivery System, 2020-2035
  • Figure 63: North America Market Volume (Units) Analysis by Delivery System, 2020-2035
  • Figure 64: North America Market Value Share (%) and BPS Analysis by Delivery System, 2025-2035
  • Figure 65: North America Market Y-o-Y Growth (%) Projections by Delivery System, 2025-2035
  • Figure 66: North America Market Value (USD Million) Analysis by Physical Form, 2020-2035
  • Figure 67: North America Market Volume (Units) Analysis by Physical Form, 2020-2035
  • Figure 68: North America Market Value Share (%) and BPS Analysis by Physical Form, 2025-2035
  • Figure 69: North America Market Y-o-Y Growth (%) Projections by Physical Form, 2025-2035
  • Figure 70: North America Market Value (USD Million) Analysis by Application, 2020-2035
  • Figure 71: North America Market Volume (Units) Analysis by Application, 2020-2035
  • Figure 72: North America Market Value Share (%) and BPS Analysis by Application, 2025-2035
  • Figure 73: North America Market Y-o-Y Growth (%) Projections by Application, 2025-2035
  • Figure 74: North America Market Value (USD Million) Analysis by End Use, 2020-2035
  • Figure 75: North America Market Volume (Units) Analysis by End Use, 2020-2035
  • Figure 76: North America Market Value Share (%) and BPS Analysis by End Use, 2025-2035
  • Figure 77: North America Market Y-o-Y Growth (%) Projections by End Use, 2025-2035
  • Figure 78: North America Market Attractiveness by Type, 2025-2035
  • Figure 79: North America Market Attractiveness by Source, 2025-2035
  • Figure 80: North America Market Attractiveness by Delivery System, 2025-2035
  • Figure 81: North America Market Attractiveness by Physical Form, 2025-2035
  • Figure 82: North America Market Attractiveness by Application, 2025-2035
  • Figure 83: North America Market Attractiveness by End Use, 2025-2035
  • Figure 84: North America Market Attractiveness by Country, 2025-2035
  • Figure 85: Latin America Market Value (USD Million) by Type, 2025-2035
  • Figure 86: Latin America Market Value (USD Million) by Source, 2025-2035
  • Figure 87: Latin America Market Value (USD Million) by Delivery System, 2025-2035
  • Figure 88: Latin America Market Value (USD Million) by Physical Form, 2025-2035
  • Figure 89: Latin America Market Value (USD Million) by Application, 2025-2035
  • Figure 90: Latin America Market Value (USD Million) by End Use, 2025-2035
  • Figure 91: Latin America Market Value (USD Million) by Country, 2025-2035
  • Figure 92: Latin America Market Value (USD Million) Analysis by Country, 2020-2035
  • Figure 93: Latin America Market Volume (Units) Analysis by Country, 2020-2035
  • Figure 94: Latin America Market Value Share (%) and BPS Analysis by Country, 2025-2035
  • Figure 95: Latin America Market Y-o-Y Growth (%) Projections by Country, 2025-2035
  • Figure 96: Latin America Market Value (USD Million) Analysis by Type, 2020-2035
  • Figure 97: Latin America Market Volume (Units) Analysis by Type, 2020-2035
  • Figure 98: Latin America Market Value Share (%) and BPS Analysis by Type, 2025-2035
  • Figure 99: Latin America Market Y-o-Y Growth (%) Projections by Type, 2025-2035
  • Figure 100: Latin America Market Value (USD Million) Analysis by Source, 2020-2035
  • Figure 101: Latin America Market Volume (Units) Analysis by Source, 2020-2035
  • Figure 102: Latin America Market Value Share (%) and BPS Analysis by Source, 2025-2035
  • Figure 103: Latin America Market Y-o-Y Growth (%) Projections by Source, 2025-2035
  • Figure 104: Latin America Market Value (USD Million) Analysis by Delivery System, 2020-2035
  • Figure 105: Latin America Market Volume (Units) Analysis by Delivery System, 2020-2035
  • Figure 106: Latin America Market Value Share (%) and BPS Analysis by Delivery System, 2025-2035
  • Figure 107: Latin America Market Y-o-Y Growth (%) Projections by Delivery System, 2025-2035
  • Figure 108: Latin America Market Value (USD Million) Analysis by Physical Form, 2020-2035
  • Figure 109: Latin America Market Volume (Units) Analysis by Physical Form, 2020-2035
  • Figure 110: Latin America Market Value Share (%) and BPS Analysis by Physical Form, 2025-2035
  • Figure 111: Latin America Market Y-o-Y Growth (%) Projections by Physical Form, 2025-2035
  • Figure 112: Latin America Market Value (USD Million) Analysis by Application, 2020-2035
  • Figure 113: Latin America Market Volume (Units) Analysis by Application, 2020-2035
  • Figure 114: Latin America Market Value Share (%) and BPS Analysis by Application, 2025-2035
  • Figure 115: Latin America Market Y-o-Y Growth (%) Projections by Application, 2025-2035
  • Figure 116: Latin America Market Value (USD Million) Analysis by End Use, 2020-2035
  • Figure 117: Latin America Market Volume (Units) Analysis by End Use, 2020-2035
  • Figure 118: Latin America Market Value Share (%) and BPS Analysis by End Use, 2025-2035
  • Figure 119: Latin America Market Y-o-Y Growth (%) Projections by End Use, 2025-2035
  • Figure 120: Latin America Market Attractiveness by Type, 2025-2035
  • Figure 121: Latin America Market Attractiveness by Source, 2025-2035
  • Figure 122: Latin America Market Attractiveness by Delivery System, 2025-2035
  • Figure 123: Latin America Market Attractiveness by Physical Form, 2025-2035
  • Figure 124: Latin America Market Attractiveness by Application, 2025-2035
  • Figure 125: Latin America Market Attractiveness by End Use, 2025-2035
  • Figure 126: Latin America Market Attractiveness by Country, 2025-2035
  • Figure 127: Europe Market Value (USD Million) by Type, 2025-2035
  • Figure 128: Europe Market Value (USD Million) by Source, 2025-2035
  • Figure 129: Europe Market Value (USD Million) by Delivery System, 2025-2035
  • Figure 130: Europe Market Value (USD Million) by Physical Form, 2025-2035
  • Figure 131: Europe Market Value (USD Million) by Application, 2025-2035
  • Figure 132: Europe Market Value (USD Million) by End Use, 2025-2035
  • Figure 133: Europe Market Value (USD Million) by Country, 2025-2035
  • Figure 134: Europe Market Value (USD Million) Analysis by Country, 2020-2035
  • Figure 135: Europe Market Volume (Units) Analysis by Country, 2020-2035
  • Figure 136: Europe Market Value Share (%) and BPS Analysis by Country, 2025-2035
  • Figure 137: Europe Market Y-o-Y Growth (%) Projections by Country, 2025-2035
  • Figure 138: Europe Market Value (USD Million) Analysis by Type, 2020-2035
  • Figure 139: Europe Market Volume (Units) Analysis by Type, 2020-2035
  • Figure 140: Europe Market Value Share (%) and BPS Analysis by Type, 2025-2035
  • Figure 141: Europe Market Y-o-Y Growth (%) Projections by Type, 2025-2035
  • Figure 142: Europe Market Value (USD Million) Analysis by Source, 2020-2035
  • Figure 143: Europe Market Volume (Units) Analysis by Source, 2020-2035
  • Figure 144: Europe Market Value Share (%) and BPS Analysis by Source, 2025-2035
  • Figure 145: Europe Market Y-o-Y Growth (%) Projections by Source, 2025-2035
  • Figure 146: Europe Market Value (USD Million) Analysis by Delivery System, 2020-2035
  • Figure 147: Europe Market Volume (Units) Analysis by Delivery System, 2020-2035
  • Figure 148: Europe Market Value Share (%) and BPS Analysis by Delivery System, 2025-2035
  • Figure 149: Europe Market Y-o-Y Growth (%) Projections by Delivery System, 2025-2035
  • Figure 150: Europe Market Value (USD Million) Analysis by Physical Form, 2020-2035
  • Figure 151: Europe Market Volume (Units) Analysis by Physical Form, 2020-2035
  • Figure 152: Europe Market Value Share (%) and BPS Analysis by Physical Form, 2025-2035
  • Figure 153: Europe Market Y-o-Y Growth (%) Projections by Physical Form, 2025-2035
  • Figure 154: Europe Market Value (USD Million) Analysis by Application, 2020-2035
  • Figure 155: Europe Market Volume (Units) Analysis by Application, 2020-2035
  • Figure 156: Europe Market Value Share (%) and BPS Analysis by Application, 2025-2035
  • Figure 157: Europe Market Y-o-Y Growth (%) Projections by Application, 2025-2035
  • Figure 158: Europe Market Value (USD Million) Analysis by End Use, 2020-2035
  • Figure 159: Europe Market Volume (Units) Analysis by End Use, 2020-2035
  • Figure 160: Europe Market Value Share (%) and BPS Analysis by End Use, 2025-2035
  • Figure 161: Europe Market Y-o-Y Growth (%) Projections by End Use, 2025-2035
  • Figure 162: Europe Market Attractiveness by Type, 2025-2035
  • Figure 163: Europe Market Attractiveness by Source, 2025-2035
  • Figure 164: Europe Market Attractiveness by Delivery System, 2025-2035
  • Figure 165: Europe Market Attractiveness by Physical Form, 2025-2035
  • Figure 166: Europe Market Attractiveness by Application, 2025-2035
  • Figure 167: Europe Market Attractiveness by End Use, 2025-2035
  • Figure 168: Europe Market Attractiveness by Country, 2025-2035
  • Figure 169: East Asia Market Value (USD Million) by Type, 2025-2035
  • Figure 170: East Asia Market Value (USD Million) by Source, 2025-2035
  • Figure 171: East Asia Market Value (USD Million) by Delivery System, 2025-2035
  • Figure 172: East Asia Market Value (USD Million) by Physical Form, 2025-2035
  • Figure 173: East Asia Market Value (USD Million) by Application, 2025-2035
  • Figure 174: East Asia Market Value (USD Million) by End Use, 2025-2035
  • Figure 175: East Asia Market Value (USD Million) by Country, 2025-2035
  • Figure 176: East Asia Market Value (USD Million) Analysis by Country, 2020-2035
  • Figure 177: East Asia Market Volume (Units) Analysis by Country, 2020-2035
  • Figure 178: East Asia Market Value Share (%) and BPS Analysis by Country, 2025-2035
  • Figure 179: East Asia Market Y-o-Y Growth (%) Projections by Country, 2025-2035
  • Figure 180: East Asia Market Value (USD Million) Analysis by Type, 2020-2035
  • Figure 181: East Asia Market Volume (Units) Analysis by Type, 2020-2035
  • Figure 182: East Asia Market Value Share (%) and BPS Analysis by Type, 2025-2035
  • Figure 183: East Asia Market Y-o-Y Growth (%) Projections by Type, 2025-2035
  • Figure 184: East Asia Market Value (USD Million) Analysis by Source, 2020-2035
  • Figure 185: East Asia Market Volume (Units) Analysis by Source, 2020-2035
  • Figure 186: East Asia Market Value Share (%) and BPS Analysis by Source, 2025-2035
  • Figure 187: East Asia Market Y-o-Y Growth (%) Projections by Source, 2025-2035
  • Figure 188: East Asia Market Value (USD Million) Analysis by Delivery System, 2020-2035
  • Figure 189: East Asia Market Volume (Units) Analysis by Delivery System, 2020-2035
  • Figure 190: East Asia Market Value Share (%) and BPS Analysis by Delivery System, 2025-2035
  • Figure 191: East Asia Market Y-o-Y Growth (%) Projections by Delivery System, 2025-2035
  • Figure 192: East Asia Market Value (USD Million) Analysis by Physical Form, 2020-2035
  • Figure 193: East Asia Market Volume (Units) Analysis by Physical Form, 2020-2035
  • Figure 194: East Asia Market Value Share (%) and BPS Analysis by Physical Form, 2025-2035
  • Figure 195: East Asia Market Y-o-Y Growth (%) Projections by Physical Form, 2025-2035
  • Figure 196: East Asia Market Value (USD Million) Analysis by Application, 2020-2035
  • Figure 197: East Asia Market Volume (Units) Analysis by Application, 2020-2035
  • Figure 198: East Asia Market Value Share (%) and BPS Analysis by Application, 2025-2035
  • Figure 199: East Asia Market Y-o-Y Growth (%) Projections by Application, 2025-2035
  • Figure 200: East Asia Market Value (USD Million) Analysis by End Use, 2020-2035
  • Figure 201: East Asia Market Volume (Units) Analysis by End Use, 2020-2035
  • Figure 202: East Asia Market Value Share (%) and BPS Analysis by End Use, 2025-2035
  • Figure 203: East Asia Market Y-o-Y Growth (%) Projections by End Use, 2025-2035
  • Figure 204: East Asia Market Attractiveness by Type, 2025-2035
  • Figure 205: East Asia Market Attractiveness by Source, 2025-2035
  • Figure 206: East Asia Market Attractiveness by Delivery System, 2025-2035
  • Figure 207: East Asia Market Attractiveness by Physical Form, 2025-2035
  • Figure 208: East Asia Market Attractiveness by Application, 2025-2035
  • Figure 209: East Asia Market Attractiveness by End Use, 2025-2035
  • Figure 210: East Asia Market Attractiveness by Country, 2025-2035
  • Figure 211: South Asia & Pacific Market Value (USD Million) by Type, 2025-2035
  • Figure 212: South Asia & Pacific Market Value (USD Million) by Source, 2025-2035
  • Figure 213: South Asia & Pacific Market Value (USD Million) by Delivery System, 2025-2035
  • Figure 214: South Asia & Pacific Market Value (USD Million) by Physical Form, 2025-2035
  • Figure 215: South Asia & Pacific Market Value (USD Million) by Application, 2025-2035
  • Figure 216: South Asia & Pacific Market Value (USD Million) by End Use, 2025-2035
  • Figure 217: South Asia & Pacific Market Value (USD Million) by Country, 2025-2035
  • Figure 218: South Asia & Pacific Market Value (USD Million) Analysis by Country, 2020-2035
  • Figure 219: South Asia & Pacific Market Volume (Units) Analysis by Country, 2020-2035
  • Figure 220: South Asia & Pacific Market Value Share (%) and BPS Analysis by Country, 2025-2035
  • Figure 221: South Asia & Pacific Market Y-o-Y Growth (%) Projections by Country, 2025-2035
  • Figure 222: South Asia & Pacific Market Value (USD Million) Analysis by Type, 2020-2035
  • Figure 223: South Asia & Pacific Market Volume (Units) Analysis by Type, 2020-2035
  • Figure 224: South Asia & Pacific Market Value Share (%) and BPS Analysis by Type, 2025-2035
  • Figure 225: South Asia & Pacific Market Y-o-Y Growth (%) Projections by Type, 2025-2035
  • Figure 226: South Asia & Pacific Market Value (USD Million) Analysis by Source, 2020-2035
  • Figure 227: South Asia & Pacific Market Volume (Units) Analysis by Source, 2020-2035
  • Figure 228: South Asia & Pacific Market Value Share (%) and BPS Analysis by Source, 2025-2035
  • Figure 229: South Asia & Pacific Market Y-o-Y Growth (%) Projections by Source, 2025-2035
  • Figure 230: South Asia & Pacific Market Value (USD Million) Analysis by Delivery System, 2020-2035
  • Figure 231: South Asia & Pacific Market Volume (Units) Analysis by Delivery System, 2020-2035
  • Figure 232: South Asia & Pacific Market Value Share (%) and BPS Analysis by Delivery System, 2025-2035
  • Figure 233: South Asia & Pacific Market Y-o-Y Growth (%) Projections by Delivery System, 2025-2035
  • Figure 234: South Asia & Pacific Market Value (USD Million) Analysis by Physical Form, 2020-2035
  • Figure 235: South Asia & Pacific Market Volume (Units) Analysis by Physical Form, 2020-2035
  • Figure 236: South Asia & Pacific Market Value Share (%) and BPS Analysis by Physical Form, 2025-2035
  • Figure 237: South Asia & Pacific Market Y-o-Y Growth (%) Projections by Physical Form, 2025-2035
  • Figure 238: South Asia & Pacific Market Value (USD Million) Analysis by Application, 2020-2035
  • Figure 239: South Asia & Pacific Market Volume (Units) Analysis by Application, 2020-2035
  • Figure 240: South Asia & Pacific Market Value Share (%) and BPS Analysis by Application, 2025-2035
  • Figure 241: South Asia & Pacific Market Y-o-Y Growth (%) Projections by Application, 2025-2035
  • Figure 242: South Asia & Pacific Market Value (USD Million) Analysis by End Use, 2020-2035
  • Figure 243: South Asia & Pacific Market Volume (Units) Analysis by End Use, 2020-2035
  • Figure 244: South Asia & Pacific Market Value Share (%) and BPS Analysis by End Use, 2025-2035
  • Figure 245: South Asia & Pacific Market Y-o-Y Growth (%) Projections by End Use, 2025-2035
  • Figure 246: South Asia & Pacific Market Attractiveness by Type, 2025-2035
  • Figure 247: South Asia & Pacific Market Attractiveness by Source, 2025-2035
  • Figure 248: South Asia & Pacific Market Attractiveness by Delivery System, 2025-2035
  • Figure 249: South Asia & Pacific Market Attractiveness by Physical Form, 2025-2035
  • Figure 250: South Asia & Pacific Market Attractiveness by Application, 2025-2035
  • Figure 251: South Asia & Pacific Market Attractiveness by End Use, 2025-2035
  • Figure 252: South Asia & Pacific Market Attractiveness by Country, 2025-2035
  • Figure 253: Middle East and Africa Market Value (USD Million) by Type, 2025-2035
  • Figure 254: Middle East and Africa Market Value (USD Million) by Source, 2025-2035
  • Figure 255: Middle East and Africa Market Value (USD Million) by Delivery System, 2025-2035
  • Figure 256: Middle East and Africa Market Value (USD Million) by Physical Form, 2025-2035
  • Figure 257: Middle East and Africa Market Value (USD Million) by Application, 2025-2035
  • Figure 258: Middle East and Africa Market Value (USD Million) by End Use, 2025-2035
  • Figure 259: Middle East and Africa Market Value (USD Million) by Country, 2025-2035
  • Figure 260: Middle East and Africa Market Value (USD Million) Analysis by Country, 2020-2035
  • Figure 261: Middle East and Africa Market Volume (Units) Analysis by Country, 2020-2035
  • Figure 262: Middle East and Africa Market Value Share (%) and BPS Analysis by Country, 2025-2035
  • Figure 263: Middle East and Africa Market Y-o-Y Growth (%) Projections by Country, 2025-2035
  • Figure 264: Middle East and Africa Market Value (USD Million) Analysis by Type, 2020-2035
  • Figure 265: Middle East and Africa Market Volume (Units) Analysis by Type, 2020-2035
  • Figure 266: Middle East and Africa Market Value Share (%) and BPS Analysis by Type, 2025-2035
  • Figure 267: Middle East and Africa Market Y-o-Y Growth (%) Projections by Type, 2025-2035
  • Figure 268: Middle East and Africa Market Value (USD Million) Analysis by Source, 2020-2035
  • Figure 269: Middle East and Africa Market Volume (Units) Analysis by Source, 2020-2035
  • Figure 270: Middle East and Africa Market Value Share (%) and BPS Analysis by Source, 2025-2035
  • Figure 271: Middle East and Africa Market Y-o-Y Growth (%) Projections by Source, 2025-2035
  • Figure 272: Middle East and Africa Market Value (USD Million) Analysis by Delivery System, 2020-2035
  • Figure 273: Middle East and Africa Market Volume (Units) Analysis by Delivery System, 2020-2035
  • Figure 274: Middle East and Africa Market Value Share (%) and BPS Analysis by Delivery System, 2025-2035
  • Figure 275: Middle East and Africa Market Y-o-Y Growth (%) Projections by Delivery System, 2025-2035
  • Figure 276: Middle East and Africa Market Value (USD Million) Analysis by Physical Form, 2020-2035
  • Figure 277: Middle East and Africa Market Volume (Units) Analysis by Physical Form, 2020-2035
  • Figure 278: Middle East and Africa Market Value Share (%) and BPS Analysis by Physical Form, 2025-2035
  • Figure 279: Middle East and Africa Market Y-o-Y Growth (%) Projections by Physical Form, 2025-2035
  • Figure 280: Middle East and Africa Market Value (USD Million) Analysis by Application, 2020-2035
  • Figure 281: Middle East and Africa Market Volume (Units) Analysis by Application, 2020-2035
  • Figure 282: Middle East and Africa Market Value Share (%) and BPS Analysis by Application, 2025-2035
  • Figure 283: Middle East and Africa Market Y-o-Y Growth (%) Projections by Application, 2025-2035
  • Figure 284: Middle East and Africa Market Value (USD Million) Analysis by End Use, 2020-2035
  • Figure 285: Middle East and Africa Market Volume (Units) Analysis by End Use, 2020-2035
  • Figure 286: Middle East and Africa Market Value Share (%) and BPS Analysis by End Use, 2025-2035
  • Figure 287: Middle East and Africa Market Y-o-Y Growth (%) Projections by End Use, 2025-2035
  • Figure 288: Middle East and Africa Market Attractiveness by Type, 2025-2035
  • Figure 289: Middle East and Africa Market Attractiveness by Source, 2025-2035
  • Figure 290: Middle East and Africa Market Attractiveness by Delivery System, 2025-2035
  • Figure 291: Middle East and Africa Market Attractiveness by Physical Form, 2025-2035
  • Figure 292: Middle East and Africa Market Attractiveness by Application, 2025-2035
  • Figure 293: Middle East and Africa Market Attractiveness by End Use, 2025-2035
  • Figure 294: Middle East and Africa Market Attractiveness by Country, 2025-2035

Frequently Asked Questions

How big is the Exfoliants Peeling Agents Market in 2025?

The global Exfoliants Peeling Agents Market is estimated to be valued at USD 3,307.9 million in 2025.

What will be the size of the Exfoliants Peeling Agents Market in 2035?

The market size for the Exfoliants Peeling Agents Market is projected to reach USD 7,006.3 million by 2035.

How much will be the Exfoliants Peeling Agents Market growth between 2025 and 2035?

The Exfoliants Peeling Agents Market is expected to grow at a CAGR of 7.8% between 2025 and 2035.

What are the key product types in the Exfoliants Peeling Agents Market?

The key product types in the Exfoliants Peeling Agents Market are Alpha Hydroxy Acids (AHAs), Beta Hydroxy Acids (BHAs), Poly Hydroxy Acids (PHAs), enzyme-based exfoliants, and physical scrubbing agents.

Which segment is expected to contribute significant share in the Exfoliants Peeling Agents Market in 2025?

In terms of type, Alpha Hydroxy Acids (AHAs) are expected to hold a 40.3% share, while synthetic sources dominate with 59.7% share in the Exfoliants Peeling Agents Market in 2025.

Explore Similar Insights

Future Market Insights

Exfoliants Peeling Agents Market

Chat With

MaRIA

Hi There, I am MaRIA, Your Market Research Intelligence Assistant. How may I help you?