The fresh fish gutting machine market is expected to grow from USD 1,097.0 million in 2025 to USD 2,368.4 million by 2035, reflecting a CAGR of 8.0%. The initial period, 2025 to 2028, shows acceleration as seafood processing facilities adopt automated gutting machines to improve efficiency, maintain hygiene standards, and reduce labor costs. High demand from large-scale fisheries and modern processing plants drives rapid uptake, particularly in regions with significant seafood consumption. Early adoption of machines with higher processing speeds and reliability supports the market’s initial momentum.
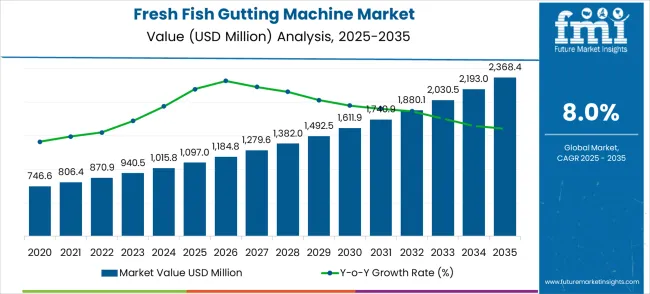
Between 2028 and 2032, growth decelerates as adoption in mature markets reaches a plateau, with incremental gains coming from replacements and minor technological improvements. From 2032 to 2035, the market experiences renewed acceleration due to innovations such as integrated cleaning systems, enhanced waste management, and faster processing capabilities. Expansion in emerging regions including Asia Pacific, Latin America, and Africa, driven by modernization of fisheries and rising seafood demand, further strengthens growth. This pattern of alternating acceleration and deceleration demonstrates a market influenced by technological upgrades, regional adoption trends, and operational efficiency requirements, offering clear guidance for manufacturers on investment and product development strategies.
The fish gutting machine market is segmented into industrial seafood processing plants (39%), mid-scale fisheries (26%), aquaculture facilities (18%), retail-level processing units (10%), and specialized applications including research and custom seafood preparation (7%). Industrial processing plants dominate adoption as automated gutting machines enable high-volume throughput, hygiene compliance, and reduced labor costs. Mid-scale fisheries use them for efficiency in regional markets, while aquaculture facilities deploy these machines to process farmed fish with consistent quality. Retail processing units integrate compact models for on-site preparation, and specialized uses include equipment for handling delicate or exotic fish species.
Key trends include advancements in precision cutting technologies, stainless steel hygienic designs, and modular automation systems that enhance operational reliability. Manufacturers are developing compact, energy-efficient machines with programmable settings for flexibility across fish sizes and species. Integration with conveyor systems, smart sensors, and AI-driven quality checks is expanding adoption. Partnerships between seafood processors and machine developers are fostering customized solutions. Rising focus on hygiene, labor efficiency, and international food safety standards continues to shape global market expansion.
| Metric | Value |
|---|---|
| Market Value (2025) | USD 1,097.0 million |
| Market Forecast Value (2035) | USD 2,368.4 million |
| Market Forecast CAGR | 8.0% |
Market expansion is being supported by the rapid increase in global seafood consumption worldwide and the corresponding need for efficient fish processing equipment that provides superior gutting accuracy and operational throughput. Modern seafood processing facilities rely on consistent processing quality and automated systems to ensure optimal production efficiency including commercial fisheries, aquaculture operations, and food processing plants. Even minor processing inefficiencies can require comprehensive quality control adjustments to maintain optimal food safety standards and operational performance.
The growing complexity of seafood processing requirements and increasing demand for high-speed automated gutting solutions are driving demand for advanced machinery from certified manufacturers with appropriate food safety capabilities and technical expertise. Seafood processing companies are increasingly requiring documented processing efficiency and equipment reliability to maintain product quality and regulatory compliance. Industry specifications and food safety standards are establishing standardized fish processing procedures that require specialized automation technologies and trained operators.
The shift toward seafood processing and waste reduction is further accelerating adoption of precise gutting machines that minimize product loss and optimize yield efficiency. Growing concerns about labor shortages in seafood processing industries are creating demand for automated solutions that can maintain consistent processing capacity regardless of workforce availability.
The market is segmented by automation type, application, and region. By automation type, the market is divided into fully automatic and semi-automatic systems. Based on application, the market is categorized into canned, seafood processing, frozen food, and others. Regionally, the market is divided into North America, Europe, East Asia, South Asia & Pacific, Latin America, and Middle East & Africa.
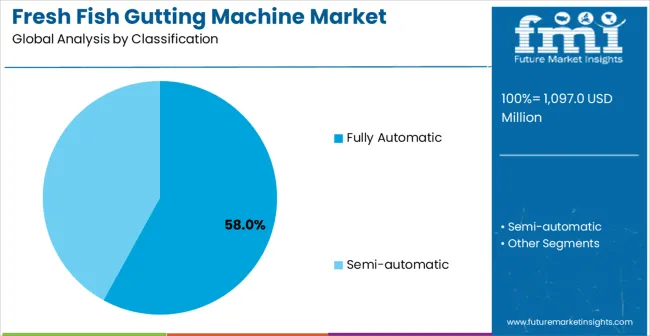
In 2025, the fully automatic fresh fish gutting machine segment is projected to capture around 58% of the total market share, making it the leading automation category. This dominance is largely driven by the widespread adoption of comprehensive automated systems that eliminate manual intervention and provide consistent processing results, catering to large-scale commercial applications. The fully automatic gutting machine is particularly favored for its ability to deliver high-speed processing with minimal operator involvement, ensuring operational efficiency and reduced labor costs.
Large seafood processing facilities, industrial fisheries, and commercial aquaculture operations increasingly prefer this automation level, as it meets high-volume processing requirements without imposing excessive operational complexity or training demands. The availability of well-established product lines, along with comprehensive software packages and technical support from leading manufacturers, further reinforces the segment's market position.
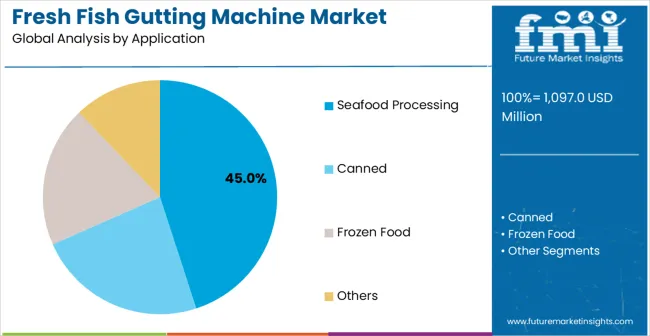
The seafood processing segment is expected to represent 45% of fresh fish gutting machine demand in 2025, highlighting its position as the most significant application sector. This dominance stems from the unique operational needs of dedicated seafood processing facilities, where high-volume fish gutting and consistent processing quality are critical to production efficiency. Seafood processing plants often feature continuous operation requirements throughout extended shifts, requiring robust and reliable gutting equipment. Automated gutting machines are particularly well-suited to these environments due to their ability to maintain consistent processing parameters and integrate with broader seafood processing lines.
As seafood processing industries expand globally and emphasize improved automation standards, the demand for sophisticated gutting machines continues to rise. The segment also benefits from increased competition within the seafood industry, where processors are increasingly prioritizing automation and efficiency as differentiators to improve productivity and reduce operational costs. With seafood processors investing in operational efficiency and food safety compliance, automated gutting machines provide an essential solution to maintain high-performance processing. The growth of industrial aquaculture operations, coupled with increased focus on processing automation, ensures that seafood processing will remain the largest and most stable demand driver for fish gutting machines in the forecast period.
The fresh fish gutting machine market is advancing rapidly due to increasing seafood consumption globally and growing recognition of automated processing advantages over manual gutting methods. The market faces challenges including higher initial equipment investment compared to manual operations, need for specialized maintenance expertise, and varying food safety regulations across different geographic regions. Automation advancement efforts and processing optimization programs continue to influence equipment development and market adoption patterns.
The growing development of advanced robotic systems and artificial intelligence capabilities is enabling higher precision gutting with improved fish recognition and adaptive processing characteristics. Enhanced robotic technologies and optimized AI algorithms provide superior processing accuracy while maintaining food safety compliance requirements. These technologies are particularly valuable for large-scale processors who require reliable equipment performance that can support extensive processing operations with minimal waste generation and consistent quality outcomes.
Modern fish gutting machine manufacturers are incorporating advanced hygiene systems and food safety features that enhance processing sanitation and regulatory compliance effectiveness. Integration of automated cleaning systems and contamination prevention enables superior food safety standards and comprehensive processing quality capabilities. Advanced hygiene features support operation in diverse processing environments while meeting various regulatory requirements and operational specifications, enabling seamless compliance with international food safety standards.
The Fresh Fish Gutting Machine market is entering a new phase of growth, driven by demand for automation, seafood consumption growth, and evolving food safety and processing efficiency standards. By 2035, these pathways together can unlock USD 300-400 million in incremental revenue opportunities beyond baseline growth.
Pathway A -- Full Automation Leadership (Advanced Robotic Systems) The fully automatic segment already holds the largest share due to its processing efficiency and labor cost advantages. Expanding AI integration, robotic precision, and adaptive processing can consolidate leadership. Opportunity pool: USD 80-110 million.
Pathway B -- Seafood Processing Expansion (Commercial Facilities) Seafood processing applications account for the majority of demand. Growing aquaculture operations, especially in emerging economies, will drive higher adoption of automated gutting systems for processing efficiency. Opportunity pool: USD 70-90 million.
Pathway C -- Aquaculture Industry Growth Commercial aquaculture operations and fish farming facilities are expanding rapidly, especially in coastal regions. Gutting machines tailored for aquaculture operations (high-capacity, species-specific, integrated systems) can capture significant growth. Opportunity pool: USD 50-70 million.
Pathway D -- Emerging Market Expansion Asia-Pacific, Latin America, and Africa present growing demand due to rising seafood consumption and processing infrastructure development. Targeting distribution networks and cost-effective product lines will accelerate adoption. Opportunity pool: USD 40-55 million.
Pathway E -- Food Safety & Traceability Compliance With stricter food safety regulations and traceability requirements, there is an opportunity to promote advanced gutting systems with integrated monitoring and documentation capabilities. Opportunity pool: USD 25-35 million.
Pathway F -- Premium Processing Features Gutting machines with yield optimization, waste reduction, and multi-species handling offer premium positioning for large-scale processing facilities and industrial operations. Opportunity pool: USD 20-30 million.
Pathway G -- Service, Parts & Maintenance Value Recurring revenue from maintenance contracts, spare parts, and technical support services creates a long-term revenue stream for equipment manufacturers. Opportunity pool: USD 15-20 million.
Pathway H -- Digital Integration & Smart Processing IoT connectivity, remote monitoring, and predictive maintenance can elevate gutting machines into "smart processing" equipment while strengthening customer relationships and operational efficiency. Opportunity pool: USD 10-15 million.
| Country | CAGR (2025-2035) |
|---|---|
| China | 10.8% |
| India | 10.0% |
| Germany | 9.2% |
| Brazil | 8.4% |
| United States | 7.6% |
| United Kingdom | 6.8% |
| Japan | 6.0% |
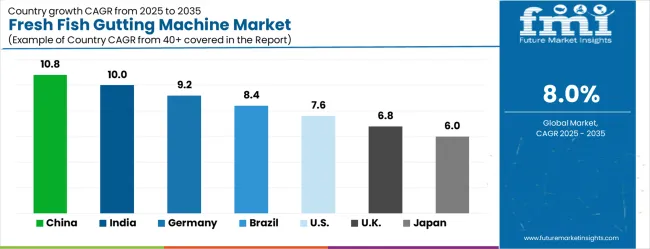
The fresh fish gutting machine market is growing rapidly, with China leading at a 10.8% CAGR through 2035, driven by massive aquaculture industry expansion and increasing adoption of automated fish processing systems. India follows at 10.0%, supported by rising seafood consumption and growing investment in modern fish processing infrastructure. Germany grows steadily at 9.2%, integrating advanced gutting technology into its established seafood processing industry. Brazil records 8.4%, emphasizing aquaculture development and processing facility modernization initiatives. The United States shows solid growth at 7.6%, focusing on automation advancement and operational efficiency in seafood processing. The United Kingdom demonstrates steady progress at 6.8%, maintaining established commercial fishing and processing applications. Japan records 6.0% growth, concentrating on precision technology development and processing quality optimization.
The report covers an in-depth analysis of 40+ countries, Top-performing countries are highlighted below.
China is expected to expand at a CAGR of 10.8% from 2025 to 2035, above the global market average, due to its leading aquaculture and seafood processing sectors. Automated gutting machines are increasingly adopted to improve efficiency, reduce labor dependence, and maintain hygiene standards in processing facilities. Manufacturers are focusing on high-capacity machines capable of handling multiple fish species while minimizing waste. Domestic companies such as Longrun Machinery and Jinan Tianbao are enhancing technology through automation and precision engineering. Integration with conveyors and sorting systems is improving operational efficiency and throughput. The market is further driven by rising seafood exports, government regulations for food safety, and investment in modern processing plants.
India is anticipated to grow at a CAGR of 10.0% from 2025 to 2035, driven by increasing seafood processing and aquaculture production. Automated gutting machines are being implemented to improve processing speed, hygiene, and yield in both small and large-scale facilities. Companies are developing machines suited for tropical conditions, high humidity, and diverse fish species. Local manufacturers such as Aquatic Automation Systems and Desai Marine are collaborating with international suppliers to improve capacity and technology. Adoption is further supported by growing seafood exports, modernization of processing units, and government initiatives to promote mechanization in aquaculture.
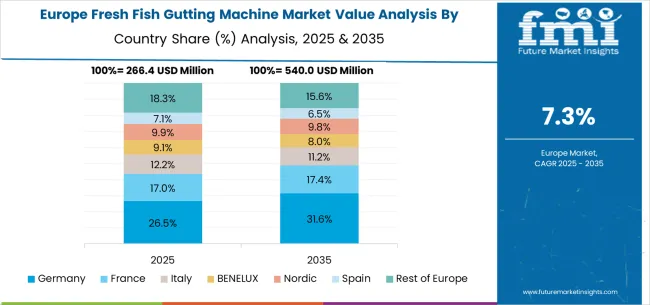
Germany is expected to grow at a CAGR of 9.2% from 2025 to 2035, influenced by the seafood processing industry and advanced manufacturing technologies. Automated gutting machines are used to improve efficiency, reduce labor requirements, and maintain consistent product quality. Companies focus on precision engineering, adjustable settings for different fish sizes, and hygienic, easy-to-clean designs. Leading suppliers such as Baader and Marel are offering modular systems that integrate gutting, cleaning, and sorting in a single workflow. Demand is also driven by the need for compliance with strict European food safety standards and increasing consumer expectations for high-quality seafood products.
Brazil is expected to grow at a CAGR of 8.4% from 2025 to 2035, driven by aquaculture expansion and seafood export growth. Automated gutting machines are being deployed to enhance productivity, reduce manual labor, and ensure compliance with international food safety standards. Manufacturers focus on machines that can withstand high humidity and tropical operating conditions while maintaining hygiene and efficiency. Companies such as Marel and TecnoPesca are collaborating with local operators to deliver advanced solutions suitable for both small and industrial-scale processing units. Investment in modern processing plants and government support for seafood exports are further boosting market adoption.
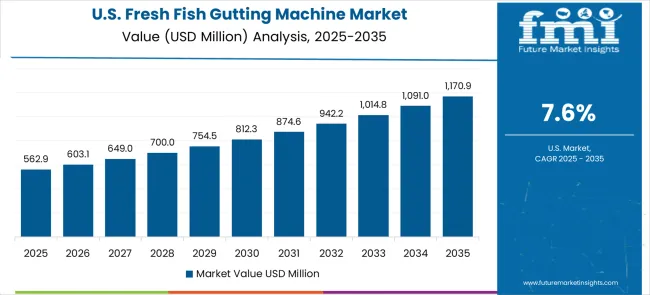
The United States is expected to grow at a CAGR of 7.6% from 2025 to 2035, supported by seafood processing facilities, aquaculture growth, and automation adoption. Automated gutting machines improve throughput, maintain hygiene, and reduce labor costs in both freshwater and marine processing units. Manufacturers focus on machines compatible with different fish species and sizes, with easy-clean designs and integrated sorting capabilities. Key players such as Baader and JBT Corporation are delivering solutions for industrial-scale operations and retrofitting existing facilities. Demand is fueled by seafood exports, regulatory compliance for food safety, and consumer expectations for consistent product quality.
The United Kingdom is expected to grow at a CAGR of 6.8% from 2025 to 2035, with adoption in commercial seafood processing and aquaculture operations. Automated gutting machines are used to increase efficiency, improve yield, and maintain hygiene standards. Systems are designed to accommodate different fish species and sizes, with modular and easy-to-clean configurations. Companies such as Marel and Baader are providing solutions that integrate gutting, cleaning, and grading into single automated workflows. Government regulations for food safety, consumer demand for high-quality seafood, and modernization of processing plants are supporting market growth.
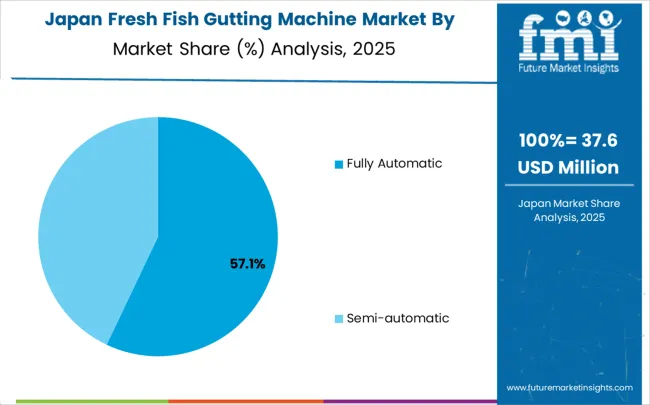
Japan is expected to grow at a CAGR of 6.0% from 2025 to 2035, influenced by seafood consumption, aquaculture expansion, and technology adoption in processing plants. Automated gutting machines improve speed, reduce labor requirements, and maintain hygiene and product quality. Manufacturers focus on machines capable of processing a variety of fish species, with compact, easy-to-clean designs suitable for high-density production facilities. Key players including JBT Corporation and Maruha Nichiro are supplying advanced solutions for both industrial and medium-scale processing units. Demand is supported by consumer expectations for high-quality seafood, regulatory compliance, and the modernization of traditional processing methods.
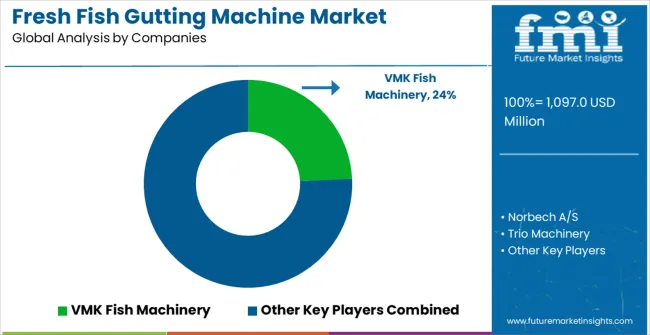
The Fresh Fish Gutting Machine market is defined by competition among specialized processing equipment manufacturers, automation technology companies, and seafood machinery solution providers. Companies are investing in advanced robotic system development, AI integration, food safety compliance improvements, and comprehensive service capabilities to deliver reliable, efficient, and hygienic processing solutions. Strategic partnerships, technological innovation, and market expansion are central to strengthening product portfolios and market presence.
VMK Fish Machinery offers comprehensive fish processing solutions with established manufacturing expertise and industrial-grade gutting system capabilities. Norbech A/S provides integrated seafood processing systems with focus on automation and operational efficiency. Trio Machinery delivers specialized gutting equipment with emphasis on precision and throughput optimization. Baader specializes in comprehensive fish processing lines with advanced automation integration.
NOCK Maschinenbau offers professional-grade processing systems with comprehensive technical support capabilities. Cabinplant delivers innovative processing solutions with advanced hygiene and food safety technologies. AGK Kronawitter provides cost-effective gutting systems with focus on reliability and ease of operation. Josmar, Varlet, Vélfag, and Marel offer specialized processing equipment with emphasis on technological advancement and operational excellence across global and regional market segments.
Chinese manufacturers including Zhan Jiang Hongwu Machinery, FUDE Food Machinery, Guangzhou XuZhong, Jiangxi Ganyun, and Nantong Powertech Machinery provide competitive processing solutions with focus on cost-effectiveness and regional market penetration.
| Item | Value |
|---|---|
| Quantitative Units | USD 1,097.0 million |
| Automation Type | Fully Automatic, Semi-automatic |
| Application | Canned, Seafood Processing, Frozen Food, Others |
| Regions Covered | North America, Europe, East Asia, South Asia & Pacific, Latin America, Middle East & Africa |
| Country Covered | China, India, Germany, Brazil, United States, United Kingdom, Japan, and 40+ countries |
| Key Companies Profiled | VMK Fish Machinery, Norbech A/S, Trio Machinery, Baader, NOCK Maschinenbau, Cabinplant, AGK Kronawitter, Josmar, Varlet, Vélfag, Marel, Zhan Jiang Hongwu Machinery, FUDE Food Machinery, Guangzhou XuZhong, Jiangxi Ganyun, Nantong Powertech Machinery |
| Additional Attributes | Dollar sales by automation type and application segment, regional demand trends across major markets, competitive landscape with established processing equipment manufacturers and emerging technology providers, customer preferences for different automation levels and processing capacities, integration with seafood processing systems and food safety protocols, innovations in robotic technology and AI-powered processing capabilities, and adoption of hygiene enhancement features with improved operational workflows for enhanced food safety compliance. |
The global fresh fish gutting machine market is estimated to be valued at USD 1,097.0 million in 2025.
The market size for the fresh fish gutting machine market is projected to reach USD 2,368.4 million by 2035.
The fresh fish gutting machine market is expected to grow at a 8.0% CAGR between 2025 and 2035.
The key product types in fresh fish gutting machine market are fully automatic and semi-automatic.
In terms of application, seafood processing segment to command 45.0% share in the fresh fish gutting machine market in 2025.


Our Research Products

The "Full Research Suite" delivers actionable market intel, deep dives on markets or technologies, so clients act faster, cut risk, and unlock growth.

The Leaderboard benchmarks and ranks top vendors, classifying them as Established Leaders, Leading Challengers, or Disruptors & Challengers.

Locates where complements amplify value and substitutes erode it, forecasting net impact by horizon

We deliver granular, decision-grade intel: market sizing, 5-year forecasts, pricing, adoption, usage, revenue, and operational KPIs—plus competitor tracking, regulation, and value chains—across 60 countries broadly.

Spot the shifts before they hit your P&L. We track inflection points, adoption curves, pricing moves, and ecosystem plays to show where demand is heading, why it is changing, and what to do next across high-growth markets and disruptive tech

Real-time reads of user behavior. We track shifting priorities, perceptions of today’s and next-gen services, and provider experience, then pace how fast tech moves from trial to adoption, blending buyer, consumer, and channel inputs with social signals (#WhySwitch, #UX).

Partner with our analyst team to build a custom report designed around your business priorities. From analysing market trends to assessing competitors or crafting bespoke datasets, we tailor insights to your needs.
Supplier Intelligence
Discovery & Profiling
Capacity & Footprint
Performance & Risk
Compliance & Governance
Commercial Readiness
Who Supplies Whom
Scorecards & Shortlists
Playbooks & Docs
Category Intelligence
Definition & Scope
Demand & Use Cases
Cost Drivers
Market Structure
Supply Chain Map
Trade & Policy
Operating Norms
Deliverables
Buyer Intelligence
Account Basics
Spend & Scope
Procurement Model
Vendor Requirements
Terms & Policies
Entry Strategy
Pain Points & Triggers
Outputs
Pricing Analysis
Benchmarks
Trends
Should-Cost
Indexation
Landed Cost
Commercial Terms
Deliverables
Brand Analysis
Positioning & Value Prop
Share & Presence
Customer Evidence
Go-to-Market
Digital & Reputation
Compliance & Trust
KPIs & Gaps
Outputs
Full Research Suite comprises of:
Market outlook & trends analysis
Interviews & case studies
Strategic recommendations
Vendor profiles & capabilities analysis
5-year forecasts
8 regions and 60+ country-level data splits
Market segment data splits
12 months of continuous data updates
DELIVERED AS:
PDF EXCEL ONLINE
Fresh Food Packaging Market Forecast and Outlook 2025 to 2035
Freshness Indicator Label Market Size and Share Forecast Outlook 2025 to 2035
Fresh Vegetables Market Size and Share Forecast Outlook 2025 to 2035
Fresh Fruits & Vegetables Market Size and Share Forecast Outlook 2025 to 2035
Fresh Figs Market Size and Share Forecast Outlook 2025 to 2035
Freshness Monitoring Packaging Market Size and Share Forecast Outlook 2025 to 2035
Fresh Produce Trays Market Analysis - Size, Trends & Forecast 2025 to 2035
Freshwater Microalgae Market Analysis by Strain type and End Use Application Through 2035
Fresh Organic Chicken Market
Freshwater Fish Market – Growth, Demand & Sustainable Practices
Air Freshener Market Analysis by Product Type, Application Type, Sales Channel, Fragrance Type, and Region from 2025 to 2035
Raw, fresh and frozen dog food Market Analysis - Size, Share & Forecast 2025 to 2035
Mouth Freshener Market Size, Growth, and Forecast for 2025 to 2035
Fabric Freshener Market Forecast and Outlook 2025 to 2035
Gel Air Fresheners Market Size and Share Forecast Outlook 2025 to 2035
Car Air Freshener Market Size and Share Forecast Outlook 2025 to 2035
Packaged Fresh Fruits Market Analysis by Berries, Citrus, Tropical Fruits, Stone Fruits, and Others Through 2035
Candle Air Fresheners Market Size and Share Forecast Outlook 2025 to 2035
Electric Air Freshener Market Analysis - Trends, Growth & Forecast 2025 to 2035
North America Fresh Meat Packaging Market Size and Share Forecast Outlook 2025 to 2035

Thank you!
You will receive an email from our Business Development Manager. Please be sure to check your SPAM/JUNK folder too.
Chat With
MaRIA