Hydrolysed Wheat Protein Market Size and Share Forecast Outlook 2025 to 2035

The Hydrolysed Wheat Protein Market is estimated to be valued at USD 301.0 billion in 2025 and is projected to reach USD 531.5 billion by 2035, registering a compound annual growth rate (CAGR) of 5.9% over the forecast period.
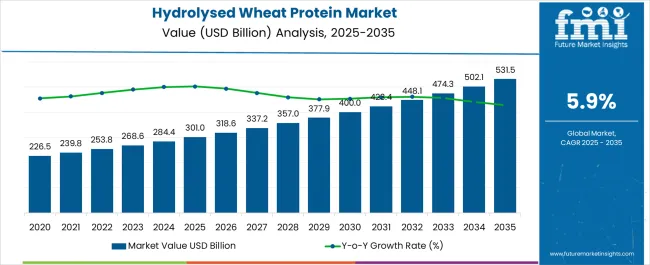
Quick Stats for Hydrolysed Wheat Protein Market

  • Hydrolysed Wheat Protein Market Value (2025): USD 301.0 billion
  • Hydrolysed Wheat Protein Market Forecast Value (2035): USD 531.5 billion
  • Hydrolysed Wheat Protein Market Forecast CAGR: 5.9%
  • Leading Segment in Hydrolysed Wheat Protein Market in 2025: Organic (55.0%)
  • Key Growth Regions in Hydrolysed Wheat Protein Market: North America, Asia-Pacific, Europe
  • Top Key Players in Hydrolysed Wheat Protein Market: Archer Daniels Midland Company, Cargill, Incorporated, Roquette Frères, MGP Ingredients, Inc., Kerry Group plc, Manildra Group, The Scoular Company, Tereos SCA

Hydrolysed Wheat Protein Market Market Value Analysis

Hydrolysed Wheat Protein Market Key Takeaways

Metric Value
Hydrolysed Wheat Protein Market Estimated Value in (2025 E) USD 301.0 billion
Hydrolysed Wheat Protein Market Forecast Value in (2035 F) USD 531.5 billion
Forecast CAGR (2025 to 2035) 5.9%

Why is the Hydrolysed Wheat Protein Market Growing?

The Hydrolysed Wheat Protein market is experiencing steady growth driven by increasing consumer demand for protein-enriched formulations across food, beverage, and personal care industries. The current market scenario is characterized by rising health consciousness and awareness of plant-based protein benefits, fueling the adoption of hydrolysed wheat protein in functional foods and nutraceuticals. The market is supported by advances in protein extraction and hydrolysis technologies, which improve solubility, digestibility, and bioavailability, making products more versatile for industrial applications.

Growing investments in bakery and confectionery sectors, where protein fortification enhances texture and nutritional content, further drive market expansion. Additionally, regulatory support for clean-label and organic formulations has encouraged manufacturers to incorporate naturally derived wheat proteins in their formulations.

The future outlook is expected to remain positive, as increasing research into protein-based solutions for sports nutrition, functional foods, and personal care continues to expand potential applications Rising consumer preference for organic and natural ingredients, coupled with the growing trend of protein-fortified products, is anticipated to further enhance market growth and create sustainable opportunities for manufacturers.

Segmental Analysis

The hydrolysed wheat protein market is segmented by nature, application, concentration, sales channel, form, and geographic regions. By nature, hydrolysed wheat protein market is divided into Organic and Conventional. In terms of application, hydrolysed wheat protein market is classified into Bakery, Confectionary, Nutritional Bars, Meat Analogues, Cosmetics, Pet Foods, Personal Care, Nutritional Beverages, and Others. Based on concentration, hydrolysed wheat protein market is segmented into 85% Concentrated, 75% Concentrated, and 95% Concentrated. By sales channel, hydrolysed wheat protein market is segmented into Direct Sales, Indirect Sales, Supermarket/Hypermarket, Online Stores, and Retail Stores. By form, hydrolysed wheat protein market is segmented into Powder Hydrolysed Wheat Protein and Liquid Hydrolysed Wheat Protein. Regionally, the hydrolysed wheat protein industry is classified into North America, Latin America, Western Europe, Eastern Europe, Balkan & Baltic Countries, Russia & Belarus, Central Asia, East Asia, South Asia & Pacific, and the Middle East & Africa.
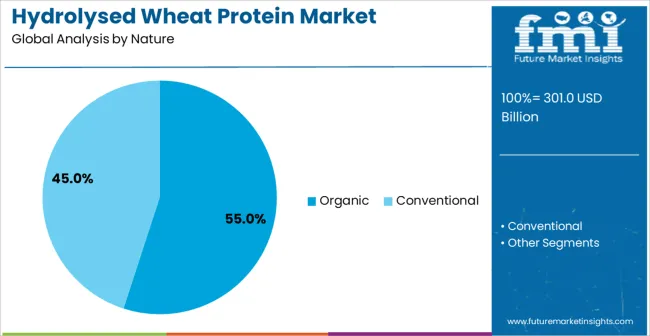
Insights into the Organic Segment

Hydrolysed Wheat Protein Market Analysis By Nature

The organic nature segment is projected to hold 55.0% of the Hydrolysed Wheat Protein market revenue share in 2025, establishing it as the leading nature type. This dominance is being attributed to increasing consumer preference for natural and clean-label ingredients, which are perceived as safer and healthier compared to synthetic alternatives. Adoption has been supported by rising awareness regarding organic certifications and their impact on product quality and sustainability.

Organic hydrolysed wheat protein offers enhanced nutritional benefits and reduced allergenicity, making it particularly attractive in food formulations targeting health-conscious consumers. The segment’s growth has been reinforced by expanding applications in bakery, beverages, and personal care products where organic labeling adds value and brand appeal.

Manufacturers have leveraged organic protein to differentiate their offerings in highly competitive markets, while demand from premium product categories has contributed to higher revenue capture Furthermore, the focus on environmentally sustainable production practices aligns with global consumer trends, which has cemented organic hydrolysed wheat protein as the preferred choice among nature-based protein solutions.
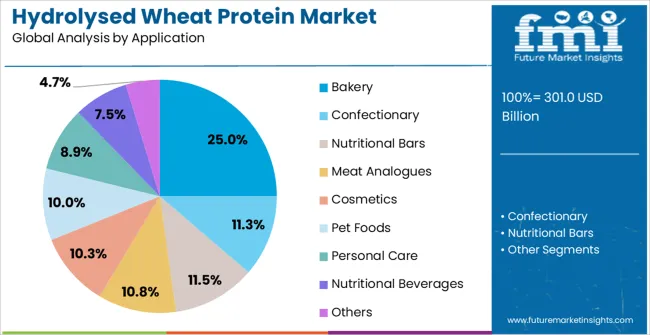
Insights into the Bakery Application Segment

Hydrolysed Wheat Protein Market Analysis By Application

The bakery application segment is expected to account for 25.0% of the Hydrolysed Wheat Protein market revenue share in 2025, emerging as the leading application segment. This growth is being driven by the functional benefits that hydrolysed wheat protein imparts to baked goods, including improved texture, dough strength, and moisture retention. Adoption has been reinforced by the demand for protein-enriched bakery products that cater to health-conscious consumers seeking nutritional enhancement without compromising sensory quality.

Manufacturers have increasingly incorporated hydrolysed wheat protein to extend shelf life and improve structural integrity, particularly in bread, pastries, and specialty baked items. The segment has benefited from rising urbanization and changing dietary habits, which have increased consumption of convenient, protein-fortified bakery products.

Furthermore, the scalability of hydrolysed wheat protein incorporation in industrial bakery production and the ability to meet organic and clean-label criteria have further strengthened its market position As consumer preference for functional and fortified foods continues to rise, the bakery application segment is anticipated to maintain its leadership and drive market growth.
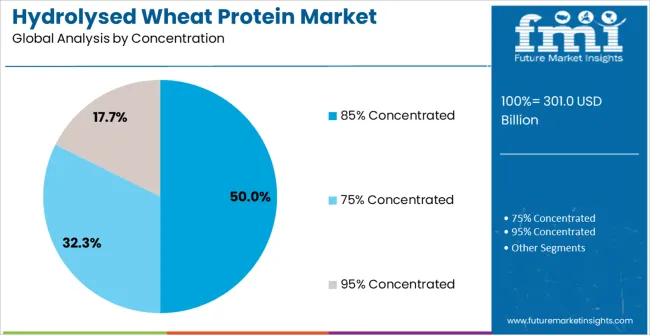
Insights into the 85% Concentrated Subsegment

Hydrolysed Wheat Protein Market Analysis By Concentration

The 85% concentrated hydrolysed wheat protein subsegment is projected to hold 50.0% of the market revenue share in 2025, making it the dominant concentration level. Its growth is being attributed to higher solubility, better nutritional density, and ease of incorporation in diverse formulations, which make it highly desirable for industrial and commercial applications. Adoption has been supported by manufacturers seeking consistent performance in bakery, beverage, and nutraceutical products, where concentrated protein solutions reduce the volume required while maintaining functional properties.

The segment benefits from strong demand in applications requiring rapid mixing, controlled viscosity, and improved texture without compromising protein content. Furthermore, the concentrated formulation allows for greater flexibility in dosage and standardization, which aligns with stringent quality control requirements in commercial food production.

The efficiency and adaptability offered by the 85% concentration have reinforced its preference among formulators, ensuring its leading position within the market Continued focus on functional and clean-label products is expected to sustain growth of this concentrated subsegment across global markets.

Market Overview

Hydrolysed Wheat Protein Market Outlook

Hydrolysed wheat protein is a product derived by the enzymatic hydrolysis of vital wheat gluten. Hydrolysed wheat protein is used in food products such as bakery products, chewy candies, non-dairy creams & nutrition rice flour and as a protein source for fermentation, milk powder replacement, meat products, emulsified sauces and beverages.

Moreover, hydrolysed wheat protein has been known as one of the most impacting pore minimisers in modern personal care products, such as toners, gels, serums, facial cleansers and lotions. It delivers balanced moisture and nourishes gently.

Some of the primary drivers of the hydrolysed wheat protein market include the growing demand for cruelty-free and vegetarian food ingredients, growing obesity issues and the growing incidence of lactose intolerance. These factors have helped increase the overall production and sales of hydrolysed wheat protein.
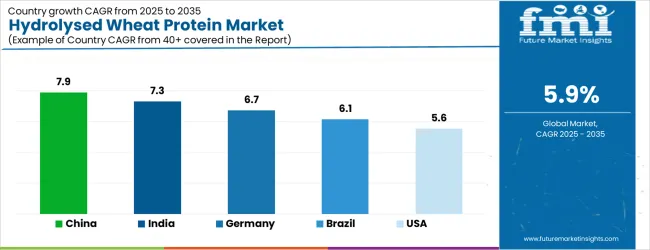
Analysis of Hydrolysed Wheat Protein Market By Key Countries

Hydrolysed Wheat Protein Market Cagr Analysis By Country

Country CAGR
China 7.9%
India 7.3%
Germany 6.7%
Brazil 6.1%
USA 5.6%
UK 5.0%
Japan 4.4%

Country-wise Analysis

The Hydrolysed Wheat Protein Market is expected to register a CAGR of 5.9% during the forecast period, exhibiting varied country level momentum. China leads with the highest CAGR of 7.9%, followed by India at 7.3%. Developed markets such as Germany, France, and the UK continue to expand steadily, while the USA is likely to grow at consistent rates. Japan posts the lowest CAGR at 4.4%, yet still underscores a broadly positive trajectory for the global Hydrolysed Wheat Protein Market. In 2024, Germany held a dominant revenue in the Western Europe market and is expected to grow with a CAGR of 6.7%. The USA Hydrolysed Wheat Protein Market is estimated to be valued at USD 109.5 billion in 2025 and is anticipated to reach a valuation of USD 109.5 billion by 2035. Sales are projected to rise at a CAGR of 0.0% over the forecast period between 2025 and 2035. While Japan and South Korea markets are estimated to be valued at USD 14.9 billion and USD 8.6 billion respectively in 2025.
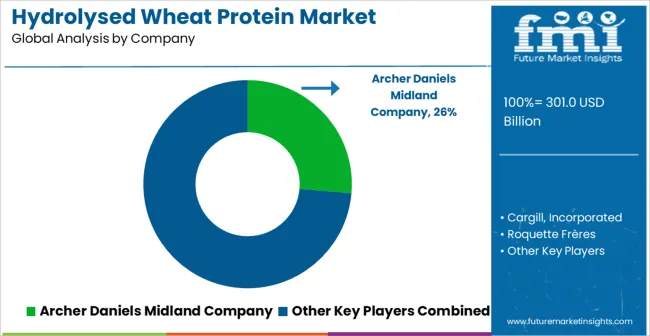
Key Players in the Hydrolysed Wheat Protein Market

Hydrolysed Wheat Protein Market Analysis By Company

  • Archer Daniels Midland Company
  • Cargill, Incorporated
  • Roquette Frères
  • MGP Ingredients, Inc.
  • Kerry Group plc
  • Manildra Group
  • The Scoular Company
  • Tereos SCA

Scope of the Report

Item Value
Quantitative Units USD 301.0 Billion
Nature Organic and Conventional
Application Bakery, Confectionary, Nutritional Bars, Meat Analogues, Cosmetics, Pet Foods, Personal Care, Nutritional Beverages, and Others
Concentration 85% Concentrated, 75% Concentrated, and 95% Concentrated
Sales Channel Direct Sales, Indirect Sales, Supermarket/Hypermarket, Online Stores, and Retail Stores
Form Powder Hydrolysed Wheat Protein and Liquid Hydrolysed Wheat Protein
Regions Covered North America, Europe, Asia-Pacific, Latin America, Middle East & Africa
Country Covered United States, Canada, Germany, France, United Kingdom, China, Japan, India, Brazil, South Africa
Key Companies Profiled Archer Daniels Midland Company, Cargill, Incorporated, Roquette Frères, MGP Ingredients, Inc., Kerry Group plc, Manildra Group, The Scoular Company, and Tereos SCA

Hydrolysed Wheat Protein Market by Segments

Nature:

  • Organic
  • Conventional

Application:

  • Bakery
  • Confectionary
  • Nutritional Bars
  • Meat Analogues
  • Cosmetics
  • Pet Foods
  • Personal Care
  • Nutritional Beverages
  • Others

Concentration:

  • 85% Concentrated
  • 75% Concentrated
  • 95% Concentrated

Sales Channel:

  • Direct Sales
  • Indirect Sales
  • Supermarket/Hypermarket
  • Online Stores
  • Retail Stores

Form:

  • Powder Hydrolysed Wheat Protein
  • Liquid Hydrolysed Wheat Protein

Region:

  • North America
    • USA
    • Canada
    • Mexico
  • Latin America
    • Brazil
    • Chile
    • Rest of Latin America
  • Western Europe
    • Germany
    • UK
    • Italy
    • Spain
    • France
    • Nordic
    • BENELUX
    • Rest of Western Europe
  • Eastern Europe
    • Russia
    • Poland
    • Hungary
    • Balkan & Baltic
    • Rest of Eastern Europe
  • East Asia
    • China
    • Japan
    • South Korea
  • South Asia and Pacific
    • India
    • ASEAN
    • Australia & New Zealand
    • Rest of South Asia and Pacific
  • Middle East & Africa
    • Kingdom of Saudi Arabia
    • Other GCC Countries
    • Turkiye
    • South Africa
    • Other African Union
    • Rest of Middle East & Africa

Frequently Asked Questions

How big is the hydrolysed wheat protein market in 2025?

The global hydrolysed wheat protein market is estimated to be valued at USD 301.0 billion in 2025.

What will be the size of hydrolysed wheat protein market in 2035?

The market size for the hydrolysed wheat protein market is projected to reach USD 531.5 billion by 2035.

How much will be the hydrolysed wheat protein market growth between 2025 and 2035?

The hydrolysed wheat protein market is expected to grow at a 5.9% CAGR between 2025 and 2035.

What are the key product types in the hydrolysed wheat protein market?

The key product types in hydrolysed wheat protein market are organic and conventional.

Which application segment to contribute significant share in the hydrolysed wheat protein market in 2025?

In terms of application, bakery segment to command 25.0% share in the hydrolysed wheat protein market in 2025.

Table of Content

  1. Executive Summary
    • Global Market Outlook
    • Demand-side Trends
    • Supply-side Trends
    • Technology Roadmap Analysis
    • Analysis and Recommendations
  2. Market Overview
    • Market Coverage / Taxonomy
    • Market Definition / Scope / Limitations
  3. Market Background
    • Market Dynamics
      • Drivers
      • Restraints
      • Opportunity
      • Trends
    • Scenario Forecast
      • Demand in Optimistic Scenario
      • Demand in Likely Scenario
      • Demand in Conservative Scenario
    • Opportunity Map Analysis
    • Product Life Cycle Analysis
    • Supply Chain Analysis
    • Investment Feasibility Matrix
    • Value Chain Analysis
    • PESTLE and Porter’s Analysis
    • Regulatory Landscape
    • Regional Parent Market Outlook
    • Production and Consumption Statistics
    • Import and Export Statistics
  4. Global Market Analysis 2020 to 2024 and Forecast, 2025 to 2035
    • Historical Market Size Value (USD Million) Analysis, 2020 to 2024
    • Current and Future Market Size Value (USD Million) Projections, 2025 to 2035
      • Y-o-Y Growth Trend Analysis
      • Absolute $ Opportunity Analysis
  5. Global Market Pricing Analysis 2020 to 2024 and Forecast 2025 to 2035
  6. Global Market Analysis 2020 to 2024 and Forecast 2025 to 2035, By Nature
    • Introduction / Key Findings
    • Historical Market Size Value (USD Million) Analysis By Nature , 2020 to 2024
    • Current and Future Market Size Value (USD Million) Analysis and Forecast By Nature , 2025 to 2035
      • Organic
      • Conventional
    • Y-o-Y Growth Trend Analysis By Nature , 2020 to 2024
    • Absolute $ Opportunity Analysis By Nature , 2025 to 2035
  7. Global Market Analysis 2020 to 2024 and Forecast 2025 to 2035, By Application
    • Introduction / Key Findings
    • Historical Market Size Value (USD Million) Analysis By Application, 2020 to 2024
    • Current and Future Market Size Value (USD Million) Analysis and Forecast By Application, 2025 to 2035
      • Bakery
      • Confectionary
      • Nutritional Bars
      • Meat Analogues
      • Cosmetics
      • Pet Foods
      • Personal Care
      • Nutritional Beverages
      • Others
    • Y-o-Y Growth Trend Analysis By Application, 2020 to 2024
    • Absolute $ Opportunity Analysis By Application, 2025 to 2035
  8. Global Market Analysis 2020 to 2024 and Forecast 2025 to 2035, By Concentration
    • Introduction / Key Findings
    • Historical Market Size Value (USD Million) Analysis By Concentration, 2020 to 2024
    • Current and Future Market Size Value (USD Million) Analysis and Forecast By Concentration, 2025 to 2035
      • 85% Concentrated
      • 75% Concentrated
      • 95% Concentrated
    • Y-o-Y Growth Trend Analysis By Concentration, 2020 to 2024
    • Absolute $ Opportunity Analysis By Concentration, 2025 to 2035
  9. Global Market Analysis 2020 to 2024 and Forecast 2025 to 2035, By Sales Channel
    • Introduction / Key Findings
    • Historical Market Size Value (USD Million) Analysis By Sales Channel, 2020 to 2024
    • Current and Future Market Size Value (USD Million) Analysis and Forecast By Sales Channel, 2025 to 2035
      • Direct Sales
      • Indirect Sales
      • Supermarket/Hypermarket
      • Online Stores
      • Retail Stores
    • Y-o-Y Growth Trend Analysis By Sales Channel, 2020 to 2024
    • Absolute $ Opportunity Analysis By Sales Channel, 2025 to 2035
  10. Global Market Analysis 2020 to 2024 and Forecast 2025 to 2035, By Form
    • Introduction / Key Findings
    • Historical Market Size Value (USD Million) Analysis By Form, 2020 to 2024
    • Current and Future Market Size Value (USD Million) Analysis and Forecast By Form, 2025 to 2035
      • Powder
      • Liquid
    • Y-o-Y Growth Trend Analysis By Form, 2020 to 2024
    • Absolute $ Opportunity Analysis By Form, 2025 to 2035
  11. Global Market Analysis 2020 to 2024 and Forecast 2025 to 2035, By Region
    • Introduction
    • Historical Market Size Value (USD Million) Analysis By Region, 2020 to 2024
    • Current Market Size Value (USD Million) Analysis and Forecast By Region, 2025 to 2035
      • North America
      • Latin America
      • Western Europe
      • Eastern Europe
      • East Asia
      • South Asia and Pacific
      • Middle East & Africa
    • Market Attractiveness Analysis By Region
  12. North America Market Analysis 2020 to 2024 and Forecast 2025 to 2035, By Country
    • Historical Market Size Value (USD Million) Trend Analysis By Market Taxonomy, 2020 to 2024
    • Market Size Value (USD Million) Forecast By Market Taxonomy, 2025 to 2035
      • By Country
        • USA
        • Canada
        • Mexico
      • By Nature
      • By Application
      • By Concentration
      • By Sales Channel
      • By Form
    • Market Attractiveness Analysis
      • By Country
      • By Nature
      • By Application
      • By Concentration
      • By Sales Channel
      • By Form
    • Key Takeaways
  13. Latin America Market Analysis 2020 to 2024 and Forecast 2025 to 2035, By Country
    • Historical Market Size Value (USD Million) Trend Analysis By Market Taxonomy, 2020 to 2024
    • Market Size Value (USD Million) Forecast By Market Taxonomy, 2025 to 2035
      • By Country
        • Brazil
        • Chile
        • Rest of Latin America
      • By Nature
      • By Application
      • By Concentration
      • By Sales Channel
      • By Form
    • Market Attractiveness Analysis
      • By Country
      • By Nature
      • By Application
      • By Concentration
      • By Sales Channel
      • By Form
    • Key Takeaways
  14. Western Europe Market Analysis 2020 to 2024 and Forecast 2025 to 2035, By Country
    • Historical Market Size Value (USD Million) Trend Analysis By Market Taxonomy, 2020 to 2024
    • Market Size Value (USD Million) Forecast By Market Taxonomy, 2025 to 2035
      • By Country
        • Germany
        • UK
        • Italy
        • Spain
        • France
        • Nordic
        • BENELUX
        • Rest of Western Europe
      • By Nature
      • By Application
      • By Concentration
      • By Sales Channel
      • By Form
    • Market Attractiveness Analysis
      • By Country
      • By Nature
      • By Application
      • By Concentration
      • By Sales Channel
      • By Form
    • Key Takeaways
  15. Eastern Europe Market Analysis 2020 to 2024 and Forecast 2025 to 2035, By Country
    • Historical Market Size Value (USD Million) Trend Analysis By Market Taxonomy, 2020 to 2024
    • Market Size Value (USD Million) Forecast By Market Taxonomy, 2025 to 2035
      • By Country
        • Russia
        • Poland
        • Hungary
        • Balkan & Baltic
        • Rest of Eastern Europe
      • By Nature
      • By Application
      • By Concentration
      • By Sales Channel
      • By Form
    • Market Attractiveness Analysis
      • By Country
      • By Nature
      • By Application
      • By Concentration
      • By Sales Channel
      • By Form
    • Key Takeaways
  16. East Asia Market Analysis 2020 to 2024 and Forecast 2025 to 2035, By Country
    • Historical Market Size Value (USD Million) Trend Analysis By Market Taxonomy, 2020 to 2024
    • Market Size Value (USD Million) Forecast By Market Taxonomy, 2025 to 2035
      • By Country
        • China
        • Japan
        • South Korea
      • By Nature
      • By Application
      • By Concentration
      • By Sales Channel
      • By Form
    • Market Attractiveness Analysis
      • By Country
      • By Nature
      • By Application
      • By Concentration
      • By Sales Channel
      • By Form
    • Key Takeaways
  17. South Asia and Pacific Market Analysis 2020 to 2024 and Forecast 2025 to 2035, By Country
    • Historical Market Size Value (USD Million) Trend Analysis By Market Taxonomy, 2020 to 2024
    • Market Size Value (USD Million) Forecast By Market Taxonomy, 2025 to 2035
      • By Country
        • India
        • ASEAN
        • Australia & New Zealand
        • Rest of South Asia and Pacific
      • By Nature
      • By Application
      • By Concentration
      • By Sales Channel
      • By Form
    • Market Attractiveness Analysis
      • By Country
      • By Nature
      • By Application
      • By Concentration
      • By Sales Channel
      • By Form
    • Key Takeaways
  18. Middle East & Africa Market Analysis 2020 to 2024 and Forecast 2025 to 2035, By Country
    • Historical Market Size Value (USD Million) Trend Analysis By Market Taxonomy, 2020 to 2024
    • Market Size Value (USD Million) Forecast By Market Taxonomy, 2025 to 2035
      • By Country
        • Kingdom of Saudi Arabia
        • Other GCC Countries
        • Turkiye
        • South Africa
        • Other African Union
        • Rest of Middle East & Africa
      • By Nature
      • By Application
      • By Concentration
      • By Sales Channel
      • By Form
    • Market Attractiveness Analysis
      • By Country
      • By Nature
      • By Application
      • By Concentration
      • By Sales Channel
      • By Form
    • Key Takeaways
  19. Key Countries Market Analysis
    • USA
      • Pricing Analysis
      • Market Share Analysis, 2024
        • By Nature
        • By Application
        • By Concentration
        • By Sales Channel
        • By Form
    • Canada
      • Pricing Analysis
      • Market Share Analysis, 2024
        • By Nature
        • By Application
        • By Concentration
        • By Sales Channel
        • By Form
    • Mexico
      • Pricing Analysis
      • Market Share Analysis, 2024
        • By Nature
        • By Application
        • By Concentration
        • By Sales Channel
        • By Form
    • Brazil
      • Pricing Analysis
      • Market Share Analysis, 2024
        • By Nature
        • By Application
        • By Concentration
        • By Sales Channel
        • By Form
    • Chile
      • Pricing Analysis
      • Market Share Analysis, 2024
        • By Nature
        • By Application
        • By Concentration
        • By Sales Channel
        • By Form
    • Germany
      • Pricing Analysis
      • Market Share Analysis, 2024
        • By Nature
        • By Application
        • By Concentration
        • By Sales Channel
        • By Form
    • UK
      • Pricing Analysis
      • Market Share Analysis, 2024
        • By Nature
        • By Application
        • By Concentration
        • By Sales Channel
        • By Form
    • Italy
      • Pricing Analysis
      • Market Share Analysis, 2024
        • By Nature
        • By Application
        • By Concentration
        • By Sales Channel
        • By Form
    • Spain
      • Pricing Analysis
      • Market Share Analysis, 2024
        • By Nature
        • By Application
        • By Concentration
        • By Sales Channel
        • By Form
    • France
      • Pricing Analysis
      • Market Share Analysis, 2024
        • By Nature
        • By Application
        • By Concentration
        • By Sales Channel
        • By Form
    • India
      • Pricing Analysis
      • Market Share Analysis, 2024
        • By Nature
        • By Application
        • By Concentration
        • By Sales Channel
        • By Form
    • ASEAN
      • Pricing Analysis
      • Market Share Analysis, 2024
        • By Nature
        • By Application
        • By Concentration
        • By Sales Channel
        • By Form
    • Australia & New Zealand
      • Pricing Analysis
      • Market Share Analysis, 2024
        • By Nature
        • By Application
        • By Concentration
        • By Sales Channel
        • By Form
    • China
      • Pricing Analysis
      • Market Share Analysis, 2024
        • By Nature
        • By Application
        • By Concentration
        • By Sales Channel
        • By Form
    • Japan
      • Pricing Analysis
      • Market Share Analysis, 2024
        • By Nature
        • By Application
        • By Concentration
        • By Sales Channel
        • By Form
    • South Korea
      • Pricing Analysis
      • Market Share Analysis, 2024
        • By Nature
        • By Application
        • By Concentration
        • By Sales Channel
        • By Form
    • Russia
      • Pricing Analysis
      • Market Share Analysis, 2024
        • By Nature
        • By Application
        • By Concentration
        • By Sales Channel
        • By Form
    • Poland
      • Pricing Analysis
      • Market Share Analysis, 2024
        • By Nature
        • By Application
        • By Concentration
        • By Sales Channel
        • By Form
    • Hungary
      • Pricing Analysis
      • Market Share Analysis, 2024
        • By Nature
        • By Application
        • By Concentration
        • By Sales Channel
        • By Form
    • Kingdom of Saudi Arabia
      • Pricing Analysis
      • Market Share Analysis, 2024
        • By Nature
        • By Application
        • By Concentration
        • By Sales Channel
        • By Form
    • Turkiye
      • Pricing Analysis
      • Market Share Analysis, 2024
        • By Nature
        • By Application
        • By Concentration
        • By Sales Channel
        • By Form
    • South Africa
      • Pricing Analysis
      • Market Share Analysis, 2024
        • By Nature
        • By Application
        • By Concentration
        • By Sales Channel
        • By Form
  20. Market Structure Analysis
    • Competition Dashboard
    • Competition Benchmarking
    • Market Share Analysis of Top Players
      • By Regional
      • By Nature
      • By Application
      • By Concentration
      • By Sales Channel
      • By Form
  21. Competition Analysis
    • Competition Deep Dive
      • Archer Daniels Midland Company
        • Overview
        • Product Portfolio
        • Profitability by Market Segments (Product/Age /Sales Channel/Region)
        • Sales Footprint
        • Strategy Overview
          • Marketing Strategy
          • Product Strategy
          • Channel Strategy
      • Cargill, Incorporated
      • Roquette Frères
      • MGP Ingredients, Inc.
      • Kerry Group plc
      • Manildra Group
      • The Scoular Company
      • Tereos SCA
  22. Assumptions & Acronyms Used
  23. Research Methodology

List of Tables

  • Table 1: Global Market Value (USD Million) Forecast by Region, 2020 to 2035
  • Table 2: Global Market Value (USD Million) Forecast by Nature , 2020 to 2035
  • Table 3: Global Market Value (USD Million) Forecast by Application, 2020 to 2035
  • Table 4: Global Market Value (USD Million) Forecast by Concentration, 2020 to 2035
  • Table 5: Global Market Value (USD Million) Forecast by Sales Channel, 2020 to 2035
  • Table 6: Global Market Value (USD Million) Forecast by Form, 2020 to 2035
  • Table 7: North America Market Value (USD Million) Forecast by Country, 2020 to 2035
  • Table 8: North America Market Value (USD Million) Forecast by Nature , 2020 to 2035
  • Table 9: North America Market Value (USD Million) Forecast by Application, 2020 to 2035
  • Table 10: North America Market Value (USD Million) Forecast by Concentration, 2020 to 2035
  • Table 11: North America Market Value (USD Million) Forecast by Sales Channel, 2020 to 2035
  • Table 12: North America Market Value (USD Million) Forecast by Form, 2020 to 2035
  • Table 13: Latin America Market Value (USD Million) Forecast by Country, 2020 to 2035
  • Table 14: Latin America Market Value (USD Million) Forecast by Nature , 2020 to 2035
  • Table 15: Latin America Market Value (USD Million) Forecast by Application, 2020 to 2035
  • Table 16: Latin America Market Value (USD Million) Forecast by Concentration, 2020 to 2035
  • Table 17: Latin America Market Value (USD Million) Forecast by Sales Channel, 2020 to 2035
  • Table 18: Latin America Market Value (USD Million) Forecast by Form, 2020 to 2035
  • Table 19: Western Europe Market Value (USD Million) Forecast by Country, 2020 to 2035
  • Table 20: Western Europe Market Value (USD Million) Forecast by Nature , 2020 to 2035
  • Table 21: Western Europe Market Value (USD Million) Forecast by Application, 2020 to 2035
  • Table 22: Western Europe Market Value (USD Million) Forecast by Concentration, 2020 to 2035
  • Table 23: Western Europe Market Value (USD Million) Forecast by Sales Channel, 2020 to 2035
  • Table 24: Western Europe Market Value (USD Million) Forecast by Form, 2020 to 2035
  • Table 25: Eastern Europe Market Value (USD Million) Forecast by Country, 2020 to 2035
  • Table 26: Eastern Europe Market Value (USD Million) Forecast by Nature , 2020 to 2035
  • Table 27: Eastern Europe Market Value (USD Million) Forecast by Application, 2020 to 2035
  • Table 28: Eastern Europe Market Value (USD Million) Forecast by Concentration, 2020 to 2035
  • Table 29: Eastern Europe Market Value (USD Million) Forecast by Sales Channel, 2020 to 2035
  • Table 30: Eastern Europe Market Value (USD Million) Forecast by Form, 2020 to 2035
  • Table 31: East Asia Market Value (USD Million) Forecast by Country, 2020 to 2035
  • Table 32: East Asia Market Value (USD Million) Forecast by Nature , 2020 to 2035
  • Table 33: East Asia Market Value (USD Million) Forecast by Application, 2020 to 2035
  • Table 34: East Asia Market Value (USD Million) Forecast by Concentration, 2020 to 2035
  • Table 35: East Asia Market Value (USD Million) Forecast by Sales Channel, 2020 to 2035
  • Table 36: East Asia Market Value (USD Million) Forecast by Form, 2020 to 2035
  • Table 37: South Asia and Pacific Market Value (USD Million) Forecast by Country, 2020 to 2035
  • Table 38: South Asia and Pacific Market Value (USD Million) Forecast by Nature , 2020 to 2035
  • Table 39: South Asia and Pacific Market Value (USD Million) Forecast by Application, 2020 to 2035
  • Table 40: South Asia and Pacific Market Value (USD Million) Forecast by Concentration, 2020 to 2035
  • Table 41: South Asia and Pacific Market Value (USD Million) Forecast by Sales Channel, 2020 to 2035
  • Table 42: South Asia and Pacific Market Value (USD Million) Forecast by Form, 2020 to 2035
  • Table 43: Middle East & Africa Market Value (USD Million) Forecast by Country, 2020 to 2035
  • Table 44: Middle East & Africa Market Value (USD Million) Forecast by Nature , 2020 to 2035
  • Table 45: Middle East & Africa Market Value (USD Million) Forecast by Application, 2020 to 2035
  • Table 46: Middle East & Africa Market Value (USD Million) Forecast by Concentration, 2020 to 2035
  • Table 47: Middle East & Africa Market Value (USD Million) Forecast by Sales Channel, 2020 to 2035
  • Table 48: Middle East & Africa Market Value (USD Million) Forecast by Form, 2020 to 2035

List of Figures

  • Figure 1: Global Market Pricing Analysis
  • Figure 2: Global Market Value (USD Million) Forecast 2020-2035
  • Figure 3: Global Market Value Share and BPS Analysis by Nature , 2025 and 2035
  • Figure 4: Global Market Y-o-Y Growth Comparison by Nature , 2025-2035
  • Figure 5: Global Market Attractiveness Analysis by Nature
  • Figure 6: Global Market Value Share and BPS Analysis by Application, 2025 and 2035
  • Figure 7: Global Market Y-o-Y Growth Comparison by Application, 2025-2035
  • Figure 8: Global Market Attractiveness Analysis by Application
  • Figure 9: Global Market Value Share and BPS Analysis by Concentration, 2025 and 2035
  • Figure 10: Global Market Y-o-Y Growth Comparison by Concentration, 2025-2035
  • Figure 11: Global Market Attractiveness Analysis by Concentration
  • Figure 12: Global Market Value Share and BPS Analysis by Sales Channel, 2025 and 2035
  • Figure 13: Global Market Y-o-Y Growth Comparison by Sales Channel, 2025-2035
  • Figure 14: Global Market Attractiveness Analysis by Sales Channel
  • Figure 15: Global Market Value Share and BPS Analysis by Form, 2025 and 2035
  • Figure 16: Global Market Y-o-Y Growth Comparison by Form, 2025-2035
  • Figure 17: Global Market Attractiveness Analysis by Form
  • Figure 18: Global Market Value (USD Million) Share and BPS Analysis by Region, 2025 and 2035
  • Figure 19: Global Market Y-o-Y Growth Comparison by Region, 2025-2035
  • Figure 20: Global Market Attractiveness Analysis by Region
  • Figure 21: North America Market Incremental Dollar Opportunity, 2025-2035
  • Figure 22: Latin America Market Incremental Dollar Opportunity, 2025-2035
  • Figure 23: Western Europe Market Incremental Dollar Opportunity, 2025-2035
  • Figure 24: Eastern Europe Market Incremental Dollar Opportunity, 2025-2035
  • Figure 25: East Asia Market Incremental Dollar Opportunity, 2025-2035
  • Figure 26: South Asia and Pacific Market Incremental Dollar Opportunity, 2025-2035
  • Figure 27: Middle East & Africa Market Incremental Dollar Opportunity, 2025-2035
  • Figure 28: North America Market Value Share and BPS Analysis by Country, 2025 and 2035
  • Figure 29: North America Market Value Share and BPS Analysis by Nature , 2025 and 2035
  • Figure 30: North America Market Y-o-Y Growth Comparison by Nature , 2025-2035
  • Figure 31: North America Market Attractiveness Analysis by Nature
  • Figure 32: North America Market Value Share and BPS Analysis by Application, 2025 and 2035
  • Figure 33: North America Market Y-o-Y Growth Comparison by Application, 2025-2035
  • Figure 34: North America Market Attractiveness Analysis by Application
  • Figure 35: North America Market Value Share and BPS Analysis by Concentration, 2025 and 2035
  • Figure 36: North America Market Y-o-Y Growth Comparison by Concentration, 2025-2035
  • Figure 37: North America Market Attractiveness Analysis by Concentration
  • Figure 38: North America Market Value Share and BPS Analysis by Sales Channel, 2025 and 2035
  • Figure 39: North America Market Y-o-Y Growth Comparison by Sales Channel, 2025-2035
  • Figure 40: North America Market Attractiveness Analysis by Sales Channel
  • Figure 41: North America Market Value Share and BPS Analysis by Form, 2025 and 2035
  • Figure 42: North America Market Y-o-Y Growth Comparison by Form, 2025-2035
  • Figure 43: North America Market Attractiveness Analysis by Form
  • Figure 44: Latin America Market Value Share and BPS Analysis by Country, 2025 and 2035
  • Figure 45: Latin America Market Value Share and BPS Analysis by Nature , 2025 and 2035
  • Figure 46: Latin America Market Y-o-Y Growth Comparison by Nature , 2025-2035
  • Figure 47: Latin America Market Attractiveness Analysis by Nature
  • Figure 48: Latin America Market Value Share and BPS Analysis by Application, 2025 and 2035
  • Figure 49: Latin America Market Y-o-Y Growth Comparison by Application, 2025-2035
  • Figure 50: Latin America Market Attractiveness Analysis by Application
  • Figure 51: Latin America Market Value Share and BPS Analysis by Concentration, 2025 and 2035
  • Figure 52: Latin America Market Y-o-Y Growth Comparison by Concentration, 2025-2035
  • Figure 53: Latin America Market Attractiveness Analysis by Concentration
  • Figure 54: Latin America Market Value Share and BPS Analysis by Sales Channel, 2025 and 2035
  • Figure 55: Latin America Market Y-o-Y Growth Comparison by Sales Channel, 2025-2035
  • Figure 56: Latin America Market Attractiveness Analysis by Sales Channel
  • Figure 57: Latin America Market Value Share and BPS Analysis by Form, 2025 and 2035
  • Figure 58: Latin America Market Y-o-Y Growth Comparison by Form, 2025-2035
  • Figure 59: Latin America Market Attractiveness Analysis by Form
  • Figure 60: Western Europe Market Value Share and BPS Analysis by Country, 2025 and 2035
  • Figure 61: Western Europe Market Value Share and BPS Analysis by Nature , 2025 and 2035
  • Figure 62: Western Europe Market Y-o-Y Growth Comparison by Nature , 2025-2035
  • Figure 63: Western Europe Market Attractiveness Analysis by Nature
  • Figure 64: Western Europe Market Value Share and BPS Analysis by Application, 2025 and 2035
  • Figure 65: Western Europe Market Y-o-Y Growth Comparison by Application, 2025-2035
  • Figure 66: Western Europe Market Attractiveness Analysis by Application
  • Figure 67: Western Europe Market Value Share and BPS Analysis by Concentration, 2025 and 2035
  • Figure 68: Western Europe Market Y-o-Y Growth Comparison by Concentration, 2025-2035
  • Figure 69: Western Europe Market Attractiveness Analysis by Concentration
  • Figure 70: Western Europe Market Value Share and BPS Analysis by Sales Channel, 2025 and 2035
  • Figure 71: Western Europe Market Y-o-Y Growth Comparison by Sales Channel, 2025-2035
  • Figure 72: Western Europe Market Attractiveness Analysis by Sales Channel
  • Figure 73: Western Europe Market Value Share and BPS Analysis by Form, 2025 and 2035
  • Figure 74: Western Europe Market Y-o-Y Growth Comparison by Form, 2025-2035
  • Figure 75: Western Europe Market Attractiveness Analysis by Form
  • Figure 76: Eastern Europe Market Value Share and BPS Analysis by Country, 2025 and 2035
  • Figure 77: Eastern Europe Market Value Share and BPS Analysis by Nature , 2025 and 2035
  • Figure 78: Eastern Europe Market Y-o-Y Growth Comparison by Nature , 2025-2035
  • Figure 79: Eastern Europe Market Attractiveness Analysis by Nature
  • Figure 80: Eastern Europe Market Value Share and BPS Analysis by Application, 2025 and 2035
  • Figure 81: Eastern Europe Market Y-o-Y Growth Comparison by Application, 2025-2035
  • Figure 82: Eastern Europe Market Attractiveness Analysis by Application
  • Figure 83: Eastern Europe Market Value Share and BPS Analysis by Concentration, 2025 and 2035
  • Figure 84: Eastern Europe Market Y-o-Y Growth Comparison by Concentration, 2025-2035
  • Figure 85: Eastern Europe Market Attractiveness Analysis by Concentration
  • Figure 86: Eastern Europe Market Value Share and BPS Analysis by Sales Channel, 2025 and 2035
  • Figure 87: Eastern Europe Market Y-o-Y Growth Comparison by Sales Channel, 2025-2035
  • Figure 88: Eastern Europe Market Attractiveness Analysis by Sales Channel
  • Figure 89: Eastern Europe Market Value Share and BPS Analysis by Form, 2025 and 2035
  • Figure 90: Eastern Europe Market Y-o-Y Growth Comparison by Form, 2025-2035
  • Figure 91: Eastern Europe Market Attractiveness Analysis by Form
  • Figure 92: East Asia Market Value Share and BPS Analysis by Country, 2025 and 2035
  • Figure 93: East Asia Market Value Share and BPS Analysis by Nature , 2025 and 2035
  • Figure 94: East Asia Market Y-o-Y Growth Comparison by Nature , 2025-2035
  • Figure 95: East Asia Market Attractiveness Analysis by Nature
  • Figure 96: East Asia Market Value Share and BPS Analysis by Application, 2025 and 2035
  • Figure 97: East Asia Market Y-o-Y Growth Comparison by Application, 2025-2035
  • Figure 98: East Asia Market Attractiveness Analysis by Application
  • Figure 99: East Asia Market Value Share and BPS Analysis by Concentration, 2025 and 2035
  • Figure 100: East Asia Market Y-o-Y Growth Comparison by Concentration, 2025-2035
  • Figure 101: East Asia Market Attractiveness Analysis by Concentration
  • Figure 102: East Asia Market Value Share and BPS Analysis by Sales Channel, 2025 and 2035
  • Figure 103: East Asia Market Y-o-Y Growth Comparison by Sales Channel, 2025-2035
  • Figure 104: East Asia Market Attractiveness Analysis by Sales Channel
  • Figure 105: East Asia Market Value Share and BPS Analysis by Form, 2025 and 2035
  • Figure 106: East Asia Market Y-o-Y Growth Comparison by Form, 2025-2035
  • Figure 107: East Asia Market Attractiveness Analysis by Form
  • Figure 108: South Asia and Pacific Market Value Share and BPS Analysis by Country, 2025 and 2035
  • Figure 109: South Asia and Pacific Market Value Share and BPS Analysis by Nature , 2025 and 2035
  • Figure 110: South Asia and Pacific Market Y-o-Y Growth Comparison by Nature , 2025-2035
  • Figure 111: South Asia and Pacific Market Attractiveness Analysis by Nature
  • Figure 112: South Asia and Pacific Market Value Share and BPS Analysis by Application, 2025 and 2035
  • Figure 113: South Asia and Pacific Market Y-o-Y Growth Comparison by Application, 2025-2035
  • Figure 114: South Asia and Pacific Market Attractiveness Analysis by Application
  • Figure 115: South Asia and Pacific Market Value Share and BPS Analysis by Concentration, 2025 and 2035
  • Figure 116: South Asia and Pacific Market Y-o-Y Growth Comparison by Concentration, 2025-2035
  • Figure 117: South Asia and Pacific Market Attractiveness Analysis by Concentration
  • Figure 118: South Asia and Pacific Market Value Share and BPS Analysis by Sales Channel, 2025 and 2035
  • Figure 119: South Asia and Pacific Market Y-o-Y Growth Comparison by Sales Channel, 2025-2035
  • Figure 120: South Asia and Pacific Market Attractiveness Analysis by Sales Channel
  • Figure 121: South Asia and Pacific Market Value Share and BPS Analysis by Form, 2025 and 2035
  • Figure 122: South Asia and Pacific Market Y-o-Y Growth Comparison by Form, 2025-2035
  • Figure 123: South Asia and Pacific Market Attractiveness Analysis by Form
  • Figure 124: Middle East & Africa Market Value Share and BPS Analysis by Country, 2025 and 2035
  • Figure 125: Middle East & Africa Market Value Share and BPS Analysis by Nature , 2025 and 2035
  • Figure 126: Middle East & Africa Market Y-o-Y Growth Comparison by Nature , 2025-2035
  • Figure 127: Middle East & Africa Market Attractiveness Analysis by Nature
  • Figure 128: Middle East & Africa Market Value Share and BPS Analysis by Application, 2025 and 2035
  • Figure 129: Middle East & Africa Market Y-o-Y Growth Comparison by Application, 2025-2035
  • Figure 130: Middle East & Africa Market Attractiveness Analysis by Application
  • Figure 131: Middle East & Africa Market Value Share and BPS Analysis by Concentration, 2025 and 2035
  • Figure 132: Middle East & Africa Market Y-o-Y Growth Comparison by Concentration, 2025-2035
  • Figure 133: Middle East & Africa Market Attractiveness Analysis by Concentration
  • Figure 134: Middle East & Africa Market Value Share and BPS Analysis by Sales Channel, 2025 and 2035
  • Figure 135: Middle East & Africa Market Y-o-Y Growth Comparison by Sales Channel, 2025-2035
  • Figure 136: Middle East & Africa Market Attractiveness Analysis by Sales Channel
  • Figure 137: Middle East & Africa Market Value Share and BPS Analysis by Form, 2025 and 2035
  • Figure 138: Middle East & Africa Market Y-o-Y Growth Comparison by Form, 2025-2035
  • Figure 139: Middle East & Africa Market Attractiveness Analysis by Form
  • Figure 140: Global Market - Tier Structure Analysis
  • Figure 141: Global Market - Company Share Analysis
Dashboard
Dashboard
Dashboard
Dashboard
Dashboard
Dashboard

Full Research Suite comprises of:

Market outlook & trends analysis

Market outlook & trends analysis

Interviews & case studies

Interviews & case studies

Strategic recommendations

Strategic recommendations

Vendor profiles & capabilities analysis

Vendor profiles & capabilities analysis

5-year forecasts

5-year forecasts

8 regions and 60+ country-level data splits

8 regions and 60+ country-level data splits

Market segment data splits

Market segment data splits

12 months of continuous data updates

12 months of continuous data updates

DELIVERED AS:

PDF EXCEL ONLINE

Full Research Suite


$3500

$5000

$6500

Buy Report Now
Similar Industry Reports

Similar Industry Reports

Wheat Malt Market
Wheat Malt Market

Wheat Malt Market Size and Share Forecast Outlook 2025 to 2035

Wheatgrass Products Market

Wheatgrass Products Market Size and Share Forecast Outlook 2025 to 2035

Wheat Gluten Market
Wheat Gluten Market

Wheat Gluten Market Size and Share Forecast Outlook 2025 to 2035

Wheat Germ Oil Market

Wheat Germ Oil Market Outlook - Demand & Forecast 2025 to 2035

Wheat Starch Market
Wheat Starch Market

Wheat Starch Market Size and Share Forecast Outlook 2025 to 2035

Wheat Milling Machine Market

Wheat Milling Machine Market Size and Share Forecast Outlook 2025 to 2035

Wheat Germ Market
Wheat Germ Market

Wheat Germ Market Analysis by Nature, Sales Channel and Form Through 2035

Wheat Fiber Market
Wheat Fiber Market

Wheat Fiber Market Growth - Dietary Fiber & Functional Food Trends 2024 to 2034

Wheat Protein Market

Wheat Protein Market Size, Growth, and Forecast for 2025 to 2035

Buckwheat Seed Market

Buckwheat Seed Market Size and Share Forecast Outlook 2025 to 2035

Buckwheat Groat Flour Market

Buckwheat Groat Flour Market

Buckwheat Market
Buckwheat Market

Buckwheat Market

White Wheat Malt Market

White Wheat Malt Market Size and Share Forecast Outlook 2025 to 2035

Spelt Wheat Market
Spelt Wheat Market

Spelt Wheat Market Size and Share Forecast Outlook 2025 to 2035

Whole-Wheat Flour Market

Whole-Wheat Flour Market Size, Growth, and Forecast 2025 to 2035

Durum Wheat Flour Market

Durum Wheat Flour Market

Malted Wheat Flour Market

Malted Wheat Flour Market

Organic Wheat Flour Market

Organic Wheat Flour Market

Cultured Wheat Market

Cultured Wheat Market Analysis - Size, Share, and Forecast Outlook 2025 to 2035

Cultured Wheat Flour Market

Cultured Wheat Flour Market Analysis by Bread, Bakery Products, Pasta, and Others Through 2035

Future Market Insights

Hydrolysed Wheat Protein Market

Chat With MaRIA

Chat With

MaRIA

Hi There, I am MaRIA, Your Market Research Intelligence Assistant. How may I help you?