The Industrial Radiography Market is estimated to be valued at USD 0.8 billion in 2025 and is projected to reach USD 1.6 billion by 2035, registering a compound annual growth rate (CAGR) of 7.9% over the forecast period.
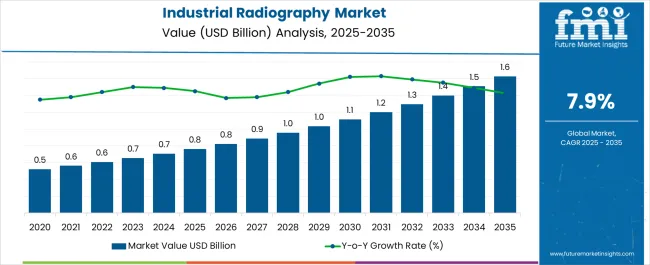
| Metric | Value |
|---|---|
| Industrial Radiography Market Estimated Value in (2025 E) | USD 0.8 billion |
| Industrial Radiography Market Forecast Value in (2035 F) | USD 1.6 billion |
| Forecast CAGR (2025 to 2035) | 7.9% |
The industrial radiography market is witnessing consistent growth, supported by the rising demand for non-destructive testing (NDT) solutions across industries that prioritize operational safety and quality assurance. Industry reports and corporate disclosures have emphasized the growing adoption of advanced imaging systems for detecting structural defects in critical infrastructure and industrial components.
The increasing scale of power generation, oil and gas, aerospace, and automotive projects has further expanded the application base of radiographic testing. Regulatory mandates for rigorous inspection protocols and preventive maintenance have reinforced the importance of industrial radiography in reducing equipment failures and extending asset lifecycles.
Digital advancements in radiography have streamlined inspection workflows, reducing turnaround times and enabling more accurate defect detection. Future growth is expected to be accelerated by integration of artificial intelligence in image processing, adoption of portable radiography devices for field inspections, and the expansion of industrial safety standards worldwide. With demand concentrated in high-risk industries, digital radiography and power generation applications are projected to anchor market expansion.
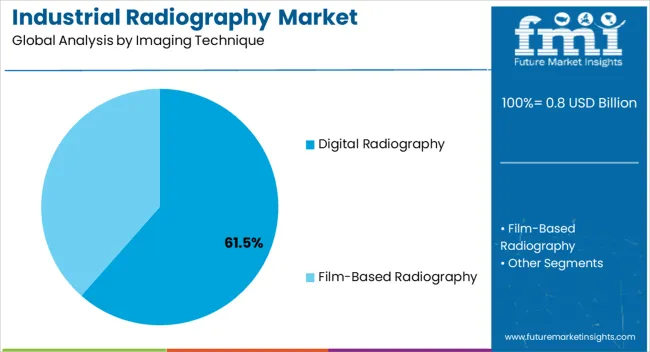
The digital radiography segment is projected to account for 61.50% of the industrial radiography market revenue in 2025, holding its position as the dominant imaging technique. Growth of this segment has been driven by its ability to deliver rapid imaging results, higher resolution, and improved workflow efficiency compared to conventional film-based methods.
Industrial operators have favored digital radiography for its reduced inspection time, lower operational costs, and enhanced image storage and sharing capabilities. Reports from equipment manufacturers have highlighted significant investments in portable and automated digital radiography systems, which have expanded their usability in diverse field conditions.
Additionally, the reduced need for chemical processing and the ability to immediately evaluate captured images have contributed to broader adoption. The growing use of predictive maintenance programs has also aligned with digital radiography’s advantages in data integration and analysis, ensuring its sustained market leadership.
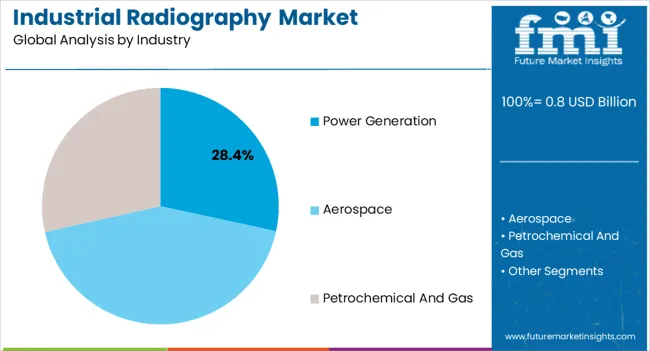
The power generation segment is projected to contribute 28.40% of the industrial radiography market revenue in 2025, maintaining its role as a leading end-use industry. This segment’s growth has been supported by the critical need to ensure the structural integrity and operational reliability of boilers, turbines, pipelines, and nuclear components.
Regulatory bodies have mandated stringent inspection protocols in the power sector to mitigate risks of catastrophic failures and downtime. Radiography has been widely applied for detecting weld defects, corrosion, and fatigue cracks in power generation infrastructure, ensuring compliance with safety and performance standards.
Energy sector publications have noted increasing reliance on digital radiography for real-time inspection of large-scale installations, which has improved operational efficiency. The global expansion of renewable and conventional power plants, combined with aging infrastructure in developed regions, has reinforced the demand for continuous radiographic inspections. As global energy consumption rises, the power generation segment is expected to remain a central driver of industrial radiography applications.
From 2020 to 2025, sales witnessed significant growth, registering a CAGR of 6.2%. The industrial radiography market generated revenue of USD 0.8 million in 2025. Over 2020 to 2025, the global industrial radiography industry underwent significant changes.
Industries realized the importance of safety and precision, driving a shift towards advanced technology. Radiography, a crucial part of non-destructive testing, evolved as companies aimed for compliance and excellence.
During this time, there was a growing awareness about industrial safety. Different sectors, like manufacturing and aerospace, understood the risks of undetected defects, leading to a higher demand for careful radiographic inspections. Modern radiography equipment and techniques, blending AI and data analytics, came to the forefront.
Looking ahead from 2025 to 2035, the future of the industrial radiography market appears even more promising. This period will witness deeper collaboration between human expertise and artificial intelligence. Augmented reality is likely to be combined with radiography for greater efficiency and accuracy.
This growth is anticipated to be influenced by factors like increasing industrialization, strict regulations, and the pursuit of operational excellence. The future of industrial radiography will focus on real-time monitoring and predictive analytics. Environmental considerations and remote radiography services will also shape the industry.
| Countries | Market Share 2025 |
|---|---|
| The United States | 15.2% |
| Germany | 9.2% |
| Japan | 6.4% |
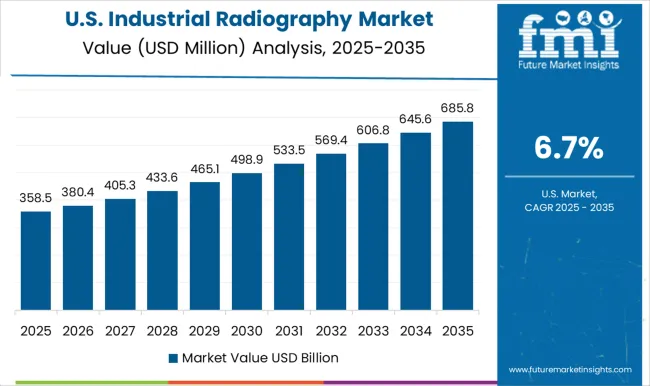
In 2025, the United States takes center stage in the industrial radiography market, commanding a substantial 15.2% market share. This share encapsulates the nation's fervent embrace of cutting-edge technology, fueling advancements in the field of industrial radiography.
A noteworthy trend within the United States is the rapid integration of artificial intelligence (AI) algorithms into radiographic analysis, enabling enhanced defect detection, predictive maintenance, and streamlined data interpretation. This trend, underpinned by a drive for operational excellence, sets the United States on a trajectory of radiographic innovation.
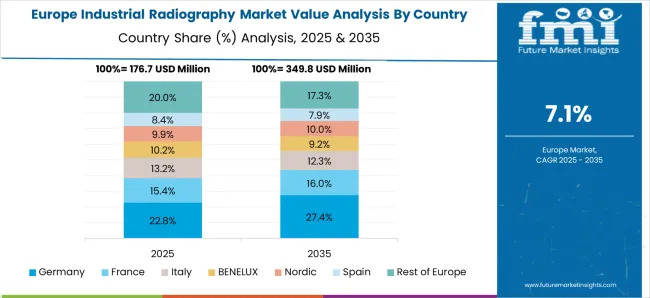
Within the expansive tapestry of industrial radiography, Germany's notable 9.2% market share stands as a testament to its unwavering commitment to engineering excellence and quality assurance.
A distinctive trend observed in Germany is the fusion of radiographic data with digital twin technology, facilitating real-time analysis, performance monitoring, and predictive maintenance of critical industrial components. This harmonious amalgamation of data-driven insights and technological prowess exemplifies Germany's pivotal role in shaping the future of industrial radiography.
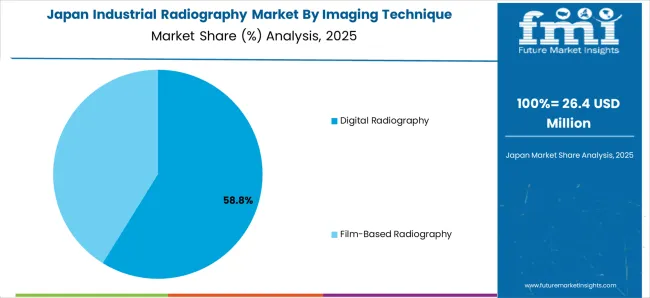
Securing a significant 6.4% market share on the global stage, Japan's industrial radiography landscape is characterized by meticulous attention to technological refinement. A captivating trend emerging in Japan is the integration of augmented reality (AR) into radiographic training and analysis.
This enhances precision and accuracy during complex radiographic procedures and empowers technicians with immersive visualizations, minimizing human error and elevating the overall efficacy of radiographic assessments. Japan's pursuit of precision finds a harmonious partner in AR-infused radiography.
| Countries | CAGR |
|---|---|
| Australia | 2.8% |
| China | 10.3% |
| India | 12.3% |
| United Kingdom | 8.2% |
Australia's industrial radiography sector is steadily evolving with a CAGR of 2.8% through 2035. Australia is increasing reliance on drones for radiographic inspection in remote and challenging environments is an intriguing trend.
This technological leap expands the boundaries of radiographic applications, enabling comprehensive assessments of difficult-to-access areas and, consequently, fostering enhanced safety, efficiency, and accuracy in radiographic endeavors.
China's robust CAGR of 10.3% through 2035 signals an unrelenting commitment to radiographic excellence. A distinctive trend within China's radiographic landscape is the rapid adoption of radiographic robotics. These automated systems precisely navigate hazardous environments, conducting comprehensive inspections and defect detection. This trend not only amplifies radiographic efficiency but also underscores China's dedication to enhancing worker safety and elevating the overall efficacy of industrial radiography.
India's industrial radiography industry is likely to expand at an anticipated CAGR of 12.3% through 2035. An emerging trend in India is the symbiotic integration of radiography with artificial intelligence (AI) algorithms. This partnership empowers radiographic systems to automatically recognize and categorize defects, expediting the analysis and interpretation process. This trend heralds a new era of efficiency in radiographic assessments, enabling technicians to focus on nuanced decision-making and reinforcing India's stance as a radiographic frontrunner.
Within the United Kingdom, poised for a CAGR of 8.2%, radiography charts a steady course of progression. A significant trend observed in the United Kingdom is the burgeoning utilization of radiographic data analytics for predictive maintenance and performance optimization.
This data-driven approach ensures the optimal utilization of industrial assets, minimizing downtime and maximizing operational efficiency. The synergy between radiography and data analytics defines the UK's radiographic journey, aligning technology and innovation for a future of sustained excellence.
| Segment Name | Segment Share |
|---|---|
| Digital Radiography | 63.4% |
| Power Generation | 34.2% |
Within the industrial radiography landscape, digital radiography emerges as the dominating imaging technique, commanding an impressive 63.4% market share. This technique's ascendancy is attributed to its unparalleled precision, efficiency, and reduced exposure to radiation. A notable trend within the digital radiography domain is the integration of advanced machine learning algorithms.
This synergistic approach enhances defect detection, image analysis, and interpretation, thereby optimizing radiographic assessments. Digital radiography's versatility and capacity to cater to a diverse range of industrial applications firmly establish it as the cornerstone of modern radiographic practices.
In the industrial radiography market, the power generation sector commands a substantial 34.2% share, standing as the dominant segment. The latest trend within this sector revolves around the adoption of advanced radiographic techniques for predictive maintenance of critical power generation components.
This proactive approach ensures the seamless operation of turbines, boilers, and generators by detecting potential defects before they escalate. By leveraging radiographic insights, the power generation industry maximizes efficiency, minimizes downtime, and underscores its pivotal role in driving reliable and sustainable energy production.
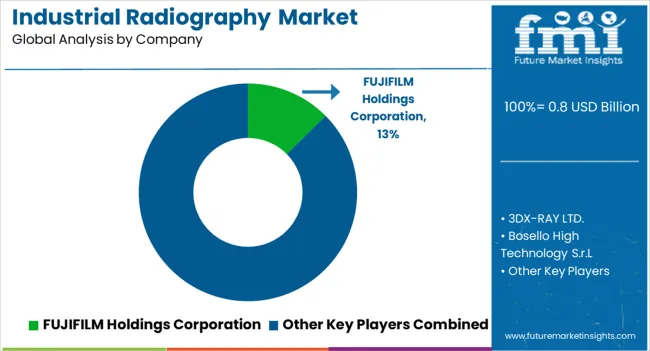
In the dynamic landscape of the industrial radiography market, companies are engaged in fierce competition driven by technological innovations, regulatory shifts, and a growing demand for non-destructive testing (NDT) solutions. As of the present moment, the industry is characterized by several key trends and strategies that companies are employing to thrive and establish a strong foothold:
Recent Developments
| Report Attribute | Details |
|---|---|
| Growth Rate | CAGR of 8.3% from 2025 to 2035 |
| Market Value in 2025 | USD 0.8 billion |
| Market Value in 2035 | USD 1.6 billion |
| Base Year for Estimation | 2025 |
| Historical Data | 2020 to 2025 |
| Forecast Period | 2025 to 2035 |
| Quantitative Units | Revenue in USD million and CAGR from 2025 to 2035 |
| Report Coverage | Revenue Forecast, Company Ranking, Competitive Landscape, Growth Factors, Trends and Pricing Analysis |
| Segments Covered | Imaging Technique, Industry, Region |
| Regions Covered | North America, Latin America, Europe, Asia Pacific, Middle East and Africa (MEA) |
| Key Countries Profiled | United States, Canada, Brazil, Mexico, Germany, UK, France, Spain, Italy, China, Japan, South Korea, Malaysia, Singapore, Australia, New Zealand, GCC, South Africa, Israel |
| Key Companies Profiled | FUJIFILM Holdings Corporation,, 3DX-RAY LTD., Bosello High Technology S.r.L, PerkinElmer, Inc., Mettler Toledo, PerkinElmer, Anritsu, Nikon Corporation, COMET Holding AG, Shimadzu Corporation |
The global industrial radiography market is estimated to be valued at USD 0.8 billion in 2025.
The market size for the industrial radiography market is projected to reach USD 1.6 billion by 2035.
The industrial radiography market is expected to grow at a 7.9% CAGR between 2025 and 2035.
The key product types in industrial radiography market are digital radiography and film-based radiography.
In terms of industry, power generation segment to command 28.4% share in the industrial radiography market in 2025.


Full Research Suite comprises of:
Market outlook & trends analysis
Interviews & case studies
Strategic recommendations
Vendor profiles & capabilities analysis
5-year forecasts
8 regions and 60+ country-level data splits
Market segment data splits
12 months of continuous data updates
DELIVERED AS:
PDF EXCEL ONLINE
Industrial Digital Radiography Market - Growth & Forecast 2025 to 2035
Industrial Dust Treatment System Market Size and Share Forecast Outlook 2025 to 2035
Industrial Vertical Washing Tower Market Size and Share Forecast Outlook 2025 to 2035
Industrial Electronics Packaging Market Forecast and Outlook 2025 to 2035
Industrial Absorbent Market Forecast and Outlook 2025 to 2035
Industrial Furnace Industry Analysis in Europe Forecast and Outlook 2025 to 2035
Industrial Denox System Market Size and Share Forecast Outlook 2025 to 2035
Industrial Electronic Pressure Switch Market Size and Share Forecast Outlook 2025 to 2035
Industrial WiFi Module Market Size and Share Forecast Outlook 2025 to 2035
Industrial Security System Market Forecast Outlook 2025 to 2035
Industrial Film Market Forecast Outlook 2025 to 2035
Industrial Floor Mat Market Forecast Outlook 2025 to 2035
Industrial Insulation Market Forecast and Outlook 2025 to 2035
Industrial Process Water Coolers Market Forecast and Outlook 2025 to 2035
Industrial Grade Ammonium Hydrogen Fluoride Market Forecast and Outlook 2025 to 2035
Industrial Grade Sodium Bifluoride Market Forecast and Outlook 2025 to 2035
Industrial Evaporative Condenser Market Size and Share Forecast Outlook 2025 to 2035
Industrial Power Supply Market Size and Share Forecast Outlook 2025 to 2035
Industrial Crystallizer Market Size and Share Forecast Outlook 2025 to 2035
Industrial Counterweight Market Size and Share Forecast Outlook 2025 to 2035

Thank you!
You will receive an email from our Business Development Manager. Please be sure to check your SPAM/JUNK folder too.
Chat With
MaRIA