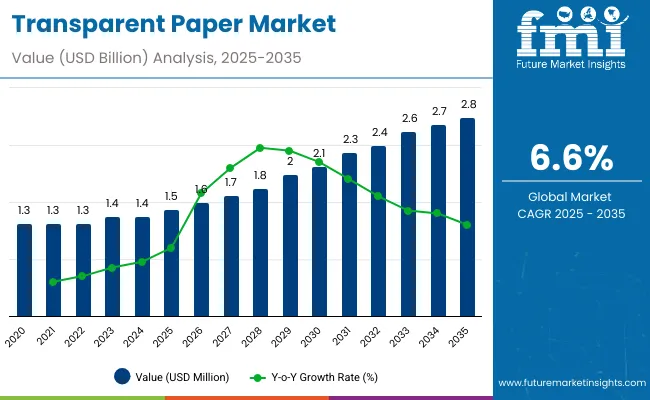
The transparent paper market will expand from USD 1.5 billion in 2025 to USD 2.9 billion by 2035, advancing at a CAGR of 6.6%. Growth is supported by increasing demand for sustainable, lightweight, and recyclable packaging. Transparent paper is widely adopted in food, bakery, and decorative packaging as a substitute for plastics.
| Metric | Value |
|---|---|
| Industry Size (2025E) | USD 1.5 billion |
| Industry Value (2035F) | USD 2.9 billion |
| CAGR (2025 to 2035) | 6.6% |
Between 2025 and 2030, the market will add USD 0.6 billion, driven by FMCG and confectionery demand. From 2030 to 2035, another USD 0.8 billion will be added through industrial packaging and publishing applications. Cellulose-based materials and food end-use will anchor growth, with Asia-Pacific leading expansion.
From 2020 to 2024, transparent paper gained traction as industries sought plastic-free, recyclable solutions for food and retail packaging. FMCG brands, especially in bakery and confectionery, drove early adoption. Cellulose-based and glazed variants led due to clarity and durability. Decorative and printing applications supported expansion in Europe and Asia.
By 2035, the market will reach USD 2.9 billion at 6.6% CAGR. Cellulose-based materials will dominate, supported by scalability and global mandates against plastics. Food and beverage applications will anchor demand, while publishing and industrial packaging expand usage. Asia-Pacific will drive growth, with Japan and South Korea leading adoption. Europe and North America will emphasize recyclability compliance.
The transparent paper market is expanding due to rising plastic bans, consumer demand for eco-friendly packaging, and FMCG sector growth. Transparent paper offers recyclability, clarity, and lightweight protection.
Food and beverage packaging dominates adoption, while bakery, confectionery, and decorative wrapping add momentum. Increasing acceptance in e-commerce and publishing broadens applications. With global sustainability initiatives and innovations in coating performance, transparent paper is becoming a key solution for replacing plastics.
The transparent paper market is segmented by material, product type, thickness, application, end-use industry, and region. Materials include cellulose-based, wood pulp, recycled fiber, and composite transparent papers. Product types include glazed, baking, printing, and specialty papers. Thickness ranges up to 40 GSM, 41-80 GSM, and above 80 GSM. Applications span food, bakery, gift wrapping, printing, and industrial packaging. End-use industries include food, retail, publishing, and industrial sectors across all global regions.
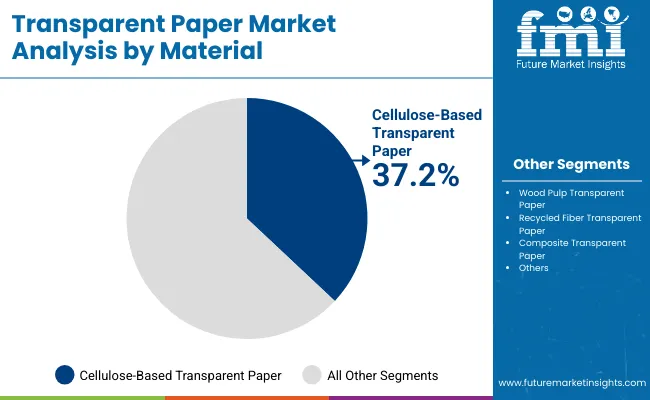
Cellulose-based transparent paper will hold 37.2% share in 2025, supported by recyclability, durability, and cost efficiency. Food and retail industries prefer it due to compliance with sustainability regulations.
Future demand will grow with improvements in barrier coatings and scalability. Adoption will expand across FMCG and industrial packaging, reinforcing cellulose-based paper as the primary material.
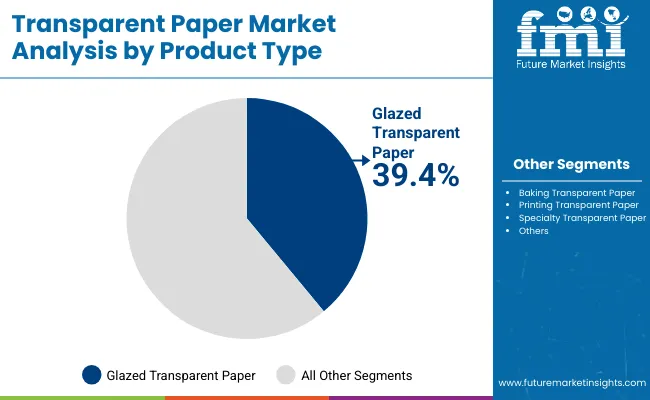
Glazed transparent paper will account for 39.4% share in 2025, reflecting its strength, clarity, and versatility. FMCG brands adopt it for bakery, confectionery, and decorative packaging.
Growth will be reinforced by food-safe coatings and innovations in high-clarity finishes. Glazed paper will remain the most widely used type, aligned with consumer packaging preferences.
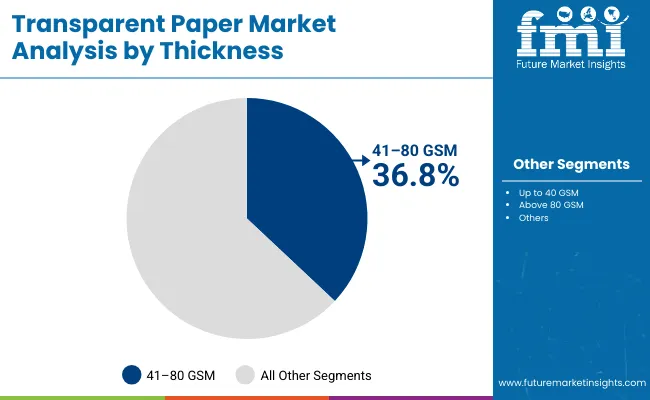
Up to 40 GSM will hold 36.8% share in 2025, reflecting demand for lightweight packaging. Retailers and FMCG companies adopt it for cost-effective wrapping.
Future adoption will rise with improved performance for food and e-commerce packaging. Lightweight formats will anchor demand through 2035.
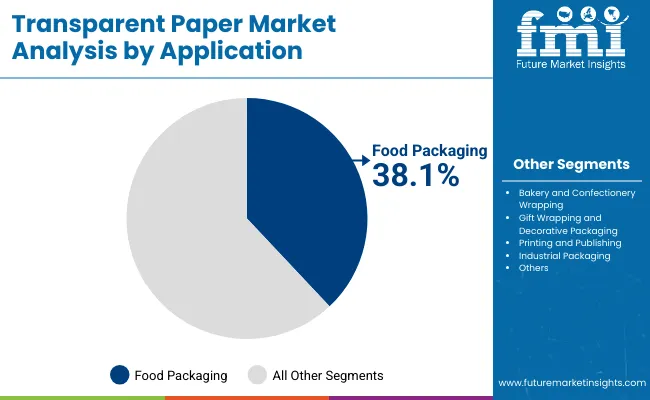
Food packaging will represent 38.1% share in 2025, driven by bakery and confectionery wrapping. FMCG growth and plastic bans reinforce adoption.
Future growth will expand with ready-to-eat meals and frozen foods. Food packaging will remain the largest application of transparent paper.
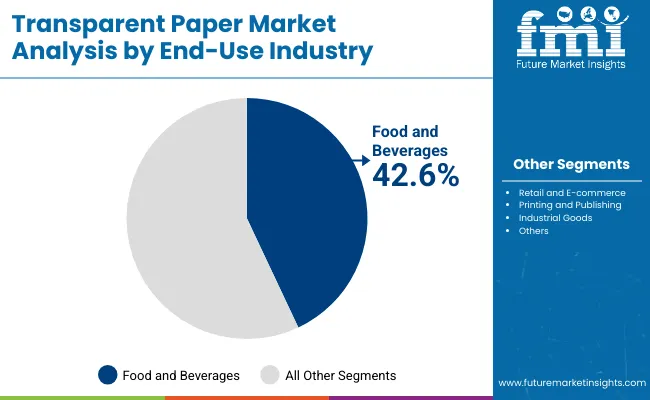
Food and beverages will account for 42.6% share in 2025, reflecting packaging scale in FMCG and retail. Sustainability mandates strengthen adoption.
By 2035, food and beverages will remain dominant, reinforced by increasing global packaged food demand.
Growth is driven by global plastic bans, FMCG expansion, and consumer preference for eco-friendly packaging. Transparent paper balances sustainability with clarity and strength.
High costs compared to plastics and limitations in moisture resistance hinder adoption. Recycling challenges in emerging regions restrict growth.
Opportunities exist in e-commerce, publishing, and specialty packaging. Food and healthcare sectors expand demand with biodegradable coatings.
Trends include water-based coatings, hybrid fiber papers, and lightweight formats. Circular economy initiatives and digital printing integration support growth.
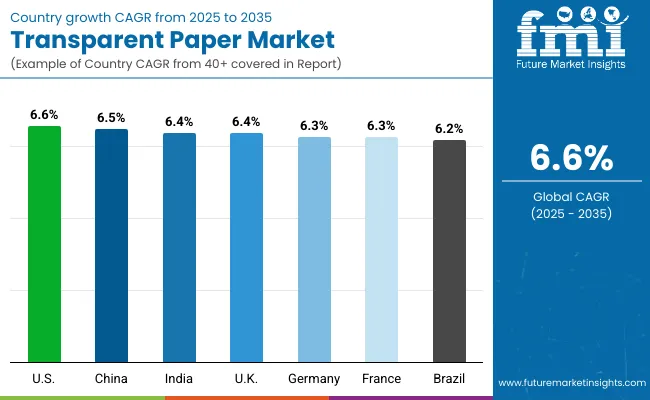
The market is expanding as FMCG growth and plastic bans align. Asia-Pacific leads adoption, while North America and Europe emphasize compliance. Emerging regions expand through food and retail packaging.
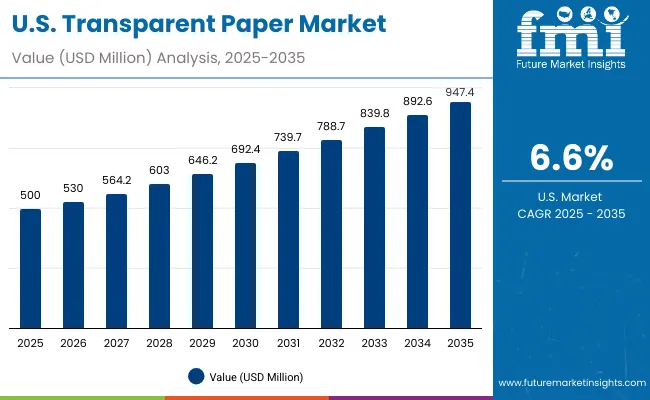
The USA will grow at 6.6% CAGR, driven by food packaging and decorative wrapping. FMCG brands adopt recyclable papers.
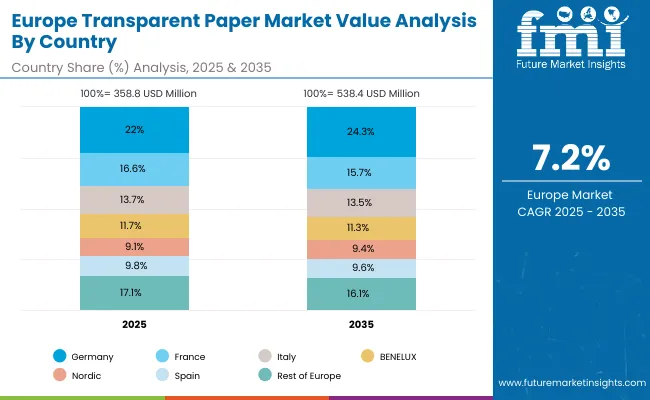
Germany will expand at 6.3% CAGR under EU recycling mandates. Bakery and retail packaging lead. Hybrid papers gain traction.
The UK will grow at 6.4% CAGR with plastic taxes. FMCG packaging dominates usage. Retailers emphasize recyclable formats.
China will expand at 6.5% CAGR, supported by FMCG packaging and decorative wrapping. Industrial packaging grows steadily.
India will grow at 6.4% CAGR with food and beverage expansion. Plastic bans reinforce adoption. Low-cost cellulose-based formats dominate.
Japan will grow at 7.1% CAGR, led by FMCG and premium packaging. Food and cosmetics boost adoption. Regulations enforce recyclability.
South Korea will lead with 7.2% CAGR, driven by FMCG and decorative packaging. Retailers emphasize recyclable solutions.
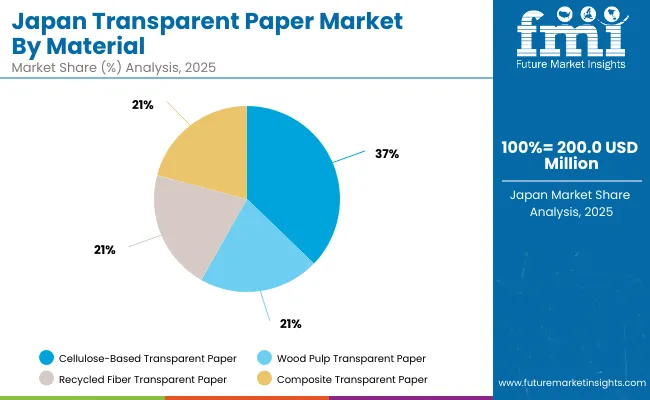
Japan’s transparent paper market, valued at USD 200 million in 2025, is led by cellulose-based transparent paper with a 37.1% share, supported by its biodegradability and recyclability. Wood pulp transparent paper follows with 26.0%, serving cost-sensitive and versatile packaging applications. Recycled fiber transparent paper holds 23.4%, aligning with Japan’s circular economy goals and strong recycling infrastructure. Composite transparent paper accounts for 13.6%, offering advanced performance benefits like higher strength and resistance. Japan’s market segmentation reflects a balance of eco-friendly innovation and industrial functionality. Growing adoption in food packaging, publishing, and retail contributes to the sustained expansion of this sector.
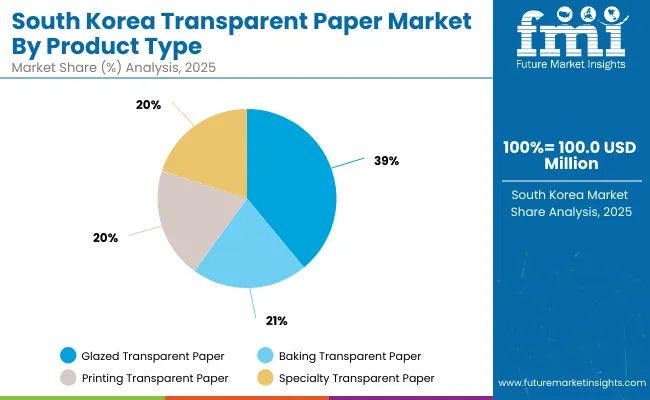
South Korea’s transparent paper market, valued at USD 100 million in 2025, is dominated by glazed transparent paper with a 40.8% share, driven by its superior finish and printing adaptability. Baking transparent paper accounts for 24.5%, benefiting from food industry expansion and rising bakery demand. Printing transparent paper holds 21.0%, serving publishing and branding-focused applications. Specialty transparent paper contributes 13.6%, applied in decorative and customized packaging formats. South Korea’s segmentation demonstrates strong integration of foodservice needs with consumer packaging trends. Regulatory support for eco-friendly paper alternatives and rising consumer interest in sustainable designs are strengthening domestic adoption rates significantly.
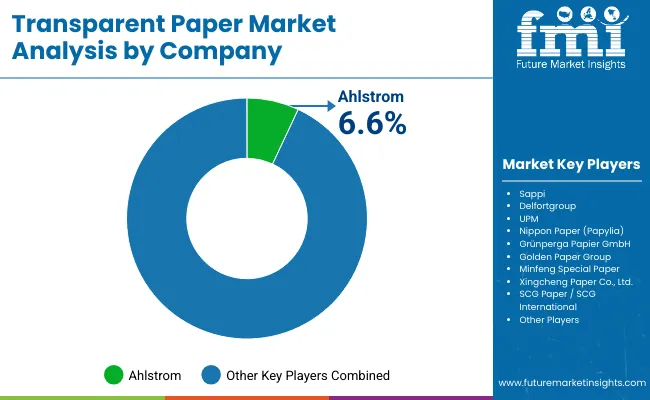
The market is moderately fragmented with key players including Ahlstrom, Sappi, Delfortgroup, UPM, Nippon Paper (Papyro), GrünenpergaPapier Group, Golden Paper Group, Minfeng Special Paper, Xincheng Paper Co., SCG Paper / SCG International. These companies focus on lightweight formats, recyclable coatings, and hybrid fiber innovations.
Ahlstrom, Sappi, and Delfortgroup dominate Europe with advanced transparent papers. Nippon Paper and UPM emphasize scalability in Asia-Pacific. Minfeng and Golden Paper strengthen presence in China. Competition centers on sustainability, cost, and clarity improvements.
Key Developments of Transparent Paper Market
| Item | Value |
|---|---|
| Quantitative Units | USD 1.5 Billion |
| By Material | Cellulose-Based, Wood Pulp, Recycled Fiber, Composite Transparent Papers |
| By Product Type | Glazed, Baking, Printing, Specialty Transparent Papers |
| By Thickness | Up to 40 GSM, 41-80 GSM, Above 80 GSM |
| By Application | Food Packaging, Bakery, Gift Wrapping, Printing, Industrial Packaging |
| By End-Use Industry | Food & Beverages, Retail, Printing & Publishing, Industrial Goods |
| Key Companies Profiled | Ahlstrom, Sappi, Delfortgroup, UPM, Nippon Paper ( Papyro ), Grünenperga Papier Group, Golden Paper Group, Minfeng Special Paper, Xincheng Paper Co., SCG Paper / SCG International |
| Additional Attributes | Growth driven by FMCG packaging, plastic bans, and recyclable materials. |
The market will be valued at USD 1.5 billion in 2025.
The market will reach USD 2.9 billion by 2035.
The market will grow at a CAGR of 6.6% during 2025-2035.
Cellulose-based transparent paper will lead with a 37.2% share in 2025.
Glazed transparent paper will dominate with a 39.4% share in 2025.


Our Research Products

The "Full Research Suite" delivers actionable market intel, deep dives on markets or technologies, so clients act faster, cut risk, and unlock growth.

The Leaderboard benchmarks and ranks top vendors, classifying them as Established Leaders, Leading Challengers, or Disruptors & Challengers.

Locates where complements amplify value and substitutes erode it, forecasting net impact by horizon

We deliver granular, decision-grade intel: market sizing, 5-year forecasts, pricing, adoption, usage, revenue, and operational KPIs—plus competitor tracking, regulation, and value chains—across 60 countries broadly.

Spot the shifts before they hit your P&L. We track inflection points, adoption curves, pricing moves, and ecosystem plays to show where demand is heading, why it is changing, and what to do next across high-growth markets and disruptive tech

Real-time reads of user behavior. We track shifting priorities, perceptions of today’s and next-gen services, and provider experience, then pace how fast tech moves from trial to adoption, blending buyer, consumer, and channel inputs with social signals (#WhySwitch, #UX).

Partner with our analyst team to build a custom report designed around your business priorities. From analysing market trends to assessing competitors or crafting bespoke datasets, we tailor insights to your needs.
Supplier Intelligence
Discovery & Profiling
Capacity & Footprint
Performance & Risk
Compliance & Governance
Commercial Readiness
Who Supplies Whom
Scorecards & Shortlists
Playbooks & Docs
Category Intelligence
Definition & Scope
Demand & Use Cases
Cost Drivers
Market Structure
Supply Chain Map
Trade & Policy
Operating Norms
Deliverables
Buyer Intelligence
Account Basics
Spend & Scope
Procurement Model
Vendor Requirements
Terms & Policies
Entry Strategy
Pain Points & Triggers
Outputs
Pricing Analysis
Benchmarks
Trends
Should-Cost
Indexation
Landed Cost
Commercial Terms
Deliverables
Brand Analysis
Positioning & Value Prop
Share & Presence
Customer Evidence
Go-to-Market
Digital & Reputation
Compliance & Trust
KPIs & Gaps
Outputs
Full Research Suite comprises of:
Market outlook & trends analysis
Interviews & case studies
Strategic recommendations
Vendor profiles & capabilities analysis
5-year forecasts
8 regions and 60+ country-level data splits
Market segment data splits
12 months of continuous data updates
DELIVERED AS:
PDF EXCEL ONLINE
Transparent Barrier Laminators Market Analysis - Size and Share Forecast Outlook 2025 to 2035
Transparent Coating Market Size and Share Forecast Outlook 2025 to 2035
Transparent Plastics Market Size and Share Forecast Outlook 2025 to 2035
Transparent Conductive Films Market Size and Share Forecast Outlook 2025 to 2035
Transparent Plastic Packaging Market Size and Share Forecast Outlook 2025 to 2035
Transparent Ceramics Market Size and Share Forecast Outlook 2025 to 2035
Transparent Display Market Size and Share Forecast Outlook 2025 to 2035
Transparent Digital Signage Market Analysis by Type, End Users and Region Through 2035
Multilayer Transparent Conductors Market Size and Share Forecast Outlook 2025 to 2035
UV-Blocking Transparent Film Market Size and Share Forecast Outlook 2025 to 2035
Paperboard Partition Market Size and Share Forecast Outlook 2025 to 2035
Paper Box Market Size and Share Forecast Outlook 2025 to 2035
Paper Edge Protector Market Size and Share Forecast Outlook 2025 to 2035
Paper Cup Lids Market Size and Share Forecast Outlook 2025 to 2035
Paper Pallet Market Size and Share Forecast Outlook 2025 to 2035
Paper and Paperboard Packaging Market Forecast and Outlook 2025 to 2035
Paper Wrap Market Size and Share Forecast Outlook 2025 to 2035
Paper Cups Market Size and Share Forecast Outlook 2025 to 2035
Paper Core Market Size and Share Forecast Outlook 2025 to 2035
Paper Bags Market Size and Share Forecast Outlook 2025 to 2035

Thank you!
You will receive an email from our Business Development Manager. Please be sure to check your SPAM/JUNK folder too.
Chat With
MaRIA