The demand for hydrogen buses in USA is valued at USD 0.5 billion in 2025 and is projected to reach USD 5.5 billion by 2035, reflecting a compound annual growth rate of 28.3%. Growth is driven by increasing interest in low-emission public transport fleets and the broader adoption of hydrogen fuel systems across mobility applications. Transit agencies are exploring hydrogen buses for their long range, fast refueling and operational reliability in varied climates. As manufacturing capacity expands and fuel cell systems become more refined, hydrogen buses gain traction in regional and urban networks. Federal and state-level programs that support fleet modernization also reinforce long-term interest, creating a demand curve shaped by steady infrastructure development and improving vehicle performance.
The growth trajectory shows a rapid and consistent rise, beginning at USD 0.1 billion in earlier years and progressing to USD 0.5 billion in 2025 before accelerating toward USD 5.5 billion by 2035. Yearly increments increase sharply as values move from USD 0.6 billion in 2026 to USD 0.7 billion in 2027, then expand to USD 1.6 billion by 2031 and USD 3.3 billion by 2033. This curve indicates strong momentum associated with growing fleet adoption and maturing supply chains for hydrogen technologies. As production volumes rise and operational data strengthens confidence among transit operators, hydrogen buses advance from limited deployment to broader fleet integration, supporting sustained growth through the forecast window.
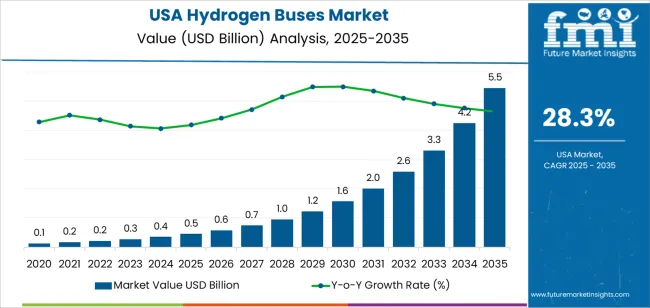
Demand in USA for hydrogen buses is projected to grow from USD 0.5 billion in 2025 to USD 5.5 billion by 2035, reflecting an approximate compound annual growth rate (CAGR) of 28.3%. Beginning at USD 0.1 billion in 2020 and reaching USD 0.5 billion by 2025, the growth trajectory accelerates sharply. By 2030 the value approaches USD 1.6 billion, and by 2035 it achieves USD 5.5 billion. The expansion is driven by increased deployment of zero emission transit fleets, government support for hydrogen infrastructure, and growing adoption of fuel cell bus technology for urban and inter city transportation.
The absolute value increase over the decade from 2025 to 2035 amounts to USD 5.0 billion. Early in the forecast period the incremental value is modest, as deployments are pilot scale and infrastructure remains limited. In later years the uplift becomes substantial as hydrogen refuelling networks expand, fleet renewals accelerate and per unit costs decline enabling larger procurements. The shift from niche to scaling creates a steep value curve, underscoring the importance of infrastructure investment, regulatory support and supply chain maturity for capturing the sizeable opportunity toward USD 5.5 billion by 2035.
| Metric | Value |
|---|---|
| Industry Value (2025) | USD 0.5 billion |
| Forecast Value (2035) | USD 5.5 billion |
| Forecast CAGR (2025 to 2035) | 28.3% |
The demand for hydrogen buses in USA is supported by public transit agencies’ push to transition to zero-emission fleets and reduce urban air pollution. Several USA states have introduced regulations requiring that new buses be zero-emission by a set date, which creates a pull for alternatives to diesel. Hydrogen fuel-cell buses offer long range and faster refuelling compared with battery electric buses, which makes them appealing for routes with heavy usage or limited downtime. This performance advantage is particularly relevant for large bus fleets in densely populated regions.
Another factor driving uptake is the expansion of refuelling infrastructure and federal funding through programs that support clean public transit. Transit operators in states such as California have placed orders for hydrogen buses and moved to develop hydrogen stations. At the same time, higher purchase cost, limited hydrogen infrastructure, and uncertainty over operating costs remain constraints. Nonetheless, given regulatory support and operational advantages, the demand for hydrogen buses in USA is expected to grow steadily as deployments scale and technology matures.
The demand for hydrogen buses in the USA is shaped by the technologies used in fuel cell systems and the applications that rely on clean, long-range transit solutions. Technologies include proton exchange membrane fuel cells, direct methanol fuel cells, phosphoric acid fuel cells, zinc-air fuel cells and solid oxide fuel cells, each offering different efficiency levels and operating characteristics. Applications span municipal transit, intercity transport, school and institutional transport and other specialized routes. These segments reflect growing interest in zero-emission fleets, where performance consistency, refuelling speed and operational range influence adoption across public and private transport networks.
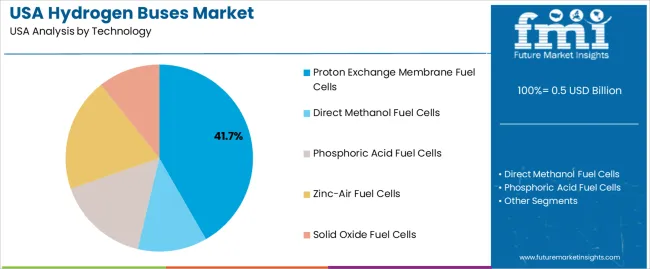
Proton exchange membrane fuel cells account for 42% of demand for hydrogen bus technologies in the USA. Their leading share reflects their ability to deliver quick start-up performance and reliable power output suited to frequent-stop routes. These fuel cells operate efficiently at lower temperatures, making them compatible with daily urban operations that require predictable performance. Transit agencies value their compact design and compatibility with existing bus chassis. Their strong energy-to-weight characteristics support long driving ranges without compromising cabin space, which reinforces consistent use across different bus models.
Demand for proton exchange membrane systems is also driven by ongoing investment in hydrogen infrastructure and fleet decarbonization programs. These fuel cells support rapid refuelling, enabling high vehicle utilization for public transport agencies. Their durability under variable load conditions makes them suitable for long-term deployment in commercial fleets. As hydrogen production expands and cities pursue cleaner bus fleets, proton exchange membrane technology continues to serve as the preferred option for operators seeking dependable, high-efficiency fuel cell solutions.
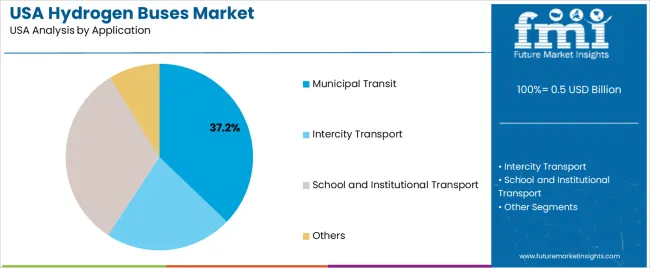
Municipal transit accounts for 37.2% of total demand for hydrogen buses in the USA. This leading position reflects the need for low-emission transport options in densely populated urban areas. Municipal transit systems prioritize buses that operate quietly, reduce local air pollution and maintain consistent service throughout long operating hours. Hydrogen buses appeal to transit authorities because they provide the extended range and quick refuelling required for demanding city routes. Their suitability for high-frequency service supports adoption across major metropolitan networks.
Demand from municipal transit is also strengthened by federal and state initiatives that encourage zero-emission bus deployment through grants and fleet transition programs. Cities incorporate hydrogen buses to meet long-term emissions targets while avoiding range limitations associated with battery-electric models. The ability to operate effectively in varied climates and maintain steady performance under passenger load further supports municipal use. As urban agencies continue expanding sustainable transport fleets, municipal transit remains the primary application driving hydrogen bus adoption in the USA.
Demand for hydrogen-fuel-cell buses in the USA is gaining momentum as transit agencies and state governments commit to zero-emission targets and seek alternatives to battery-electric buses for long-range or heavy-duty routes. Growth is underpinned by advances in fuel-cell technology, expanding hydrogen refuelling infrastructure and regulatory support for clean public transit. At the same time, higher vehicle and infrastructure costs, limited hydrogen supply chains and uncertainty around total cost of ownership pose significant obstacles. These factors together govern the pace at which hydrogen buses are adopted in American transit fleets.
In the USA, mandates that require transit agencies to transition to zero-emission buses are driving interest in hydrogen-fuel-cell buses, especially for routes that require long range, rapid refuelling or heavy loads. Regions such as California are developing hydrogen refuelling stations and piloting fuel-cell bus deployments. As infrastructure expands and fuel-cell costs decline, agencies are increasingly viewing hydrogen buses as viable complements to battery-electric alternatives. This regulatory plus infrastructure combination is a strong catalyst for hydrogen-bus uptake across the country.
Opportunities for hydrogen buses in the USA lie primarily in large urban transit fleets, school or shuttle services with high operational hours, and heavy-duty intercity or airport-service applications where long range and quick refuelling matter. Agencies in states with hydrogen production or refuelling hubs are especially poised. Manufacturers and infrastructure providers that can offer turnkey solutions for fleet deployment-inclusive of buses, fueling stations and service support-are best positioned to capture demand as more agencies plan fleet renewals aligned with clean-transit timelines.
Despite growing interest, several hurdles restrict rapid uptake of hydrogen buses in the USA. High upfront cost of fuel-cell buses and supporting hydrogen infrastructure remains a major barrier, especially compared to battery-electric models. The hydrogen refuelling network is still relatively sparse, creating operational risk for fleets. Uncertainty about fuel cost, vehicle life-cycle economics and maintenance practices also dampens decision-making. These challenges mean that hydrogen buses currently penetrate niche or pilot segments rather than full mainstream transit adoption.
| Region | CAGR (%) |
|---|---|
| West | 32.6% |
| South | 29.2% |
| Northeast | 26.0% |
| Midwest | 22.6% |
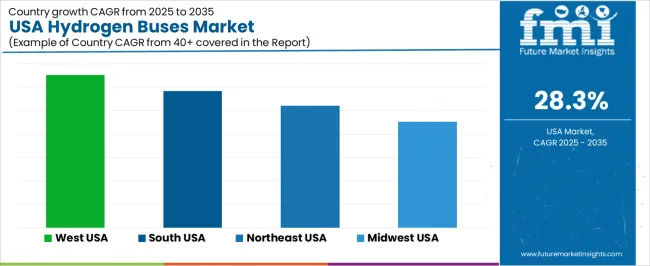
Demand for hydrogen buses in the USA is expanding rapidly across all regions, with the West leading at 32.6%. Growth in this region reflects strong state-level support for zero-emission transit fleets and active deployment programs across major cities. The South follows at 29.2%, where transit agencies are adopting hydrogen vehicles to reduce operating emissions and diversify fuel sources. The Northeast records 26.0%, driven by urban transit modernization and interest in scalable clean-energy bus fleets. The Midwest posts 22.6%, supported by regional manufacturing activity and early-stage fleet trials. Together, these regions highlight rising interest in hydrogen mobility as transit systems explore long-range, fast-refueling alternatives to battery-electric buses.
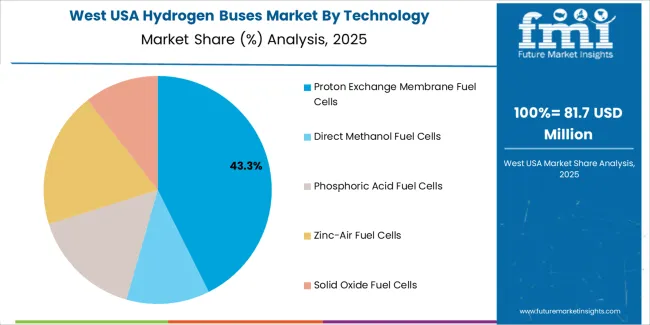
West USA is projected to grow at a CAGR of 32.6% through 2035 in demand for hydrogen buses. California and neighboring states are investing heavily in zero-emission public transport to meet environmental regulations and reduce urban pollution. Transit authorities are deploying hydrogen fuel cell buses for municipal fleets and intercity routes. Growing adoption of renewable energy infrastructure, hydrogen refueling stations, and government incentives accelerates demand. Manufacturers are producing advanced hydrogen-powered buses with longer ranges and improved performance. The region’s focus on sustainable urban mobility, clean transportation initiatives, and technological innovation supports rapid growth in hydrogen bus deployment.
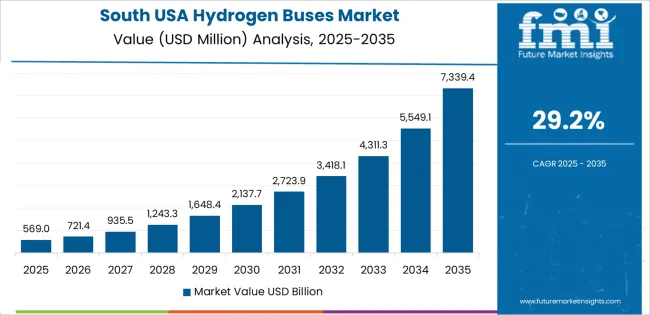
South USA is projected to grow at a CAGR of 29.2% through 2035 in demand for hydrogen buses. The region’s urban centers, including Houston and Atlanta, are integrating fuel cell buses into public transport and corporate shuttle services. Rising government incentives for low-emission vehicles, environmental compliance regulations, and fleet modernization accelerate adoption. Manufacturers are supplying hydrogen-powered buses with enhanced range, safety, and performance features. The South’s transportation authorities are emphasizing sustainable transit solutions, reducing carbon emissions, and promoting renewable hydrogen infrastructure. These trends support steady growth in hydrogen bus adoption across municipal and private fleets throughout the southern states.
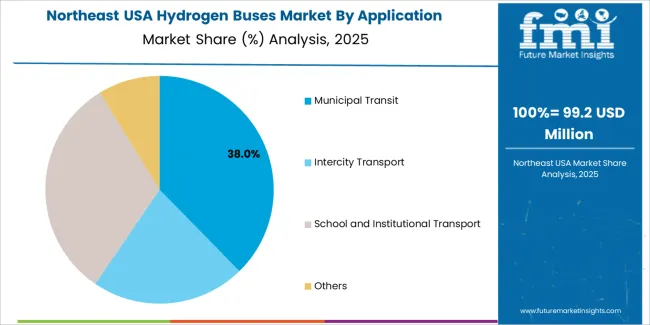
Northeast USA is projected to grow at a CAGR of 26.0% through 2035 in demand for hydrogen buses. Cities like New York and Boston are integrating hydrogen fuel cell buses into public transportation and shuttle services. The region’s focus on reducing carbon emissions, meeting regulatory standards, and modernizing fleets drives adoption. Manufacturers are supplying buses with advanced fuel cells, longer range, and improved efficiency. Transit authorities, urban planners, and fleet operators prioritize sustainable mobility solutions. Growing investment in hydrogen refueling stations and renewable energy infrastructure further supports the expansion of hydrogen-powered bus adoption throughout the Northeast region.
Midwest USA is projected to grow at a CAGR of 22.6% through 2035 in demand for hydrogen buses. Cities such as Chicago, Detroit, and Minneapolis are gradually adopting hydrogen fuel cell buses for municipal transit and corporate shuttle services. Fleet modernization, emission reduction policies, and government incentives accelerate adoption. Manufacturers are supplying durable, long-range hydrogen-powered buses optimized for urban and intercity operations. Investment in hydrogen infrastructure, including refueling stations, supports adoption. The combination of public and private initiatives, focus on sustainable transit, and technological development ensures steady growth in hydrogen bus deployment across the Midwest region.
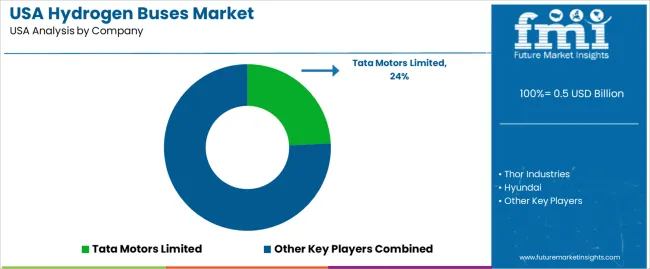
The demand for hydrogen-fuel-cell buses in the USA is driven by transit agencies seeking zero-emission alternatives to diesel fleets and battery buses. Federal and state clean-transportation mandates promote adoption of hydrogen buses for longer-range urban and regional routes. Improvements in fuel-cell technologies and expanding hydrogen refuelling infrastructure further support deployment. The emphasis on reducing air-pollution in cities and meeting climate-goals enhances interest in fuel-cell buses as viable fleet replacements. As fleet operators evaluate total life-cycle cost, hydrogen buses gain traction where high utilisation or rapid refuelling are priorities. These factors combine to raise demand within USA public-transport systems for hydrogen-powered transit vehicles.
Key players shaping the hydrogen bus segment include Tata Motors Limited, Thor Industries, Hyundai, Ballard Power Systems, NovaBus Corporation and New Flyer Industries Ltd. These companies contribute across manufacturing, fuel-cell integration and transit-system supply. Tata Motors and Hyundai develop hydrogen-bus platforms suited for large fleets. Thor Industries expands capability in commercial-vehicle sectors. Ballard Power Systems supplies fuel-cell modules that enable hydrogen-bus drivetrains. NovaBus and New Flyer serve North American transit markets, adapting hydrogen-bus models for USA operators. Their combined manufacturing, technology and market-access capacities allow them to drive deployment of hydrogen buses across the USA transportation system.
| Items | Values |
|---|---|
| Quantitative Units (2025) | USD billion |
| Technology Types | Proton Exchange Membrane Fuel Cells, Direct Methanol Fuel Cells, Phosphoric Acid Fuel Cells, Zinc-Air Fuel Cells, Solid Oxide Fuel Cells |
| Applications | Municipal Transit, Intercity Transport, School and Institutional Transport, Others |
| Power Output | <150 kW, 150-250 kW, >250 kW |
| Transit Bus Models | 30-Foot Transit Buses, 40-Foot Transit Buses, 60-Foot Transit Buses |
| Regions Covered | Northeast, West, Midwest, South |
| Countries Covered | USA |
| Key Companies Profiled | Tata Motors Limited, Thor Industries, Hyundai, Ballard Power Systems, NovaBus Corporation, New Flyer Industries Ltd |
| Additional Attributes | Dollar by sales by technology type, application, power output, and bus model; regional CAGR and adoption trends; fuel-cell efficiency and performance characteristics; hydrogen refuelling infrastructure expansion; federal and state incentives; zero-emission fleet mandates; operational cost and reliability benefits; deployment in urban, intercity, school and specialized transport; fleet modernization programs; production scaling and manufacturing capacities; lifecycle cost analysis; integration of fuel-cell modules and drivetrains; adoption in municipal, commercial, and private transit fleets. |
The global demand for hydrogen buses in USA is estimated to be valued at USD 0.5 billion in 2025.
The market size for the demand for hydrogen buses in USA is projected to reach USD 5.5 billion by 2035.
The demand for hydrogen buses in USA is expected to grow at a 28.3% CAGR between 2025 and 2035.
The key product types in demand for hydrogen buses in USA are proton exchange membrane fuel cells , direct methanol fuel cells, phosphoric acid fuel cells, zinc-air fuel cells and solid oxide fuel cells.
In terms of application, municipal transit segment to command 37.2% share in the demand for hydrogen buses in USA in 2025.


Our Research Products

The "Full Research Suite" delivers actionable market intel, deep dives on markets or technologies, so clients act faster, cut risk, and unlock growth.

The Leaderboard benchmarks and ranks top vendors, classifying them as Established Leaders, Leading Challengers, or Disruptors & Challengers.

Locates where complements amplify value and substitutes erode it, forecasting net impact by horizon

We deliver granular, decision-grade intel: market sizing, 5-year forecasts, pricing, adoption, usage, revenue, and operational KPIs—plus competitor tracking, regulation, and value chains—across 60 countries broadly.

Spot the shifts before they hit your P&L. We track inflection points, adoption curves, pricing moves, and ecosystem plays to show where demand is heading, why it is changing, and what to do next across high-growth markets and disruptive tech

Real-time reads of user behavior. We track shifting priorities, perceptions of today’s and next-gen services, and provider experience, then pace how fast tech moves from trial to adoption, blending buyer, consumer, and channel inputs with social signals (#WhySwitch, #UX).

Partner with our analyst team to build a custom report designed around your business priorities. From analysing market trends to assessing competitors or crafting bespoke datasets, we tailor insights to your needs.
Supplier Intelligence
Discovery & Profiling
Capacity & Footprint
Performance & Risk
Compliance & Governance
Commercial Readiness
Who Supplies Whom
Scorecards & Shortlists
Playbooks & Docs
Category Intelligence
Definition & Scope
Demand & Use Cases
Cost Drivers
Market Structure
Supply Chain Map
Trade & Policy
Operating Norms
Deliverables
Buyer Intelligence
Account Basics
Spend & Scope
Procurement Model
Vendor Requirements
Terms & Policies
Entry Strategy
Pain Points & Triggers
Outputs
Pricing Analysis
Benchmarks
Trends
Should-Cost
Indexation
Landed Cost
Commercial Terms
Deliverables
Brand Analysis
Positioning & Value Prop
Share & Presence
Customer Evidence
Go-to-Market
Digital & Reputation
Compliance & Trust
KPIs & Gaps
Outputs
Full Research Suite comprises of:
Market outlook & trends analysis
Interviews & case studies
Strategic recommendations
Vendor profiles & capabilities analysis
5-year forecasts
8 regions and 60+ country-level data splits
Market segment data splits
12 months of continuous data updates
DELIVERED AS:
PDF EXCEL ONLINE
USA Hydrogen Electrolyzer Market Growth - Trends & Forecast 2025 to 2035
USA Hydrogen Bus Market Growth – Innovations, Trends & Forecast 2025-2035
Hydrogen Buses Market Growth – Trends & Forecast 2025 to 2035
Demand for Hydrogen Buses in Japan Size and Share Forecast Outlook 2025 to 2035
Hydrogen Storage Tank And Transportation Market Forecast Outlook 2025 to 2035
Hydrogen Detection Market Forecast Outlook 2025 to 2035
Hydrogenated Dimer Acid Market Size and Share Forecast Outlook 2025 to 2035
Hydrogen Electrolyzer Market Size and Share Forecast Outlook 2025 to 2035
USA Medical Coding Market Size and Share Forecast Outlook 2025 to 2035
USA Labels Market Size and Share Forecast Outlook 2025 to 2035
USA Plant-based Creamers Market Size and Share Forecast Outlook 2025 to 2035
USA Barrier Coated Paper Market Size and Share Forecast Outlook 2025 to 2035
USA Electronic Health Records (EHR) Market Size and Share Forecast Outlook 2025 to 2035
USA Animal Model Market Size and Share Forecast Outlook 2025 to 2035
Hydrogen Fluoride Gas Detection Market Size and Share Forecast Outlook 2025 to 2035
Hydrogen Storage Tanks and Transportation Market Size and Share Forecast Outlook 2025 to 2035
Hydrogen Refueling Station Market Size and Share Forecast Outlook 2025 to 2035
Hydrogen Aircraft Market Size and Share Forecast Outlook 2025 to 2035
Hydrogen Peroxide Market Size and Share Forecast Outlook 2025 to 2035
USA and Canada Packer Bottle Market Size and Share Forecast Outlook 2025 to 2035

Thank you!
You will receive an email from our Business Development Manager. Please be sure to check your SPAM/JUNK folder too.
Chat With
MaRIA