The compact loader market is expanding steadily, driven by rising infrastructure development, agricultural mechanization, and demand for versatile equipment in construction and landscaping. Compact loaders offer enhanced maneuverability, high load-carrying capacity, and compatibility with multiple attachments, making them ideal for small to medium-scale operations.
Manufacturers are integrating telematics, operator comfort features, and emission-compliant engines to align with modern performance and sustainability standards. The growth of rental services and compact equipment leasing models has further improved accessibility across urban and rural regions.
As construction activities continue to surge globally, supported by smart city projects and industrial expansion, demand for compact loaders is projected to remain strong.
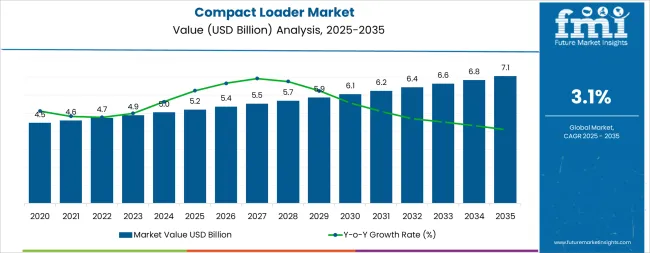
| Metric | Value |
|---|---|
| Compact Loader Market Estimated Value in (2025 E) | USD 5.4 billion |
| Compact Loader Market Forecast Value in (2035 F) | USD 7.3 billion |
| Forecast CAGR (2025 to 2035) | 3.1% |
The market is segmented by Type and Application and region. By Type, the market is divided into Compact Track Loaders, Skid Steer Loaders, Backhoe Loaders, and Wheeled Loaders. In terms of Application, the market is classified into Construction, Agriculture And Forestry, Industrial, and Utilities.
Regionally, the market is classified into North America, Latin America, Western Europe, Eastern Europe, Balkan & Baltic Countries, Russia & Belarus, Central Asia, East Asia, South Asia & Pacific, and the Middle East & Africa.
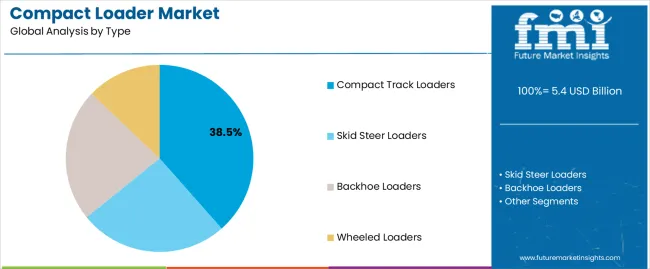
The compact track loaders segment leads the type category with approximately 38.5% share, driven by its superior traction, stability, and adaptability across varied terrains. These machines are favored for their ability to operate efficiently on soft, uneven, and muddy surfaces where wheeled alternatives face limitations.
Improved load capacity and durability of undercarriage components have enhanced productivity and service life. The segment benefits from high utilization in agriculture, landscaping, and construction, supported by quick-attach systems for diverse tool compatibility.
With ongoing product innovation and the adoption of advanced hydraulic systems, compact track loaders are expected to sustain their leading position in the market.
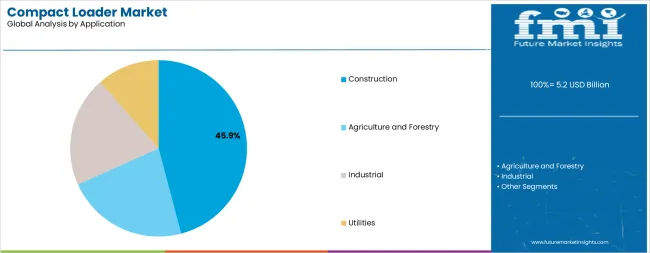
The construction segment holds approximately 45.9% share in the application category, reflecting its dominance in overall compact loader utilization. Growth in urban infrastructure, roadworks, and residential development projects has driven continuous demand for multi-functional, space-efficient machinery.
Compact loaders are valued for their ability to perform digging, grading, and material handling tasks with ease in confined job sites. The segment also benefits from strong rental fleet expansion and increased contractor preference for fuel-efficient, low-maintenance models.
With global construction activity remaining robust, the construction segment is expected to continue leading the market throughout the forecast period.
| Attributes | Details |
|---|---|
| Market Value for 2020 | USD 4,804.51 million |
| Market Value for 2025 | USD 5,112.93 million |
| Market CAGR from 2020 to 2025 | 2.5% |
The categorized market analysis of compact loaders demonstrates the supremacy of compact track loaders within the product type category. A thorough investigation shows their prevailing position, notably in the construction industry, which commands the application category.
This data highlights the high demand for compact track loaders, prompted primarily by their adaptability, flexibility, and efficiency in construction industry. These insights offer valuable guidance for compact loader providers managing market trends and dynamics.
| Leading Segment | Compact Track Loaders |
|---|---|
| Segment Share (2025) | 38.5% |
| Leading Segment | Construction |
|---|---|
| Segment Share (2025) | 45.9% |
Significant opportunities are shown by the compact loader market study, which is displayed in tables that emphasize important economies, including Australia, China, India, Germany, and the United States.
Australia shows up as a lucrative compact loader industry with tremendous potential. A detailed analysis highlights the nation's potential for strong development and investment in the industry, positioning it as a key destination for compact loader manufacturers looking to enter new markets strategically.
| Country | Australia |
|---|---|
| CAGR (2025 to 2035) | 4.7% |
| Country | China |
|---|---|
| CAGR (2025 to 2035) | 4.2% |
| Country | India |
|---|---|
| CAGR (2025 to 2035) | 4.1% |
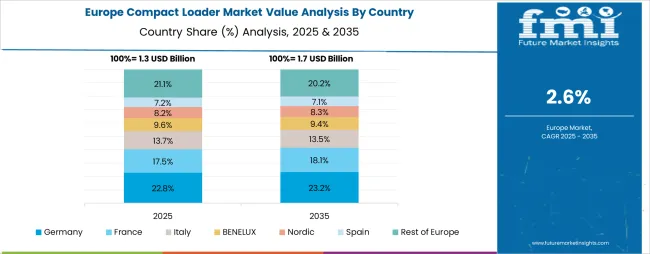
| Country | Germany |
|---|---|
| CAGR (2025 to 2035) | 2.8% |
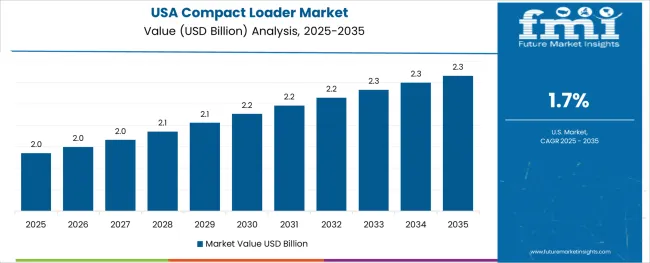
| Country | United States |
|---|---|
| CAGR (2025 to 2035) | 1.7% |
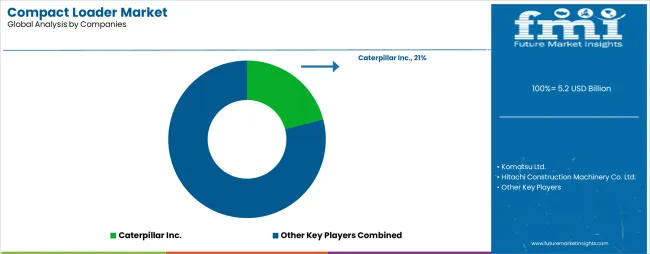
Leading compact loader manufacturers significantly influence the dynamics in the competitive landscape of the market. Caterpillar Inc. is a prominent compact loader provider because of its vast expertise and technological capabilities. Komatsu Ltd. and Bobcat Company make substantial contributions through their market presence and innovation.
Strong solutions from JCB and Volvo Construction Equipment improve the competitive environment. By showcasing their advantages, Kubota Corporation and CNH Industrial N.V. guarantee a varied market environment of compact loader. The involvement of Doosan Infracore, Liebherr Group, and Hitachi Construction Machinery Co., Ltd enhances the competitive arena.
With a constant focus on technological developments and operational efficiency, the industry remains dynamic as these major compact loader producers negotiate market trends and consumer expectations.
Noteworthy Breakthroughs
| Company | Details |
|---|---|
| Doosan Group | Doosan Group stated in December 2025 that it is going to present at CES 2025, showcasing its innovative solutions from its family of companies, which includes Doosan Bobcat, Doosan Robotics, Doosan Enerbility, and HyAxiom, for a safer and cleaner future. |
| Komatsu Ltd. | Komatsu Ltd. acquired Australian fleet management firm iVolve Holdings Pty Ltd in December 2025 to increase the range of services it offers to clients. A technology company called iVolve provides fleet management solutions to small and medium-sized mining, quarrying, and construction companies. |
| Doosan Corporation | The debut of Tobroco-Giant's new Compact Wheel Loader models, produced by the Netherlands-based company, was announced by Doosan Corporation in February 2025. |
| Liebherr International Deutschland GmbH | The new L series (L 504, L 506, and L 508) compact loader was announced by Liebherr International Deutschland GmbH in February 2025. These vehicles are more efficient than their predecessors in speed and high-lifting arms. |
| CASE Construction Equipment | The B-Series compact track loaders (CTLs) and skid steers are the products of CASE Construction Equipment's upcoming generation, which was introduced in March 2025. Nine skid steer versions and five CTL models cover vertical and radial lift patterns. |
| Komatsu Ltd. | Komatsu Ltd. introduced the WE-series wheel loader with Generation 3 hybrid technology in September 2025. It delivers robustness, adaptability, and fuel efficiency along with sustainable operation. |
| Attribute | Details |
|---|---|
| Market Name | Compact Loader Market |
| Base Year | 2025 |
| Forecast Period | 2025 to 2035 |
| Historical Period | 2020 to 2025 |
| Unit of Measurement | USD Million |
| Market Size in 2025 | USD 5.4 billion |
| Market Size in 2035 | USD 7.3 billion |
| CAGR (2025 to 2035) | 3.1% |
| Segments Covered | By Product Type, By Application, By Region |
| By Product Type | Compact Track Loaders, Skid Steer Loaders |
| By Application | Construction, Agriculture, Landscaping, Municipal Use |
| By Region | North America, Latin America, Europe, East Asia, South Asia & Pacific, Middle East & Africa |
| Top Countries Analyzed | United States, China, Germany, Japan, India, United Kingdom, France, Brazil, Italy, Canada |
| Leading Companies | Caterpillar Inc., Komatsu Ltd., Hitachi Construction Machinery Co. Ltd., Yanmar Holding Co. Ltd., Volvo Construction Equipment, Liebherr Group, Deere & Company, XCMG, Sany, Doosan Corporation, Kubota, CNH Industrial N.V., Takeuchi Mfg. Co. Ltd. |
| Customization | Available Upon Request |
The global compact loader market is estimated to be valued at USD 5.4 billion in 2025.
The market size for the compact loader market is projected to reach USD 7.3 billion by 2035.
The compact loader market is expected to grow at a 3.1% CAGR between 2025 and 2035.
The key product types in compact loader market are compact track loaders, skid steer loaders, backhoe loaders and wheeled loaders.
In terms of application, construction segment to command 45.9% share in the compact loader market in 2025.


Our Research Products

The "Full Research Suite" delivers actionable market intel, deep dives on markets or technologies, so clients act faster, cut risk, and unlock growth.

The Leaderboard benchmarks and ranks top vendors, classifying them as Established Leaders, Leading Challengers, or Disruptors & Challengers.

Locates where complements amplify value and substitutes erode it, forecasting net impact by horizon

We deliver granular, decision-grade intel: market sizing, 5-year forecasts, pricing, adoption, usage, revenue, and operational KPIs—plus competitor tracking, regulation, and value chains—across 60 countries broadly.

Spot the shifts before they hit your P&L. We track inflection points, adoption curves, pricing moves, and ecosystem plays to show where demand is heading, why it is changing, and what to do next across high-growth markets and disruptive tech

Real-time reads of user behavior. We track shifting priorities, perceptions of today’s and next-gen services, and provider experience, then pace how fast tech moves from trial to adoption, blending buyer, consumer, and channel inputs with social signals (#WhySwitch, #UX).

Partner with our analyst team to build a custom report designed around your business priorities. From analysing market trends to assessing competitors or crafting bespoke datasets, we tailor insights to your needs.
Supplier Intelligence
Discovery & Profiling
Capacity & Footprint
Performance & Risk
Compliance & Governance
Commercial Readiness
Who Supplies Whom
Scorecards & Shortlists
Playbooks & Docs
Category Intelligence
Definition & Scope
Demand & Use Cases
Cost Drivers
Market Structure
Supply Chain Map
Trade & Policy
Operating Norms
Deliverables
Buyer Intelligence
Account Basics
Spend & Scope
Procurement Model
Vendor Requirements
Terms & Policies
Entry Strategy
Pain Points & Triggers
Outputs
Pricing Analysis
Benchmarks
Trends
Should-Cost
Indexation
Landed Cost
Commercial Terms
Deliverables
Brand Analysis
Positioning & Value Prop
Share & Presence
Customer Evidence
Go-to-Market
Digital & Reputation
Compliance & Trust
KPIs & Gaps
Outputs
Full Research Suite comprises of:
Market outlook & trends analysis
Interviews & case studies
Strategic recommendations
Vendor profiles & capabilities analysis
5-year forecasts
8 regions and 60+ country-level data splits
Market segment data splits
12 months of continuous data updates
DELIVERED AS:
PDF EXCEL ONLINE
Compact Wheel Loaders Market Size and Share Forecast Outlook 2025 to 2035
Canada Compact Wheel Loader Industry Analysis Size and Share Forecast Outlook 2025 to 2035
Compact Track and Multi-Terrain Loader Market Size and Share Forecast Outlook 2025 to 2035
Lightweight Compact Wheel Loader Market Growth - Trends & Forecast 2025 to 2035
Compacted Strand Surface Contact Wire Rope Market Size and Share Forecast Outlook 2025 to 2035
Compact Rotary Actuator Market Size and Share Forecast Outlook 2025 to 2035
Compact Pneumatic Pressure Sensor Market Size and Share Forecast Outlook 2025 to 2035
Compact Resin Type Silencer Market Size and Share Forecast Outlook 2025 to 2035
Compact Construction Equipment Market Size and Share Forecast Outlook 2025 to 2035
Loader Bucket Market Size and Share Forecast Outlook 2025 to 2035
Compact Recloser Replacement Market Size and Share Forecast Outlook 2025 to 2035
Compact Pick-up Trucks Market Size and Share Forecast Outlook 2025 to 2035
Loader Bucket Attachments Market Size and Share Forecast Outlook 2025 to 2035
Compacted Graphite Iron Market Size and Share Forecast Outlook 2025 to 2035
Compact Utility Vehicles Market Growth - Trends & Forecast 2025 to 2035
Compaction Machines Market Growth - Trends & Forecast 2025 to 2035
Compact Power Equipment Rental Market Growth - Trends & Forecast 2025 to 2035
Examining Market Share Trends in Compact Construction Equipment
Compact E-Scooter Market Growth - Trends & Forecast 2024 to 2034
Compact Road Sweepers Market

Thank you!
You will receive an email from our Business Development Manager. Please be sure to check your SPAM/JUNK folder too.
Chat With
MaRIA