Aerospace DC-DC Converter Market Size, Share, and Forecast Outlook 2025 to 2035

The aerospace DC-DC converter market stands at USD 1.2 billion in 2025 and will reach USD 3.5 billion by 2035, expanding at a CAGR of 11%, corresponding to a multiplying factor of approximately 2.9x over the decade.

Analysis of the growth rate volatility index shows that the market experiences fluctuations driven by technological innovation cycles, evolving defense and commercial aerospace requirements, and regulatory adjustments. Periods of faster expansion occur when high-efficiency, lightweight converters are introduced to meet rigorous aerospace performance standards, while slower phases result from budget constraints, delayed aircraft programs, or supply chain disruptions.

Short-term disruptions, such as component shortages or changes in production schedules, can temporarily affect growth rates but do not disrupt the long-term upward trajectory. Advances in thermal management, miniaturization, and higher power density have contributed to more consistent expansion in recent years.

By 2035, as the market reaches 3.5 billion, volatility is expected to moderate due to broader adoption of advanced DC-DC converters across commercial and military aerospace applications. Recognizing these fluctuations allows manufacturers and investors to plan strategically in production, inventory, and research and development, ensuring temporary slowdowns are managed while long-term growth opportunities are captured.
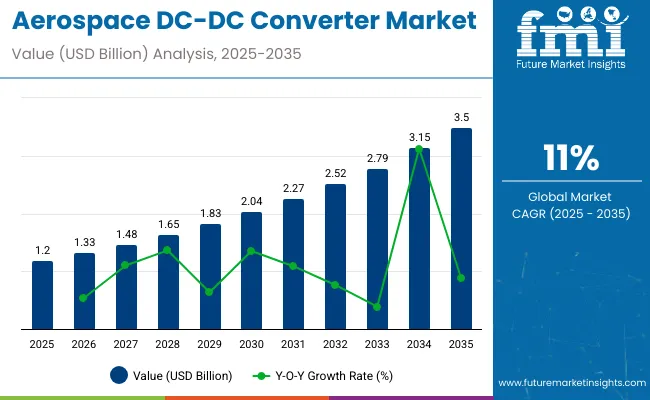
Quick stats of Aerospace DC-DC Converter Market

  • Aerospace DC-DC Converter Market Size (2025): USD 1.2 billion
  • Projected Aerospace DC-DC Converter Market Size (2035): USD 3.5 billion
  • Forecast CAGR of aerospace DC-DC Converter Market (2025-2035): 11%
  • Leading Segment of Aerospace DC-DC Converter Market (2025): Fixed wing aircraft (45% share)
  • Key Growth Regions of Aerospace DC-DC Converter Market: North America, Europe, Asia Pacific
  • Top Key Players of Aerospace DC-DC Converter Market: Eaton, Vicor, Meggitt
  • Leading Player Share of Aerospace DC-DC Converter Market (2025): Eaton - 22%

Aerospace Dc Dc Converter Market

The market is witnessing a shift towards miniaturized, energy-efficient, and thermally optimized DC-DC converters. Aerospace manufacturers are increasingly adopting converters with advanced digital control capabilities to enhance voltage stability and reduce power losses. Radiation-tolerant and high-reliability designs are gaining prominence for space-bound applications and high-altitude aviation.

Modular and scalable converter architectures are facilitating easier integration, upgrades, and retrofitting across diverse aircraft platforms. Strategic collaborations between OEMs, power electronics manufacturers, and system integrators are accelerating innovation, ensuring compliance with rigorous safety standards while supporting the transition toward hybrid-electric and electrically augmented propulsion systems.

The market is primarily underpinned by several critical sectors. Aerospace and defense avionics systems contribute approximately 42%, reflecting the essential role of converters in power management for aircraft and spacecraft. Power electronics manufacturing accounts for around 27%, encompassing the production of high-efficiency converters, voltage regulators, and isolation modules.

Aircraft and spacecraft assembly represents close to 18%, integrating these components into commercial airliners, military platforms, and unmanned systems. Certification, testing, and compliance services contribute roughly 8%, ensuring adherence to stringent aerospace standards. Lifecycle support and aftermarket services comprise the remaining 5%, covering maintenance, retrofitting, and reliability management across operational fleets.

Top Aerospace DC-DC Converter Market Dynamics

Driven by the growing electrification of avionics, flight control, and auxiliary systems. Commercial aircraft account for roughly 65% of total installations, while regional and military platforms contribute the remainder. Power ratings typically range from 50 W to 10 kW, with higher wattage units used in emergency and auxiliary systems. Replacement cycles of 8-12 years ensure predictable aftermarket demand, and North America and Europe together represent over 60% of installed units, with Asia Pacific expanding steadily as commercial aircraft production rises.

Growth Opportunity Modular and High-Efficiency Designs

Modular DC-DC converters enable integration with multiple voltage architectures, supporting both 28 V and 270 V networks commonly used in commercial and regional aircraft. Compact units reduce installation footprint by 20-25%, improving cabin and payload efficiency. High-efficiency designs lower energy losses by up to 12% and reduce thermal management requirements, which supports lighter cooling systems.

Emerging platforms like eVTOL and hybrid-electric regional aircraft are increasing demand for lightweight, reliable, and high-power-density modules. Standardized modular systems also allow faster fleet upgrades, reduce maintenance downtime, and extend lifecycle value, presenting growth opportunities across both commercial and defense aviation sectors.

Driving Force Electrification and Operational Efficiency

Electrification of aircraft systems is accelerating the adoption of DC-DC converters to replace hydraulic and pneumatic power. These converters stabilize voltage for avionics, lighting, and emergency backup systems, ensuring consistent operation under variable load.

Weight reduction of 3-5% per aircraft through higher power density modules improves fuel efficiency, while enhanced thermal designs reduce the need for additional cooling equipment. Airlines and military operators are prioritizing solid-state converters to improve reliability, redundancy, and overall system safety. Integration with advanced flight control and autopilot systems further drives the requirement for high-precision voltage regulation across a growing number of aircraft subsystems.

Emerging Trend Smart Monitoring and Connectivity

Modern DC-DC converters are increasingly integrated with intelligent power management platforms that enable real-time load monitoring and predictive diagnostics. Early detection of potential faults reduces in-service failures by 12-15% and minimizes downtime. Higher switching frequencies combined with advanced thermal dissipation allow smaller form factors without compromising efficiency.

Communication-enabled converters feed data into fleet management systems, providing analytics for maintenance scheduling and system optimization. Integration with avionics, auxiliary, and emergency systems allows coordinated power distribution, supporting electrification trends and improving overall operational safety.

Market Challenge Cost, Certification, and Supply Constraints

Advanced aerospace DC-DC converters are priced between USD 5,000 and USD 50,000 per unit, depending on power, voltage, and certification levels. Compliance with DO-160 and DO-254 standards requires extensive testing, extending development cycles by 6-9 months. High reliability requirements for thermal, vibration, and electromagnetic compatibility increase engineering complexity.

Supply chain limitations for high-grade semiconductors and magnetic materials can create lead time variability of 8-12 weeks. Fleet operators require planned replacements to maintain operational continuity, and high costs combined with certification and reliability demands continue to limit adoption among smaller manufacturers.

Analyzing Aerospace DC-DC Converter Market by Top Investment Segments

The Aerospace DC-DC Converter market is segmented by aircraft type, form factor, input voltage, output voltage, output power, output number, type, and application. Fixed wing aircraft dominate adoption due to commercial and military integration. Brick and chassis mount form factors are preferred for compact installation and thermal efficiency.

Converters with 28-75V input and 24V output are widely used in avionics and flight control. Single-output isolated converters account for the largest share, providing reliable and safe power. Manufacturers such as Vicor, TDK Lambda, and Murata focus on lightweight, high-efficiency designs with wide voltage ranges. UAVs and air taxis are gaining traction due to urban air mobility and surveillance requirements, creating growth opportunities across all segments.
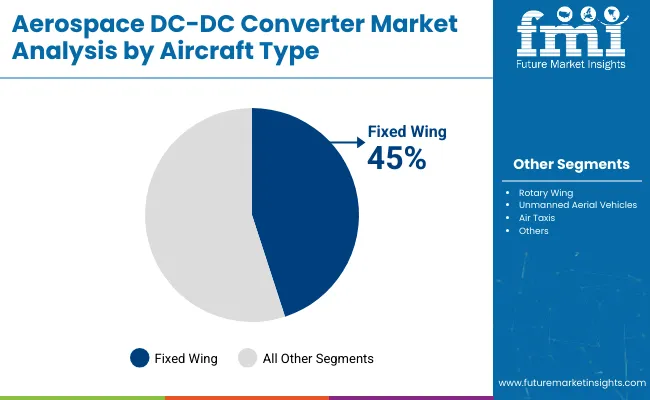
Fixed Wing Aircraft Lead Market by Aircraft Type with 45% Share

Aerospace Dc Dc Converter Market By Aircraft Type

Fixed wing aircraft hold 45% of market share as they integrate multiple DC-DC converters for avionics, navigation, flight control, and auxiliary systems. Rotary wing aircraft follow at 25%, primarily helicopters used in defense, emergency rescue, and commercial transport. UAVs account for 20%, driven by surveillance, mapping, and reconnaissance missions requiring lightweight, high-efficiency power modules.

Air taxis, emerging at 10% share, are adopting DC-DC converters for electric propulsion and onboard electronics. Manufacturers including Vicor, TDK Lambda, and Murata optimize converters for fixed wing platforms to handle higher power demands, maintain thermal stability, and reduce weight. Fixed wing adoption remains strongest in North America and Europe, supported by both civil aviation growth and military fleet modernization programs.
  • Fixed wing aircraft typically carry 15-25 DC-DC converters per airframe.
  • Rotary wing converters are designed to withstand vibration and shocks.
  • UAV converters focus on maximizing energy efficiency to extend flight duration.

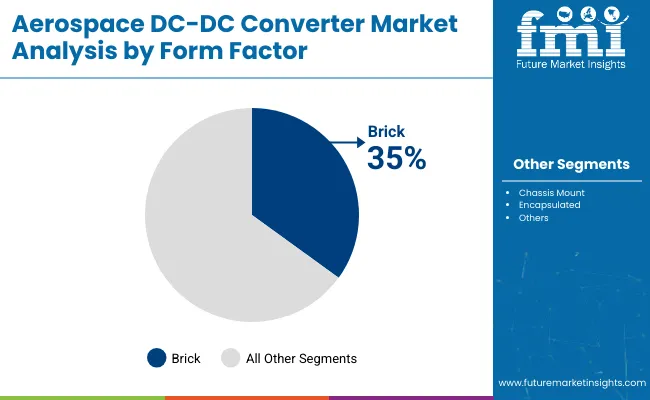
Brick Form Factor Dominates Market by Form Factor with 35% Share

Aerospace Dc Dc Converter Market By Form Factor

Brick form factor DC-DC converters lead at 35% due to compact design, efficient cooling, and flexibility in avionics rack integration. Chassis-mount units’ account for 30%, offering modular installation for commercial aircraft and industrial systems. Encapsulated converters hold 25%, valued for durability in harsh conditions such as UAVs and rotorcraft.

Brick converters provide high power density while supporting wide input voltage ranges, critical for modern fixed wing and rotary wing aircraft. Manufacturers like Murata, Vicor, and TDK Lambda focus on optimizing thermal performance, EMI suppression, and weight reduction. Demand for brick converters is driven by the need for reliable, lightweight, and efficient power modules across military, commercial, and urban air mobility applications.
  • Brick converters support power ratings from 30 W to over 1,000 W.
  • Encapsulated units enhance insulation and vibration tolerance by 20-30%.
  • Chassis mount units are preferred for industrial aircraft and surveillance systems.

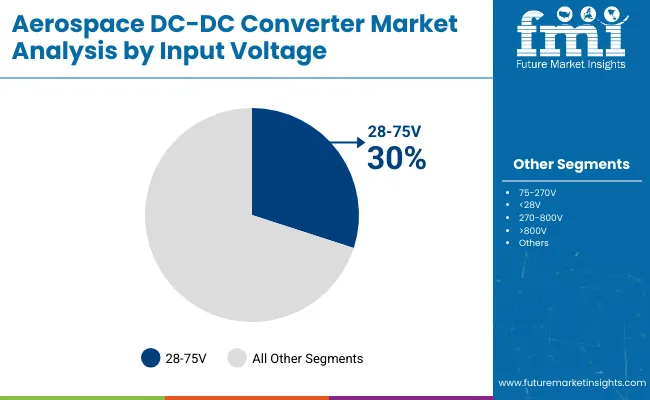
28-75V Input Converters Dominate Market by Input Voltage with 30% Share

Aerospace Dc Dc Converter Market By Input Voltage

Converters with 28-75V input voltage hold 30% of the market, offering compatibility with standard aircraft electrical systems. Units with 75-270V account for 25%, <28V at 20%, 270-800V at 15%, and >800V at 10%. Lower and mid-range input converters are widely adopted in fixed wing and rotary wing aircraft, while higher voltage units are emerging for UAVs and air taxis.

Wide input tolerance ensures stable operation under fluctuating aircraft power conditions. Manufacturers like Vicor and TDK Lambda design converters with robust EMI suppression and thermal management to operate reliably across all aerospace platforms, maintaining precise output voltage even under variable load conditions.
  • 28-75V converters power primary avionics and control electronics.
  • High-voltage units are optimized for electric propulsion in air taxis.
  • Mid-range input units are used in hybrid rotorcraft and UAVs.

24V Output Converters Dominate Market by Output Voltage with 30% Share

Aerospace Dc Dc Converter Market By Output Voltage

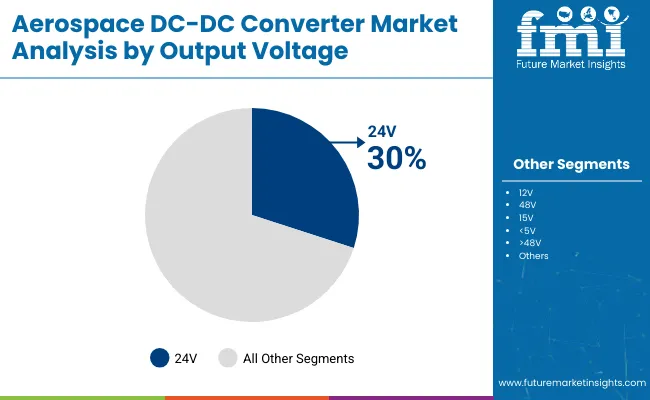
24V output converters dominate at 30% as they are compatible with most avionics, flight control, and auxiliary systems. 12V outputs follow at 25%, 48V at 20%, 15V and <5V at 10% each, and >48V at 5%. Multiple output voltages are increasingly used to supply power to sensors, communications, actuators, and energy storage systems simultaneously.

These converters must maintain stable voltage under extreme temperature, vibration, and EMI conditions. Manufacturers including Vicor, Murata, and TDK Lambda focus on producing lightweight, high-efficiency 24V converters with integrated protection features, making them the preferred choice across fixed wing, rotary wing, and UAV platforms.
  • 24V converters power critical avionics, navigation, and flight systems.
  • 12V outputs support auxiliary and backup electronics.
  • 48V units are employed in high-power UAV and electric aircraft systems.

100-250W Converters Dominate Market by Output Power with 28% Share

Aerospace Dc Dc Converter Market By Output Power

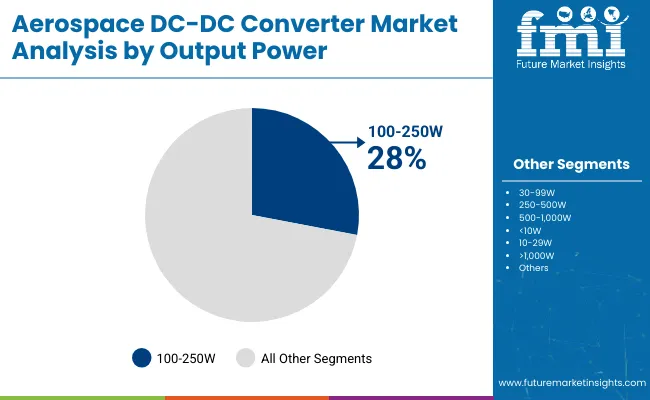
Converters rated 100-250W lead the market with 28% share, providing power for avionics, sensors, and flight control electronics. Units in the 30-99W range account for 25%, 250-500W at 20%, 500-1,000W at 15%, <10W and 10-29W at 5% each, and >1,000W at 2%. Medium-power converters balance size, weight, and efficiency, ideal for fixed wing aircraft and UAVs.

High-power units are often used in propulsion and energy storage systems, while low-power converters are suited for payload electronics. Manufacturers prioritize thermal management, efficiency, and EMI mitigation to ensure reliable operation in high-stress aerospace environments.
  • 100-250W converters are used in flight control and avionics systems.
  • High-power units (>500W) support auxiliary and propulsion electronics.
  • Low-power units (<30W) are integrated into UAV sensors and communication modules.

Single Output Converters Lead Market by Output Number with 50% Share

Aerospace Dc Dc Converter Market By Output Number

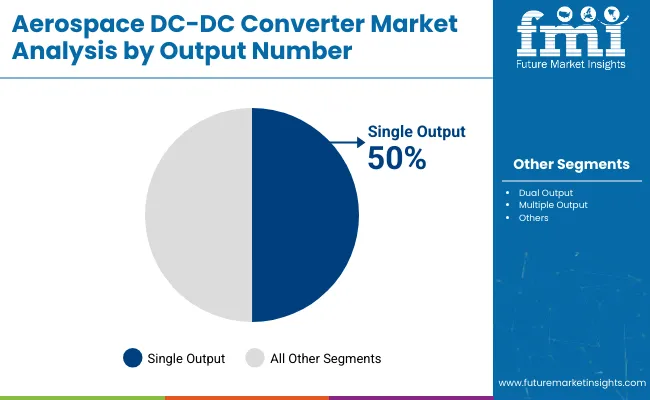
Single-output converters dominate with 50% share due to simplicity, reliability, and focused power delivery to individual avionics subsystems. Dual-output units account for 35% and multiple-output units 15%, providing simultaneous power for sensors, flight control, and communications.

UAVs and air taxis increasingly adopt dual or multiple output converters for compact, lightweight, and energy-efficient systems. Manufacturers including Vicor, TDK Lambda, and Murata design single-output converters to ensure stable voltage under variable load, with protection against thermal stress and voltage spikes. Single-output units are widely preferred for critical avionics where isolation and dedicated power are required.
  • Single-output converters are standard in avionics and flight control systems.
  • Dual-output units support redundancy in UAVs and electric aircraft.
  • Multiple-output units are used in high-density avionics racks.

Isolated Converters Dominate Market by Type with 60% Share

Aerospace Dc Dc Converter Market By Type

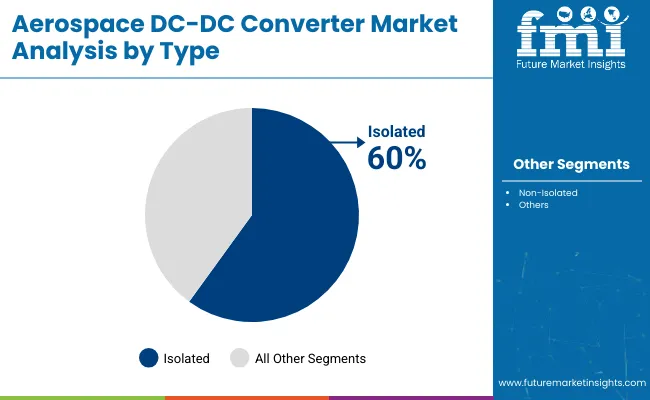
Isolated DC-DC converters lead with 60% share to provide galvanic separation between input and output, ensuring protection of sensitive avionics and flight systems. Non-isolated converters account for 40% and are used in low-risk circuits. Isolated converters reduce EMI, prevent voltage surges, and improve reliability for avionics, flight control, and surveillance systems.

Manufacturers focus on designing compact, lightweight isolated converters with wide input tolerance and high thermal stability. These units are critical for high-density avionics racks, UAV payload electronics, and urban air mobility platforms.
  • Isolation enhances safety in multi-voltage aircraft systems.
  • Non-isolated converters are used in auxiliary and backup circuits.
  • Isolated units maintain output voltage accuracy under fluctuating load conditions.

Avionics Drive Market by Application with 35% Share

Aerospace Dc Dc Converter Market By Application

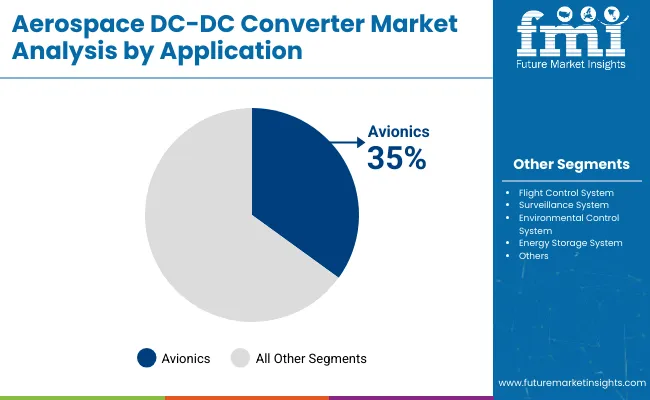
Avionics systems lead application demand at 35%, powering navigation, communication, radar, and mission-critical electronics. Flight control systems account for 25%, surveillance 15%, environmental control and energy storage 10% each. DC-DC converters must maintain precise voltage under extreme vibration, temperature, and EMI conditions. Single-output and isolated converters dominate avionics power delivery, while dual and multiple-output units support complex UAV and electric aircraft systems. Leading manufacturers such as Vicor, TDK Lambda, and Murata focus on high-efficiency, lightweight units to reduce system weight while providing reliable power in commercial, defense, and urban air mobility platforms.
  • Avionics converters maintain ±1% voltage stability.
  • Flight control systems use dual-output converters for redundancy.
  • Surveillance aircraft rely on lightweight, high-efficiency units to extend flight duration.

Top Countries Expanding, Producing, and Innovating in the Aerospace DC-DC Converter Market

Country Wise Analysis Aerospace Dc Dc Converter Market

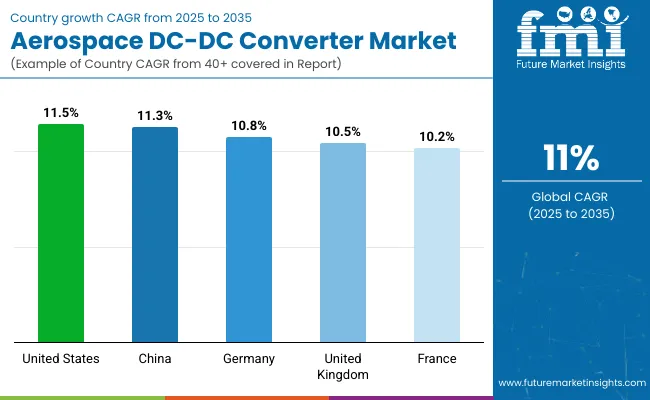
The global aerospace DC-DC converter market is growing at a CAGR of 11.0% from 2025 to 2035. The United States leads at 11.5%, +5% above the global average, driven by OECD-supported aerospace modernization, integration of advanced avionics, and increasing focus on power-efficient aircraft systems. China follows closely at 11.3%, +3% above the global rate, reflecting BRICS-led investments in aircraft electrification, expanding domestic production, and modernization of commercial and defense fleets. Germany records 10.8%, −2% under the global benchmark, with growth tempered by a mature aerospace sector and incremental adoption of new power management technologies.

The United Kingdom posts 10.5%, −5% below the global rate, influenced by steady fleet upgrades and limited scale of new aircraft programs. France stands at 10.2%, −7% under the global average, where expansion is moderated by slower replacement cycles and gradual implementation of advanced DC-DC systems. The BRICS and OECD economies show balanced growth, with the United States and China leading innovation and production.

United States Aerospace DC-DC Converter Market

The United States aerospace DC-DC converter market grows at a CAGR of 11.5%, above the global 11%, giving a multiplication factor of 1.045. Growth is supported by large-scale commercial aviation expansion, defense aircraft modernization, and increasing demand for unmanned aerial platforms.

Advanced DC-DC converters are being deployed to reduce system weight, improve thermal stability, and enhance vibration tolerance, enabling higher efficiency in both manned and unmanned aircraft. Federal and state-level investments support consistent procurement across diverse fleets. Research and development efforts are focused on increasing energy density, integrating digital diagnostics, and optimizing reliability in extreme operational conditions. By 2035, the total installed base of DC-DC converters in the United States is projected to surpass 15,000 units, securing its position as a leading global market.

  • Military aircraft modernization deployed over 2,500 converters
  • Commercial aircraft retrofits added 1,800 high-efficiency units
  • Thermal management optimization applied to 65% of units

China Aerospace DC-DC Converter Market

The demand of aerospace DC-DC converter in China grows at 11.3% CAGR, slightly above the global 11%, resulting in a multiplication factor of 1.027. Growth is driven by expanding domestic commercial aircraft production, defense fleet upgrades, and regional aerospace export demand.

The market emphasizes high-performance converters designed to be compact, lightweight, and vibration-resistant, supporting both civil and defense aircraft platforms. Manufacturers prioritize reliability testing, thermal efficiency improvements, and compliance with international aerospace standards. China has emerged as a major supplier to Asia-Pacific defense programs, exporting advanced converters while scaling domestic installations. By 2035, the installed base is expected to exceed 12,500 units, with ongoing R&D focusing on enhanced energy density, reduced weight, and automated power management solutions across new aircraft models.

  • Civil aircraft integrated over 1,200 converters
  • Export shipments to defense programs increased by 15%
  • Reliability testing expanded to enhance operational performance

Germany Aerospace DC-DC Converter Market

The aerospace DC-DC converter market in Germany grows at 10.8% CAGR, slightly below the global 11%, with a multiplication factor of 0.982. Growth is driven by high-performance requirements in commercial airliners, UAVs, and defense platforms, where precision, thermal efficiency, and compact designs are critical. Manufacturers emphasize miniaturized converters with vibration and electromagnetic compatibility, supporting safe operation in demanding aerospace environments.

Production for both new builds and retrofitted platforms continues steadily, with contracts spanning European aerospace programs and specialized UAV deployments. By 2035, Germany is projected to supply over 10,000 converters, balancing domestic demand and exports, while R&D efforts enhance energy density, thermal management, and operational reliability across high-performance platforms.

  • Produced over 1,100 units for commercial and military platforms
  • Vibration-resistant systems applied to 70% of retrofitted units
  • R&D prioritized electromagnetic compatibility and thermal performance

United Kingdom Aerospace DC-DC Converter Market

The United Kingdom aerospace DC-DC converter market grows at a CAGR of 10.5%, below the global 11%, resulting in a multiplication factor of 0.955. Market expansion is concentrated on UAVs, rotary-wing aircraft, and urban air mobility platforms requiring compact, reliable, and high-energy-density converters.

The UK market emphasizes miniaturization, thermal management, and integration into both civil and defense fleets. Manufacturers focus on optimizing weight, improving operational efficiency, and meeting strict aviation safety standards. By 2035, over 8,500 platforms in the UK are expected to feature advanced DC-DC converters, with ongoing R&D enhancing performance, reliability, and suitability for diverse operational conditions, including unmanned and experimental aircraft applications.

  • Installed base includes 950 units across military and civil platforms
  • Compact UAV converters represent 40% of production
  • Energy density improvements applied to 60% of units

France Aerospace DC-DC Converter Market

The aerospace DC-DC converter market grows at 10.2% CAGR, slightly below the global 11%, with a multiplication factor of 0.927. Growth is supported by regional jet programs, defense aircraft, and satellite applications, emphasizing lightweight, thermally efficient, and vibration-resistant converters.

French manufacturers are enhancing multifunctional designs and standardization across civil and defense applications, while collaborative projects within Europe optimize platform compatibility. By 2035, the installed base is expected to exceed 7,500 units, with hybrid and electric aerospace platforms contributing to adoption. Advanced R&D focuses on improving converter energy density, thermal performance, and operational reliability, ensuring that France maintains a competitive position in European aerospace power management systems.
  • Produced 880 units for civil, defense, and satellite platforms
  • Thermal optimization applied to 55% of units
  • Cross-industry collaboration driving European standardization

Leading Aerospace DC-DC Converter Manufacturers, Suppliers, Distributors

Aerospace Dc Dc Converter Market By Company

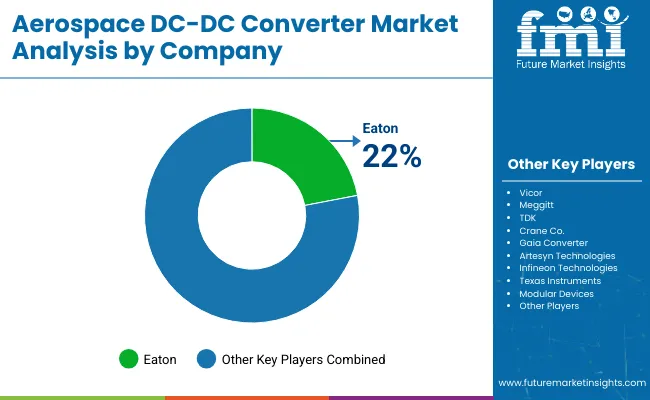
The market is dominated by established global companies and specialized suppliers focusing on high-reliability, lightweight, and high-efficiency power solutions for aircraft and defense applications. Eaton is considered the assumed market leader, due to its extensive portfolio of aerospace-grade converters, long-standing OEM partnerships, and investment in compact, high-efficiency designs suitable for commercial and military aircraft. Vicor and Meggitt follow closely, offering modular and scalable power conversion systems, often integrated into avionics and onboard electronics for next-generation aircraft. TDK and Crane Co. focus on designing converters with high thermal tolerance and voltage stability, catering to stringent aerospace standards.

Other key players are shaping the market with targeted innovations and regional strategies. Artesyn Technologies and Gaia Converter emphasize lightweight and high-efficiency DC-DC modules for commercial aviation, while Infineon Technologies and Texas Instruments provide high-reliability semiconductor solutions that enhance converter performance.

Modular Devices, AJ's Power Source, Tame-Power, Bel Power Solutions, Lone Star Aviation, VPT Inc., Advanced Energy, and Avionics Instrument focus on niche applications, customized designs, and integration support for aerospace and defense clients. These strategies, including R&D, product launches, and OEM collaborations, enable companies to maintain competitive positions in the aerospace DC-DC converter market globally.

Leading Players

  • Eaton
  • Vicor
  • Meggitt
  • TDK
  • Crane Co.
  • Gaia Converter
  • Artesyn Technologies
  • Infineon Technologies
  • Texas Instruments
  • Modular Devices

Report Scope

Report Attributes Details
Market Size (2025) USD 1.2 billion
Projected Market Size (2035) USD 3.5 billion
CAGR (2025 to 2035) 11%
Base Year for Estimation 2024
Historical Period 2020 to 2024
Projection Period 2025 to 2035
Quantitative Units USD billion for value, units for volume where applicable
Aircraft Types Analyzed Fixed Wing, Rotary Wing, Unmanned Aerial Vehicles (UAVs), Air Taxis
Form Factors Analyzed Chassis Mount, Encapsulated, Brick, Others
Input Voltage Segments <28V, 28-75V, 75-270V, 270-800V, >800V
Output Voltage Segments <5V, 12V, 15V, 24V, 48V, >48V
Output Power Segments <10W, 10-29W, 30-99W, 100-250W, 250-500W, 500-1,000W, >1,000W
Output Number Segments Single Output, Dual Output, Multiple Output
Type Segments Isolated, Non-Isolated
Application Segments Avionics, Flight Control System, Surveillance System, Environmental Control System, Energy Storage System, Others
Regions Covered North America, Europe, Asia-Pacific, Latin America, Middle East & Africa
Countries Covered United States, Canada, Brazil, Mexico, Germany, United Kingdom, France, Italy, Spain, China, Japan, India, South Korea, Australia, UAE, Saudi Arabia, South Africa
Leading Players Eaton, Vicor, Meggitt, TDK, Crane Co., Gaia Converter, Artesyn Technologies, Infineon Technologies, Texas Instruments, Modular Devices
Additional Attributes Dollar sales by converter type and aircraft platform, demand dynamics across commercial, military, and space applications, regional adoption trends across North America, Europe, and Asia-Pacific, innovation in high-efficiency, lightweight, and radiation-hardened designs, environmental impact of energy efficiency and material usage, emerging use cases in electric propulsion, avionics power management, and satellite systems

Key Segments

By Aircraft Type:

  • Fixed Wing
  • Rotary Wing
  • Unmanned Aerial Vehicles
  • Air Taxis

By Form Factor:

  • Chassis Mount
  • Encapsulated
  • Brick
  • Others

By Input Voltage:

  • <28V
  • 28-75V
  • 75-270V
  • 270-800V
  • >800V

By Output Voltage:

  • <5V
  • 12V
  • 15V
  • 24V
  • 48V
  • >48V

By Output Power:

  • <10W
  • 10-29W
  • 30-99W
  • 100-250W
  • 250-500W
  • 500-1,000W
  • >1,000W

By Output Number:

  • Single Output
  • Dual Output
  • Multiple Output

By Type:

  • Isolated
  • Non-Isolated

By Application:

  • Avionics
  • Flight Control System
  • Surveillance System
  • Environmental Control System
  • Energy Storage System
  • Others

By Region:

  • North America
  • Latin America
  • Europe
  • Asia Pacific
  • Middle East & Africa (MEA)

Table of Content

  1. Executive Summary
    • Global Market Outlook
    • Demand-side Trends
    • Supply-side Trends
    • Technology Roadmap Analysis
    • Analysis and Recommendations
  2. Market Overview
    • Market Coverage / Taxonomy
    • Market Definition / Scope / Limitations
  3. Market Background
    • Market Dynamics
      • Drivers
      • Restraints
      • Opportunity
      • Trends
    • Scenario Forecast
      • Demand in Optimistic Scenario
      • Demand in Likely Scenario
      • Demand in Conservative Scenario
    • Opportunity Map Analysis
    • Product Life Cycle Analysis
    • Supply Chain Analysis
      • Supply Side Participants and their Roles
        • Producers
        • Mid-Level Participants (Traders/ Agents/ Brokers)
        • Wholesalers and Distributors
      • Value Added and Value Created at Node in the Supply Chain
      • List of Raw Material Suppliers
      • List of Existing and Potential Buyer’s
    • Investment Feasibility Matrix
    • Value Chain Analysis
      • Profit Margin Analysis
      • Wholesalers and Distributors
      • Retailers
    • PESTLE and Porter’s Analysis
    • Regulatory Landscape
      • By Key Regions
      • By Key Countries
    • Regional Parent Market Outlook
    • Production and Consumption Statistics
    • Import and Export Statistics
  4. Global Market Analysis 2020-2024 and Forecast, 2025-2035
    • Historical Market Size Value (USD Billion) & Volume (Thousand Units) Analysis, 2020-2024
    • Current and Future Market Size Value (USD Billion) & Volume (Thousand Units) Projections, 2025-2035
      • Y-o-Y Growth Trend Analysis
      • Absolute $ Opportunity Analysis
  5. Global Market Pricing Analysis 2020-2024 and Forecast 2025-2035
  6. Global Market Analysis 2020-2024 and Forecast 2025-2035, By Aircraft Type
    • Introduction / Key Findings
    • Historical Market Size Value (USD Billion) & Volume (Thousand Units) Analysis By Aircraft Type, 2020-2024
    • Current and Future Market Size Value (USD Billion) & Volume (Thousand Units) Analysis and Forecast By Aircraft Type, 2025-2035
      • Fixed Wing
      • Rotary Wing
      • Unmanned Aerial Vehicles
      • Air Taxis
    • Y-o-Y Growth Trend Analysis By Aircraft Type, 2020-2024
    • Absolute $ Opportunity Analysis By Aircraft Type, 2025-2035
  7. Global Market Analysis 2020-2024 and Forecast 2025-2035, By Form Factor
    • Introduction / Key Findings
    • Historical Market Size Value (USD Billion) & Volume (Thousand Units) Analysis By Form Factor, 2020-2024
    • Current and Future Market Size Value (USD Billion) & Volume (Thousand Units) Analysis and Forecast By Form Factor, 2025-2035
      • Brick
      • Chassis Mount
      • Encapsulated
      • Others
    • Y-o-Y Growth Trend Analysis By Form Factor, 2020-2024
    • Absolute $ Opportunity Analysis By Form Factor, 2025-2035
  8. Global Market Analysis 2020-2024 and Forecast 2025-2035, By Input Voltage
    • Introduction / Key Findings
    • Historical Market Size Value (USD Billion) & Volume (Thousand Units) Analysis By Input Voltage, 2020-2024
    • Current and Future Market Size Value (USD Billion) & Volume (Thousand Units) Analysis and Forecast By Input Voltage, 2025-2035
      • 28-75V
      • 75-270V
      • <28V
      • 270-800V
      • >800V
    • Y-o-Y Growth Trend Analysis By Input Voltage, 2020-2024
    • Absolute $ Opportunity Analysis By Input Voltage, 2025-2035
  9. Global Market Analysis 2020-2024 and Forecast 2025-2035, By Output Voltage
    • Introduction / Key Findings
    • Historical Market Size Value (USD Billion) & Volume (Thousand Units) Analysis By Output Voltage, 2020-2024
    • Current and Future Market Size Value (USD Billion) & Volume (Thousand Units) Analysis and Forecast By Output Voltage, 2025-2035
      • 24V
      • 12V
      • 48V
      • 15V
      • <5V
      • >48V
    • Y-o-Y Growth Trend Analysis By Output Voltage, 2020-2024
    • Absolute $ Opportunity Analysis By Output Voltage, 2025-2035
  10. Global Market Analysis 2020-2024 and Forecast 2025-2035, By Output Power
    • Introduction / Key Findings
    • Historical Market Size Value (USD Billion) & Volume (Thousand Units) Analysis By Output Power, 2020-2024
    • Current and Future Market Size Value (USD Billion) & Volume (Thousand Units) Analysis and Forecast By Output Power, 2025-2035
      • 100-250W
      • 30-99W
      • 250-500W
      • 500-1,000W
      • <10W
      • 10-29W
      • >1,000W
    • Y-o-Y Growth Trend Analysis By Output Power, 2020-2024
    • Absolute $ Opportunity Analysis By Output Power, 2025-2035
  11. Global Market Analysis 2020-2024 and Forecast 2025-2035, By Output Number
    • Introduction / Key Findings
    • Historical Market Size Value (USD Billion) & Volume (Thousand Units) Analysis By Output Number, 2020-2024
    • Current and Future Market Size Value (USD Billion) & Volume (Thousand Units) Analysis and Forecast By Output Number, 2025-2035
      • Single Output
      • Dual Output
      • Multiple Output
    • Y-o-Y Growth Trend Analysis By Output Number, 2020-2024
    • Absolute $ Opportunity Analysis By Output Number, 2025-2035
  12. Global Market Analysis 2020-2024 and Forecast 2025-2035, By Type
    • Introduction / Key Findings
    • Historical Market Size Value (USD Billion) & Volume (Thousand Units) Analysis By Type, 2020-2024
    • Current and Future Market Size Value (USD Billion) & Volume (Thousand Units) Analysis and Forecast By Type, 2025-2035
      • Isolated
      • Non-Isolated
    • Y-o-Y Growth Trend Analysis By Type, 2020-2024
    • Absolute $ Opportunity Analysis By Type, 2025-2035
  13. Global Market Analysis 2020-2024 and Forecast 2025-2035, By Region
    • Introduction
    • Historical Market Size Value (USD Billion) & Volume (Thousand Units) Analysis By Region, 2020-2024
    • Current Market Size Value (USD Billion) & Volume (Thousand Units) Analysis and Forecast By Region, 2025-2035
      • North America
      • Latin America
      • Western Europe
      • Eastern Europe
      • East Asia
      • South Asia & Pacific
      • Middle East and Africa
    • Market Attractiveness Analysis By Region
  14. North America Market Analysis 2020-2024 and Forecast 2025-2035, By Country
    • Historical Market Size Value (USD Billion) & Volume (Thousand Units) Trend Analysis By Market Taxonomy, 2020-2024
    • Market Size Value (USD Billion) & Volume (Thousand Units) Forecast By Market Taxonomy, 2025-2035
      • By Country
        • USA
        • Canada
        • Mexico
      • By Aircraft Type
      • By Form Factor
      • By Input Voltage
      • By Output Voltage
      • By Output Power
      • By Output Number
      • By Type
    • Market Attractiveness Analysis
      • By Country
      • By Aircraft Type
      • By Form Factor
      • By Input Voltage
      • By Output Voltage
      • By Output Power
      • By Output Number
      • By Type
    • Key Takeaways
  15. Latin America Market Analysis 2020-2024 and Forecast 2025-2035, By Country
    • Historical Market Size Value (USD Billion) & Volume (Thousand Units) Trend Analysis By Market Taxonomy, 2020-2024
    • Market Size Value (USD Billion) & Volume (Thousand Units) Forecast By Market Taxonomy, 2025-2035
      • By Country
        • Brazil
        • Argentina
        • Rest of LATAM
      • By Aircraft Type
      • By Form Factor
      • By Input Voltage
      • By Output Voltage
      • By Output Power
      • By Output Number
      • By Type
    • Market Attractiveness Analysis
      • By Country
      • By Aircraft Type
      • By Form Factor
      • By Input Voltage
      • By Output Voltage
      • By Output Power
      • By Output Number
      • By Type
    • Key Takeaways
  16. Western Europe Market Analysis 2020-2024 and Forecast 2025-2035, By Country
    • Historical Market Size Value (USD Billion) & Volume (Thousand Units) Trend Analysis By Market Taxonomy, 2020-2024
    • Market Size Value (USD Billion) & Volume (Thousand Units) Forecast By Market Taxonomy, 2025-2035
      • By Country
        • Germany
        • Italy
        • France
        • UK
        • Spain
        • BENELUX
        • Nordic
        • Rest of W.Europe
      • By Aircraft Type
      • By Form Factor
      • By Input Voltage
      • By Output Voltage
      • By Output Power
      • By Output Number
      • By Type
    • Market Attractiveness Analysis
      • By Country
      • By Aircraft Type
      • By Form Factor
      • By Input Voltage
      • By Output Voltage
      • By Output Power
      • By Output Number
      • By Type
    • Key Takeaways
  17. Eastern Europe Market Analysis 2020-2024 and Forecast 2025-2035, By Country
    • Historical Market Size Value (USD Billion) & Volume (Thousand Units) Trend Analysis By Market Taxonomy, 2020-2024
    • Market Size Value (USD Billion) & Volume (Thousand Units) Forecast By Market Taxonomy, 2025-2035
      • By Country
        • Russia
        • Hungary
        • Poland
        • Balkan & Baltics
        • Rest of E. Europe
      • By Aircraft Type
      • By Form Factor
      • By Input Voltage
      • By Output Voltage
      • By Output Power
      • By Output Number
      • By Type
    • Market Attractiveness Analysis
      • By Country
      • By Aircraft Type
      • By Form Factor
      • By Input Voltage
      • By Output Voltage
      • By Output Power
      • By Output Number
      • By Type
    • Key Takeaways
  18. East Asia Market Analysis 2020-2024 and Forecast 2025-2035, By Country
    • Historical Market Size Value (USD Billion) & Volume (Thousand Units) Trend Analysis By Market Taxonomy, 2020-2024
    • Market Size Value (USD Billion) & Volume (Thousand Units) Forecast By Market Taxonomy, 2025-2035
      • By Country
        • China
        • Japan
        • South Korea
      • By Aircraft Type
      • By Form Factor
      • By Input Voltage
      • By Output Voltage
      • By Output Power
      • By Output Number
      • By Type
    • Market Attractiveness Analysis
      • By Country
      • By Aircraft Type
      • By Form Factor
      • By Input Voltage
      • By Output Voltage
      • By Output Power
      • By Output Number
      • By Type
    • Key Takeaways
  19. South Asia & Pacific Market Analysis 2020-2024 and Forecast 2025-2035, By Country
    • Historical Market Size Value (USD Billion) & Volume (Thousand Units) Trend Analysis By Market Taxonomy, 2020-2024
    • Market Size Value (USD Billion) & Volume (Thousand Units) Forecast By Market Taxonomy, 2025-2035
      • By Country
        • India
        • Australia & New Zealand
        • ASEAN
        • Rest of SAP
      • By Aircraft Type
      • By Form Factor
      • By Input Voltage
      • By Output Voltage
      • By Output Power
      • By Output Number
      • By Type
    • Market Attractiveness Analysis
      • By Country
      • By Aircraft Type
      • By Form Factor
      • By Input Voltage
      • By Output Voltage
      • By Output Power
      • By Output Number
      • By Type
    • Key Takeaways
  20. Middle East and Africa Market Analysis 2020-2024 and Forecast 2025-2035, By Country
    • Historical Market Size Value (USD Billion) & Volume (Thousand Units) Trend Analysis By Market Taxonomy, 2020-2024
    • Market Size Value (USD Billion) & Volume (Thousand Units) Forecast By Market Taxonomy, 2025-2035
      • By Country
        • GCC Countries
        • Northern Africa
        • South Africa
        • Turkiye
        • Rest of MEA
      • By Aircraft Type
      • By Form Factor
      • By Input Voltage
      • By Output Voltage
      • By Output Power
      • By Output Number
      • By Type
    • Market Attractiveness Analysis
      • By Country
      • By Aircraft Type
      • By Form Factor
      • By Input Voltage
      • By Output Voltage
      • By Output Power
      • By Output Number
      • By Type
    • Key Takeaways
  21. Key Countries Market Analysis
    • USA
      • Pricing Analysis
      • Market Share Analysis, 2024
        • By Aircraft Type
        • By Form Factor
        • By Input Voltage
        • By Output Voltage
        • By Output Power
        • By Output Number
        • By Type
    • Canada
      • Pricing Analysis
      • Market Share Analysis, 2024
        • By Aircraft Type
        • By Form Factor
        • By Input Voltage
        • By Output Voltage
        • By Output Power
        • By Output Number
        • By Type
    • Brazil
      • Pricing Analysis
      • Market Share Analysis, 2024
        • By Aircraft Type
        • By Form Factor
        • By Input Voltage
        • By Output Voltage
        • By Output Power
        • By Output Number
        • By Type
    • Mexico
      • Pricing Analysis
      • Market Share Analysis, 2024
        • By Aircraft Type
        • By Form Factor
        • By Input Voltage
        • By Output Voltage
        • By Output Power
        • By Output Number
        • By Type
    • Argentina
      • Pricing Analysis
      • Market Share Analysis, 2024
        • By Aircraft Type
        • By Form Factor
        • By Input Voltage
        • By Output Voltage
        • By Output Power
        • By Output Number
        • By Type
  22. Market Structure Analysis
    • Competition Dashboard
    • Competition Benchmarking
    • Market Share Analysis of Top Players
      • By Regional
      • By Aircraft Type
      • By Form Factor
      • By Input Voltage
      • By Output Voltage
      • By Output Power
      • By Output Number
      • By Type
  23. Competition Analysis
    • Competition Deep Dive
      • Eaton
        • Overview
        • Product Portfolio
        • Profitability by Market Segments (Product/Age /Sales Channel/Region)
        • Sales Footprint
        • Strategy Overview
          • Marketing Strategy
          • Product Strategy
          • Channel Strategy
      • Vicor
        • Overview
        • Product Portfolio
        • Profitability by Market Segments (Product/Age /Sales Channel/Region)
        • Sales Footprint
        • Strategy Overview
          • Marketing Strategy
          • Product Strategy
          • Channel Strategy
      • Meggitt
        • Overview
        • Product Portfolio
        • Profitability by Market Segments (Product/Age /Sales Channel/Region)
        • Sales Footprint
        • Strategy Overview
          • Marketing Strategy
          • Product Strategy
          • Channel Strategy
      • TDK
        • Overview
        • Product Portfolio
        • Profitability by Market Segments (Product/Age /Sales Channel/Region)
        • Sales Footprint
        • Strategy Overview
          • Marketing Strategy
          • Product Strategy
          • Channel Strategy
      • Crane Co.
        • Overview
        • Product Portfolio
        • Profitability by Market Segments (Product/Age /Sales Channel/Region)
        • Sales Footprint
        • Strategy Overview
          • Marketing Strategy
          • Product Strategy
          • Channel Strategy
      • Gaia Converter
        • Overview
        • Product Portfolio
        • Profitability by Market Segments (Product/Age /Sales Channel/Region)
        • Sales Footprint
        • Strategy Overview
          • Marketing Strategy
          • Product Strategy
          • Channel Strategy
      • Artesyn Technologies
        • Overview
        • Product Portfolio
        • Profitability by Market Segments (Product/Age /Sales Channel/Region)
        • Sales Footprint
        • Strategy Overview
          • Marketing Strategy
          • Product Strategy
          • Channel Strategy
      • Infineon Technologies
        • Overview
        • Product Portfolio
        • Profitability by Market Segments (Product/Age /Sales Channel/Region)
        • Sales Footprint
        • Strategy Overview
          • Marketing Strategy
          • Product Strategy
          • Channel Strategy
      • Texas Instruments
        • Overview
        • Product Portfolio
        • Profitability by Market Segments (Product/Age /Sales Channel/Region)
        • Sales Footprint
        • Strategy Overview
          • Marketing Strategy
          • Product Strategy
          • Channel Strategy
      • Modular Devices
        • Overview
        • Product Portfolio
        • Profitability by Market Segments (Product/Age /Sales Channel/Region)
        • Sales Footprint
        • Strategy Overview
          • Marketing Strategy
          • Product Strategy
          • Channel Strategy
  24. Assumptions & Acronyms Used
  25. Research Methodology

List of Tables

  • Table 1: Global Market Value (USD Billion) Forecast by Region, 2020-2035
  • Table 2: Global Market Volume (Thousand Units) Forecast by Region, 2020-2035
  • Table 3: Global Market Value (USD Billion) Forecast by Aircraft Type, 2020-2035
  • Table 4: Global Market Volume (Thousand Units) Forecast by Aircraft Type, 2020-2035
  • Table 5: Global Market Value (USD Billion) Forecast by Form Factor, 2020-2035
  • Table 6: Global Market Volume (Thousand Units) Forecast by Form Factor, 2020-2035
  • Table 7: Global Market Value (USD Billion) Forecast by Input Voltage, 2020-2035
  • Table 8: Global Market Volume (Thousand Units) Forecast by Input Voltage, 2020-2035
  • Table 9: Global Market Value (USD Billion) Forecast by Output Voltage, 2020-2035
  • Table 10: Global Market Volume (Thousand Units) Forecast by Output Voltage, 2020-2035
  • Table 11: Global Market Value (USD Billion) Forecast by Output Power, 2020-2035
  • Table 12: Global Market Volume (Thousand Units) Forecast by Output Power, 2020-2035
  • Table 13: Global Market Value (USD Billion) Forecast by Output Number, 2020-2035
  • Table 14: Global Market Volume (Thousand Units) Forecast by Output Number, 2020-2035
  • Table 15: Global Market Value (USD Billion) Forecast by Type, 2020-2035
  • Table 16: Global Market Volume (Thousand Units) Forecast by Type, 2020-2035
  • Table 17: North America Market Value (USD Billion) Forecast by Country, 2020-2035
  • Table 18: North America Market Volume (Thousand Units) Forecast by Country, 2020-2035
  • Table 19: North America Market Value (USD Billion) Forecast by Aircraft Type, 2020-2035
  • Table 20: North America Market Volume (Thousand Units) Forecast by Aircraft Type, 2020-2035
  • Table 21: North America Market Value (USD Billion) Forecast by Form Factor, 2020-2035
  • Table 22: North America Market Volume (Thousand Units) Forecast by Form Factor, 2020-2035
  • Table 23: North America Market Value (USD Billion) Forecast by Input Voltage, 2020-2035
  • Table 24: North America Market Volume (Thousand Units) Forecast by Input Voltage, 2020-2035
  • Table 25: North America Market Value (USD Billion) Forecast by Output Voltage, 2020-2035
  • Table 26: North America Market Volume (Thousand Units) Forecast by Output Voltage, 2020-2035
  • Table 27: North America Market Value (USD Billion) Forecast by Output Power, 2020-2035
  • Table 28: North America Market Volume (Thousand Units) Forecast by Output Power, 2020-2035
  • Table 29: North America Market Value (USD Billion) Forecast by Output Number, 2020-2035
  • Table 30: North America Market Volume (Thousand Units) Forecast by Output Number, 2020-2035
  • Table 31: North America Market Value (USD Billion) Forecast by Type, 2020-2035
  • Table 32: North America Market Volume (Thousand Units) Forecast by Type, 2020-2035
  • Table 33: Latin America Market Value (USD Billion) Forecast by Country, 2020-2035
  • Table 34: Latin America Market Volume (Thousand Units) Forecast by Country, 2020-2035
  • Table 35: Latin America Market Value (USD Billion) Forecast by Aircraft Type, 2020-2035
  • Table 36: Latin America Market Volume (Thousand Units) Forecast by Aircraft Type, 2020-2035
  • Table 37: Latin America Market Value (USD Billion) Forecast by Form Factor, 2020-2035
  • Table 38: Latin America Market Volume (Thousand Units) Forecast by Form Factor, 2020-2035
  • Table 39: Latin America Market Value (USD Billion) Forecast by Input Voltage, 2020-2035
  • Table 40: Latin America Market Volume (Thousand Units) Forecast by Input Voltage, 2020-2035
  • Table 41: Latin America Market Value (USD Billion) Forecast by Output Voltage, 2020-2035
  • Table 42: Latin America Market Volume (Thousand Units) Forecast by Output Voltage, 2020-2035
  • Table 43: Latin America Market Value (USD Billion) Forecast by Output Power, 2020-2035
  • Table 44: Latin America Market Volume (Thousand Units) Forecast by Output Power, 2020-2035
  • Table 45: Latin America Market Value (USD Billion) Forecast by Output Number, 2020-2035
  • Table 46: Latin America Market Volume (Thousand Units) Forecast by Output Number, 2020-2035
  • Table 47: Latin America Market Value (USD Billion) Forecast by Type, 2020-2035
  • Table 48: Latin America Market Volume (Thousand Units) Forecast by Type, 2020-2035
  • Table 49: Western Europe Market Value (USD Billion) Forecast by Country, 2020-2035
  • Table 50: Western Europe Market Volume (Thousand Units) Forecast by Country, 2020-2035
  • Table 51: Western Europe Market Value (USD Billion) Forecast by Aircraft Type, 2020-2035
  • Table 52: Western Europe Market Volume (Thousand Units) Forecast by Aircraft Type, 2020-2035
  • Table 53: Western Europe Market Value (USD Billion) Forecast by Form Factor, 2020-2035
  • Table 54: Western Europe Market Volume (Thousand Units) Forecast by Form Factor, 2020-2035
  • Table 55: Western Europe Market Value (USD Billion) Forecast by Input Voltage, 2020-2035
  • Table 56: Western Europe Market Volume (Thousand Units) Forecast by Input Voltage, 2020-2035
  • Table 57: Western Europe Market Value (USD Billion) Forecast by Output Voltage, 2020-2035
  • Table 58: Western Europe Market Volume (Thousand Units) Forecast by Output Voltage, 2020-2035
  • Table 59: Western Europe Market Value (USD Billion) Forecast by Output Power, 2020-2035
  • Table 60: Western Europe Market Volume (Thousand Units) Forecast by Output Power, 2020-2035
  • Table 61: Western Europe Market Value (USD Billion) Forecast by Output Number, 2020-2035
  • Table 62: Western Europe Market Volume (Thousand Units) Forecast by Output Number, 2020-2035
  • Table 63: Western Europe Market Value (USD Billion) Forecast by Type, 2020-2035
  • Table 64: Western Europe Market Volume (Thousand Units) Forecast by Type, 2020-2035
  • Table 65: Eastern Europe Market Value (USD Billion) Forecast by Country, 2020-2035
  • Table 66: Eastern Europe Market Volume (Thousand Units) Forecast by Country, 2020-2035
  • Table 67: Eastern Europe Market Value (USD Billion) Forecast by Aircraft Type, 2020-2035
  • Table 68: Eastern Europe Market Volume (Thousand Units) Forecast by Aircraft Type, 2020-2035
  • Table 69: Eastern Europe Market Value (USD Billion) Forecast by Form Factor, 2020-2035
  • Table 70: Eastern Europe Market Volume (Thousand Units) Forecast by Form Factor, 2020-2035
  • Table 71: Eastern Europe Market Value (USD Billion) Forecast by Input Voltage, 2020-2035
  • Table 72: Eastern Europe Market Volume (Thousand Units) Forecast by Input Voltage, 2020-2035
  • Table 73: Eastern Europe Market Value (USD Billion) Forecast by Output Voltage, 2020-2035
  • Table 74: Eastern Europe Market Volume (Thousand Units) Forecast by Output Voltage, 2020-2035
  • Table 75: Eastern Europe Market Value (USD Billion) Forecast by Output Power, 2020-2035
  • Table 76: Eastern Europe Market Volume (Thousand Units) Forecast by Output Power, 2020-2035
  • Table 77: Eastern Europe Market Value (USD Billion) Forecast by Output Number, 2020-2035
  • Table 78: Eastern Europe Market Volume (Thousand Units) Forecast by Output Number, 2020-2035
  • Table 79: Eastern Europe Market Value (USD Billion) Forecast by Type, 2020-2035
  • Table 80: Eastern Europe Market Volume (Thousand Units) Forecast by Type, 2020-2035
  • Table 81: East Asia Market Value (USD Billion) Forecast by Country, 2020-2035
  • Table 82: East Asia Market Volume (Thousand Units) Forecast by Country, 2020-2035
  • Table 83: East Asia Market Value (USD Billion) Forecast by Aircraft Type, 2020-2035
  • Table 84: East Asia Market Volume (Thousand Units) Forecast by Aircraft Type, 2020-2035
  • Table 85: East Asia Market Value (USD Billion) Forecast by Form Factor, 2020-2035
  • Table 86: East Asia Market Volume (Thousand Units) Forecast by Form Factor, 2020-2035
  • Table 87: East Asia Market Value (USD Billion) Forecast by Input Voltage, 2020-2035
  • Table 88: East Asia Market Volume (Thousand Units) Forecast by Input Voltage, 2020-2035
  • Table 89: East Asia Market Value (USD Billion) Forecast by Output Voltage, 2020-2035
  • Table 90: East Asia Market Volume (Thousand Units) Forecast by Output Voltage, 2020-2035
  • Table 91: East Asia Market Value (USD Billion) Forecast by Output Power, 2020-2035
  • Table 92: East Asia Market Volume (Thousand Units) Forecast by Output Power, 2020-2035
  • Table 93: East Asia Market Value (USD Billion) Forecast by Output Number, 2020-2035
  • Table 94: East Asia Market Volume (Thousand Units) Forecast by Output Number, 2020-2035
  • Table 95: East Asia Market Value (USD Billion) Forecast by Type, 2020-2035
  • Table 96: East Asia Market Volume (Thousand Units) Forecast by Type, 2020-2035
  • Table 97: South Asia & Pacific Market Value (USD Billion) Forecast by Country, 2020-2035
  • Table 98: South Asia & Pacific Market Volume (Thousand Units) Forecast by Country, 2020-2035
  • Table 99: South Asia & Pacific Market Value (USD Billion) Forecast by Aircraft Type, 2020-2035
  • Table 100: South Asia & Pacific Market Volume (Thousand Units) Forecast by Aircraft Type, 2020-2035
  • Table 101: South Asia & Pacific Market Value (USD Billion) Forecast by Form Factor, 2020-2035
  • Table 102: South Asia & Pacific Market Volume (Thousand Units) Forecast by Form Factor, 2020-2035
  • Table 103: South Asia & Pacific Market Value (USD Billion) Forecast by Input Voltage, 2020-2035
  • Table 104: South Asia & Pacific Market Volume (Thousand Units) Forecast by Input Voltage, 2020-2035
  • Table 105: South Asia & Pacific Market Value (USD Billion) Forecast by Output Voltage, 2020-2035
  • Table 106: South Asia & Pacific Market Volume (Thousand Units) Forecast by Output Voltage, 2020-2035
  • Table 107: South Asia & Pacific Market Value (USD Billion) Forecast by Output Power, 2020-2035
  • Table 108: South Asia & Pacific Market Volume (Thousand Units) Forecast by Output Power, 2020-2035
  • Table 109: South Asia & Pacific Market Value (USD Billion) Forecast by Output Number, 2020-2035
  • Table 110: South Asia & Pacific Market Volume (Thousand Units) Forecast by Output Number, 2020-2035
  • Table 111: South Asia & Pacific Market Value (USD Billion) Forecast by Type, 2020-2035
  • Table 112: South Asia & Pacific Market Volume (Thousand Units) Forecast by Type, 2020-2035
  • Table 113: Middle East and Africa Market Value (USD Billion) Forecast by Country, 2020-2035
  • Table 114: Middle East and Africa Market Volume (Thousand Units) Forecast by Country, 2020-2035
  • Table 115: Middle East and Africa Market Value (USD Billion) Forecast by Aircraft Type, 2020-2035
  • Table 116: Middle East and Africa Market Volume (Thousand Units) Forecast by Aircraft Type, 2020-2035
  • Table 117: Middle East and Africa Market Value (USD Billion) Forecast by Form Factor, 2020-2035
  • Table 118: Middle East and Africa Market Volume (Thousand Units) Forecast by Form Factor, 2020-2035
  • Table 119: Middle East and Africa Market Value (USD Billion) Forecast by Input Voltage, 2020-2035
  • Table 120: Middle East and Africa Market Volume (Thousand Units) Forecast by Input Voltage, 2020-2035
  • Table 121: Middle East and Africa Market Value (USD Billion) Forecast by Output Voltage, 2020-2035
  • Table 122: Middle East and Africa Market Volume (Thousand Units) Forecast by Output Voltage, 2020-2035
  • Table 123: Middle East and Africa Market Value (USD Billion) Forecast by Output Power, 2020-2035
  • Table 124: Middle East and Africa Market Volume (Thousand Units) Forecast by Output Power, 2020-2035
  • Table 125: Middle East and Africa Market Value (USD Billion) Forecast by Output Number, 2020-2035
  • Table 126: Middle East and Africa Market Volume (Thousand Units) Forecast by Output Number, 2020-2035
  • Table 127: Middle East and Africa Market Value (USD Billion) Forecast by Type, 2020-2035
  • Table 128: Middle East and Africa Market Volume (Thousand Units) Forecast by Type, 2020-2035

List of Figures

  • Figure 1: Global Market Volume (Thousand Units) Forecast 2020-2035
  • Figure 2: Global Market Pricing Analysis
  • Figure 3: Global Market Value (USD Billion) Forecast 2020-2035
  • Figure 4: Global Market Value Share and BPS Analysis by Aircraft Type, 2025 and 2035
  • Figure 5: Global Market Y-o-Y Growth Comparison by Aircraft Type, 2025-2035
  • Figure 6: Global Market Attractiveness Analysis by Aircraft Type
  • Figure 7: Global Market Value Share and BPS Analysis by Form Factor, 2025 and 2035
  • Figure 8: Global Market Y-o-Y Growth Comparison by Form Factor, 2025-2035
  • Figure 9: Global Market Attractiveness Analysis by Form Factor
  • Figure 10: Global Market Value Share and BPS Analysis by Input Voltage, 2025 and 2035
  • Figure 11: Global Market Y-o-Y Growth Comparison by Input Voltage, 2025-2035
  • Figure 12: Global Market Attractiveness Analysis by Input Voltage
  • Figure 13: Global Market Value Share and BPS Analysis by Output Voltage, 2025 and 2035
  • Figure 14: Global Market Y-o-Y Growth Comparison by Output Voltage, 2025-2035
  • Figure 15: Global Market Attractiveness Analysis by Output Voltage
  • Figure 16: Global Market Value Share and BPS Analysis by Output Power, 2025 and 2035
  • Figure 17: Global Market Y-o-Y Growth Comparison by Output Power, 2025-2035
  • Figure 18: Global Market Attractiveness Analysis by Output Power
  • Figure 19: Global Market Value Share and BPS Analysis by Output Number, 2025 and 2035
  • Figure 20: Global Market Y-o-Y Growth Comparison by Output Number, 2025-2035
  • Figure 21: Global Market Attractiveness Analysis by Output Number
  • Figure 22: Global Market Value Share and BPS Analysis by Type, 2025 and 2035
  • Figure 23: Global Market Y-o-Y Growth Comparison by Type, 2025-2035
  • Figure 24: Global Market Attractiveness Analysis by Type
  • Figure 25: Global Market Value (USD Billion) Share and BPS Analysis by Region, 2025 and 2035
  • Figure 26: Global Market Y-o-Y Growth Comparison by Region, 2025-2035
  • Figure 27: Global Market Attractiveness Analysis by Region
  • Figure 28: North America Market Incremental $ Opportunity, 2025-2035
  • Figure 29: Latin America Market Incremental $ Opportunity, 2025-2035
  • Figure 30: Western Europe Market Incremental $ Opportunity, 2025-2035
  • Figure 31: Eastern Europe Market Incremental $ Opportunity, 2025-2035
  • Figure 32: East Asia Market Incremental $ Opportunity, 2025-2035
  • Figure 33: South Asia & Pacific Market Incremental $ Opportunity, 2025-2035
  • Figure 34: Middle East and Africa Market Incremental $ Opportunity, 2025-2035
  • Figure 35: North America Market Value Share and BPS Analysis by Country, 2025 and 2035
  • Figure 36: North America Market Value Share and BPS Analysis by Aircraft Type, 2025 and 2035
  • Figure 37: North America Market Y-o-Y Growth Comparison by Aircraft Type, 2025-2035
  • Figure 38: North America Market Attractiveness Analysis by Aircraft Type
  • Figure 39: North America Market Value Share and BPS Analysis by Form Factor, 2025 and 2035
  • Figure 40: North America Market Y-o-Y Growth Comparison by Form Factor, 2025-2035
  • Figure 41: North America Market Attractiveness Analysis by Form Factor
  • Figure 42: North America Market Value Share and BPS Analysis by Input Voltage, 2025 and 2035
  • Figure 43: North America Market Y-o-Y Growth Comparison by Input Voltage, 2025-2035
  • Figure 44: North America Market Attractiveness Analysis by Input Voltage
  • Figure 45: North America Market Value Share and BPS Analysis by Output Voltage, 2025 and 2035
  • Figure 46: North America Market Y-o-Y Growth Comparison by Output Voltage, 2025-2035
  • Figure 47: North America Market Attractiveness Analysis by Output Voltage
  • Figure 48: North America Market Value Share and BPS Analysis by Output Power, 2025 and 2035
  • Figure 49: North America Market Y-o-Y Growth Comparison by Output Power, 2025-2035
  • Figure 50: North America Market Attractiveness Analysis by Output Power
  • Figure 51: North America Market Value Share and BPS Analysis by Output Number, 2025 and 2035
  • Figure 52: North America Market Y-o-Y Growth Comparison by Output Number, 2025-2035
  • Figure 53: North America Market Attractiveness Analysis by Output Number
  • Figure 54: North America Market Value Share and BPS Analysis by Type, 2025 and 2035
  • Figure 55: North America Market Y-o-Y Growth Comparison by Type, 2025-2035
  • Figure 56: North America Market Attractiveness Analysis by Type
  • Figure 57: Latin America Market Value Share and BPS Analysis by Country, 2025 and 2035
  • Figure 58: Latin America Market Value Share and BPS Analysis by Aircraft Type, 2025 and 2035
  • Figure 59: Latin America Market Y-o-Y Growth Comparison by Aircraft Type, 2025-2035
  • Figure 60: Latin America Market Attractiveness Analysis by Aircraft Type
  • Figure 61: Latin America Market Value Share and BPS Analysis by Form Factor, 2025 and 2035
  • Figure 62: Latin America Market Y-o-Y Growth Comparison by Form Factor, 2025-2035
  • Figure 63: Latin America Market Attractiveness Analysis by Form Factor
  • Figure 64: Latin America Market Value Share and BPS Analysis by Input Voltage, 2025 and 2035
  • Figure 65: Latin America Market Y-o-Y Growth Comparison by Input Voltage, 2025-2035
  • Figure 66: Latin America Market Attractiveness Analysis by Input Voltage
  • Figure 67: Latin America Market Value Share and BPS Analysis by Output Voltage, 2025 and 2035
  • Figure 68: Latin America Market Y-o-Y Growth Comparison by Output Voltage, 2025-2035
  • Figure 69: Latin America Market Attractiveness Analysis by Output Voltage
  • Figure 70: Latin America Market Value Share and BPS Analysis by Output Power, 2025 and 2035
  • Figure 71: Latin America Market Y-o-Y Growth Comparison by Output Power, 2025-2035
  • Figure 72: Latin America Market Attractiveness Analysis by Output Power
  • Figure 73: Latin America Market Value Share and BPS Analysis by Output Number, 2025 and 2035
  • Figure 74: Latin America Market Y-o-Y Growth Comparison by Output Number, 2025-2035
  • Figure 75: Latin America Market Attractiveness Analysis by Output Number
  • Figure 76: Latin America Market Value Share and BPS Analysis by Type, 2025 and 2035
  • Figure 77: Latin America Market Y-o-Y Growth Comparison by Type, 2025-2035
  • Figure 78: Latin America Market Attractiveness Analysis by Type
  • Figure 79: Western Europe Market Value Share and BPS Analysis by Country, 2025 and 2035
  • Figure 80: Western Europe Market Value Share and BPS Analysis by Aircraft Type, 2025 and 2035
  • Figure 81: Western Europe Market Y-o-Y Growth Comparison by Aircraft Type, 2025-2035
  • Figure 82: Western Europe Market Attractiveness Analysis by Aircraft Type
  • Figure 83: Western Europe Market Value Share and BPS Analysis by Form Factor, 2025 and 2035
  • Figure 84: Western Europe Market Y-o-Y Growth Comparison by Form Factor, 2025-2035
  • Figure 85: Western Europe Market Attractiveness Analysis by Form Factor
  • Figure 86: Western Europe Market Value Share and BPS Analysis by Input Voltage, 2025 and 2035
  • Figure 87: Western Europe Market Y-o-Y Growth Comparison by Input Voltage, 2025-2035
  • Figure 88: Western Europe Market Attractiveness Analysis by Input Voltage
  • Figure 89: Western Europe Market Value Share and BPS Analysis by Output Voltage, 2025 and 2035
  • Figure 90: Western Europe Market Y-o-Y Growth Comparison by Output Voltage, 2025-2035
  • Figure 91: Western Europe Market Attractiveness Analysis by Output Voltage
  • Figure 92: Western Europe Market Value Share and BPS Analysis by Output Power, 2025 and 2035
  • Figure 93: Western Europe Market Y-o-Y Growth Comparison by Output Power, 2025-2035
  • Figure 94: Western Europe Market Attractiveness Analysis by Output Power
  • Figure 95: Western Europe Market Value Share and BPS Analysis by Output Number, 2025 and 2035
  • Figure 96: Western Europe Market Y-o-Y Growth Comparison by Output Number, 2025-2035
  • Figure 97: Western Europe Market Attractiveness Analysis by Output Number
  • Figure 98: Western Europe Market Value Share and BPS Analysis by Type, 2025 and 2035
  • Figure 99: Western Europe Market Y-o-Y Growth Comparison by Type, 2025-2035
  • Figure 100: Western Europe Market Attractiveness Analysis by Type
  • Figure 101: Eastern Europe Market Value Share and BPS Analysis by Country, 2025 and 2035
  • Figure 102: Eastern Europe Market Value Share and BPS Analysis by Aircraft Type, 2025 and 2035
  • Figure 103: Eastern Europe Market Y-o-Y Growth Comparison by Aircraft Type, 2025-2035
  • Figure 104: Eastern Europe Market Attractiveness Analysis by Aircraft Type
  • Figure 105: Eastern Europe Market Value Share and BPS Analysis by Form Factor, 2025 and 2035
  • Figure 106: Eastern Europe Market Y-o-Y Growth Comparison by Form Factor, 2025-2035
  • Figure 107: Eastern Europe Market Attractiveness Analysis by Form Factor
  • Figure 108: Eastern Europe Market Value Share and BPS Analysis by Input Voltage, 2025 and 2035
  • Figure 109: Eastern Europe Market Y-o-Y Growth Comparison by Input Voltage, 2025-2035
  • Figure 110: Eastern Europe Market Attractiveness Analysis by Input Voltage
  • Figure 111: Eastern Europe Market Value Share and BPS Analysis by Output Voltage, 2025 and 2035
  • Figure 112: Eastern Europe Market Y-o-Y Growth Comparison by Output Voltage, 2025-2035
  • Figure 113: Eastern Europe Market Attractiveness Analysis by Output Voltage
  • Figure 114: Eastern Europe Market Value Share and BPS Analysis by Output Power, 2025 and 2035
  • Figure 115: Eastern Europe Market Y-o-Y Growth Comparison by Output Power, 2025-2035
  • Figure 116: Eastern Europe Market Attractiveness Analysis by Output Power
  • Figure 117: Eastern Europe Market Value Share and BPS Analysis by Output Number, 2025 and 2035
  • Figure 118: Eastern Europe Market Y-o-Y Growth Comparison by Output Number, 2025-2035
  • Figure 119: Eastern Europe Market Attractiveness Analysis by Output Number
  • Figure 120: Eastern Europe Market Value Share and BPS Analysis by Type, 2025 and 2035
  • Figure 121: Eastern Europe Market Y-o-Y Growth Comparison by Type, 2025-2035
  • Figure 122: Eastern Europe Market Attractiveness Analysis by Type
  • Figure 123: East Asia Market Value Share and BPS Analysis by Country, 2025 and 2035
  • Figure 124: East Asia Market Value Share and BPS Analysis by Aircraft Type, 2025 and 2035
  • Figure 125: East Asia Market Y-o-Y Growth Comparison by Aircraft Type, 2025-2035
  • Figure 126: East Asia Market Attractiveness Analysis by Aircraft Type
  • Figure 127: East Asia Market Value Share and BPS Analysis by Form Factor, 2025 and 2035
  • Figure 128: East Asia Market Y-o-Y Growth Comparison by Form Factor, 2025-2035
  • Figure 129: East Asia Market Attractiveness Analysis by Form Factor
  • Figure 130: East Asia Market Value Share and BPS Analysis by Input Voltage, 2025 and 2035
  • Figure 131: East Asia Market Y-o-Y Growth Comparison by Input Voltage, 2025-2035
  • Figure 132: East Asia Market Attractiveness Analysis by Input Voltage
  • Figure 133: East Asia Market Value Share and BPS Analysis by Output Voltage, 2025 and 2035
  • Figure 134: East Asia Market Y-o-Y Growth Comparison by Output Voltage, 2025-2035
  • Figure 135: East Asia Market Attractiveness Analysis by Output Voltage
  • Figure 136: East Asia Market Value Share and BPS Analysis by Output Power, 2025 and 2035
  • Figure 137: East Asia Market Y-o-Y Growth Comparison by Output Power, 2025-2035
  • Figure 138: East Asia Market Attractiveness Analysis by Output Power
  • Figure 139: East Asia Market Value Share and BPS Analysis by Output Number, 2025 and 2035
  • Figure 140: East Asia Market Y-o-Y Growth Comparison by Output Number, 2025-2035
  • Figure 141: East Asia Market Attractiveness Analysis by Output Number
  • Figure 142: East Asia Market Value Share and BPS Analysis by Type, 2025 and 2035
  • Figure 143: East Asia Market Y-o-Y Growth Comparison by Type, 2025-2035
  • Figure 144: East Asia Market Attractiveness Analysis by Type
  • Figure 145: South Asia & Pacific Market Value Share and BPS Analysis by Country, 2025 and 2035
  • Figure 146: South Asia & Pacific Market Value Share and BPS Analysis by Aircraft Type, 2025 and 2035
  • Figure 147: South Asia & Pacific Market Y-o-Y Growth Comparison by Aircraft Type, 2025-2035
  • Figure 148: South Asia & Pacific Market Attractiveness Analysis by Aircraft Type
  • Figure 149: South Asia & Pacific Market Value Share and BPS Analysis by Form Factor, 2025 and 2035
  • Figure 150: South Asia & Pacific Market Y-o-Y Growth Comparison by Form Factor, 2025-2035
  • Figure 151: South Asia & Pacific Market Attractiveness Analysis by Form Factor
  • Figure 152: South Asia & Pacific Market Value Share and BPS Analysis by Input Voltage, 2025 and 2035
  • Figure 153: South Asia & Pacific Market Y-o-Y Growth Comparison by Input Voltage, 2025-2035
  • Figure 154: South Asia & Pacific Market Attractiveness Analysis by Input Voltage
  • Figure 155: South Asia & Pacific Market Value Share and BPS Analysis by Output Voltage, 2025 and 2035
  • Figure 156: South Asia & Pacific Market Y-o-Y Growth Comparison by Output Voltage, 2025-2035
  • Figure 157: South Asia & Pacific Market Attractiveness Analysis by Output Voltage
  • Figure 158: South Asia & Pacific Market Value Share and BPS Analysis by Output Power, 2025 and 2035
  • Figure 159: South Asia & Pacific Market Y-o-Y Growth Comparison by Output Power, 2025-2035
  • Figure 160: South Asia & Pacific Market Attractiveness Analysis by Output Power
  • Figure 161: South Asia & Pacific Market Value Share and BPS Analysis by Output Number, 2025 and 2035
  • Figure 162: South Asia & Pacific Market Y-o-Y Growth Comparison by Output Number, 2025-2035
  • Figure 163: South Asia & Pacific Market Attractiveness Analysis by Output Number
  • Figure 164: South Asia & Pacific Market Value Share and BPS Analysis by Type, 2025 and 2035
  • Figure 165: South Asia & Pacific Market Y-o-Y Growth Comparison by Type, 2025-2035
  • Figure 166: South Asia & Pacific Market Attractiveness Analysis by Type
  • Figure 167: Middle East and Africa Market Value Share and BPS Analysis by Country, 2025 and 2035
  • Figure 168: Middle East and Africa Market Value Share and BPS Analysis by Aircraft Type, 2025 and 2035
  • Figure 169: Middle East and Africa Market Y-o-Y Growth Comparison by Aircraft Type, 2025-2035
  • Figure 170: Middle East and Africa Market Attractiveness Analysis by Aircraft Type
  • Figure 171: Middle East and Africa Market Value Share and BPS Analysis by Form Factor, 2025 and 2035
  • Figure 172: Middle East and Africa Market Y-o-Y Growth Comparison by Form Factor, 2025-2035
  • Figure 173: Middle East and Africa Market Attractiveness Analysis by Form Factor
  • Figure 174: Middle East and Africa Market Value Share and BPS Analysis by Input Voltage, 2025 and 2035
  • Figure 175: Middle East and Africa Market Y-o-Y Growth Comparison by Input Voltage, 2025-2035
  • Figure 176: Middle East and Africa Market Attractiveness Analysis by Input Voltage
  • Figure 177: Middle East and Africa Market Value Share and BPS Analysis by Output Voltage, 2025 and 2035
  • Figure 178: Middle East and Africa Market Y-o-Y Growth Comparison by Output Voltage, 2025-2035
  • Figure 179: Middle East and Africa Market Attractiveness Analysis by Output Voltage
  • Figure 180: Middle East and Africa Market Value Share and BPS Analysis by Output Power, 2025 and 2035
  • Figure 181: Middle East and Africa Market Y-o-Y Growth Comparison by Output Power, 2025-2035
  • Figure 182: Middle East and Africa Market Attractiveness Analysis by Output Power
  • Figure 183: Middle East and Africa Market Value Share and BPS Analysis by Output Number, 2025 and 2035
  • Figure 184: Middle East and Africa Market Y-o-Y Growth Comparison by Output Number, 2025-2035
  • Figure 185: Middle East and Africa Market Attractiveness Analysis by Output Number
  • Figure 186: Middle East and Africa Market Value Share and BPS Analysis by Type, 2025 and 2035
  • Figure 187: Middle East and Africa Market Y-o-Y Growth Comparison by Type, 2025-2035
  • Figure 188: Middle East and Africa Market Attractiveness Analysis by Type
  • Figure 189: Global Market - Tier Structure Analysis
  • Figure 190: Global Market - Company Share Analysis

Frequently Asked Questions

What is the projected size of the aerospace DC-DC converter market by 2035?

The market is projected to reach USD 3.5 billion by 2035.

What CAGR is expected for the aerospace DC-DC converter market from 2025 to 2035?

The market is expected to grow at a CAGR of 11% during 2025-2035.

Which aircraft type segment leads the aerospace DC-DC converter market in 2025?

Fixed wing aircraft accounts for 45% share in 2025.

Which form factor dominates the aerospace DC-DC converter market?

Brick form factor holds 35% share in 2025.

Who is the leading player in the aerospace DC-DC converter market and what is its share?

Eaton is the leading player with 22% market share in 2025.

Explore Similar Insights

Future Market Insights

Aerospace DC-DC Converter Market