The demand for USB Type C in the USA is projected to reach USD 45.8 billion by 2035, reflecting an absolute increase of USD 34.1 billion over the forecast period. The demand, valued at USD 11.7 billion in 2025, is expected to grow at a robust CAGR of 14.6%. USB Type C is becoming the universal standard for charging and data transfer across a wide range of devices, including smartphones, laptops, tablets, and other consumer electronics. Its reversible design, fast data transfer speeds, and the ability to deliver power, audio, and video through a single cable are key drivers of its growing adoption.
As industries move towards standardized, high-performance connectors, the adoption of USB Type C will continue to expand. The increasing shift from proprietary charging ports to the universal Type C standard, along with its growing presence in new-generation devices, will drive demand significantly. The rise in consumer electronics, including the increasing production of USB Type C-enabled smartphones, laptops, and wearables, will further contribute to the growth of this technology.
This widespread adoption is also driven by regulatory efforts promoting standardization, as well as a growing preference for USB Type C in emerging technologies such as electric vehicles and smart home devices.
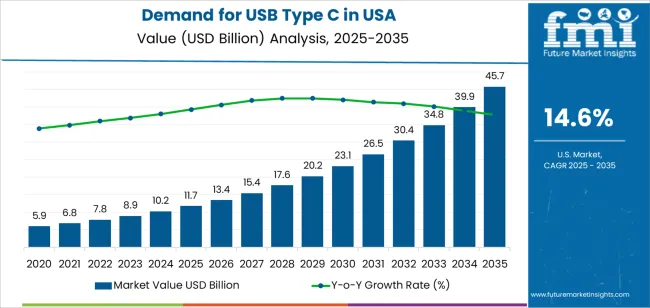
The growth curve for USB Type C in the USA is expected to follow a distinctive pattern characterized by steady growth in the early years followed by a sharp acceleration toward the latter part of the forecast period. Between 2025 and 2030, the demand will grow from USD 11.7 billion to USD 13.4 billion, adding USD 1.7 billion. This steady growth is indicative of the ongoing adoption of USB Type C in consumer electronics, particularly smartphones, laptops, and tablets, driven by technological improvements and rising demand for faster charging and data transfer capabilities. However, growth will remain moderate as industries gradually transition to USB Type C standards.
From 2030 to 2035, the growth curve will experience a more pronounced upward slope. The demand is projected to surge from USD 13.4 billion to USD 45.8 billion, adding USD 32.4 billion. This significant acceleration is due to the widespread adoption of USB Type C across a variety of industries, including electric vehicles, wearables, and IoT devices, where the need for fast, universal charging and data transfer solutions is increasing. As USB Type C becomes the standard across an even broader array of devices, the growth rate will continue to rise, reflecting the integration of USB Type C into nearly all consumer electronics and technology-driven industries.
The industry growth curve, therefore, exhibits a sharp transition from gradual adoption to widespread, accelerated use as USB Type C becomes the universal standard for charging, data, and power transfer in a wide array of devices and industries.
| Metric | Value |
|---|---|
| USA USB Type C Sales Value (2025) | USD 11.7 billion |
| USA USB Type C Forecast Value (2035) | USD 45.8 billion |
| USA USB Type C Forecast CAGR (2025-2035) | 14.60% |
The uptake of USB Type C connectivity in the USA is accelerating as device manufacturers standardize on the format for charging, data transfer, and video output. USB Type-C offers reversible plug orientation, high power delivery, and faster data speeds, making it a preferred interface for smartphones, laptops, tablets, and peripherals. As consumer’s upgrade devices and demand convenience and compatibility, the growth in USB Type-C adoption is clear.
Regulatory momentum and industry standards are also contributing. With more devices relying on multipurpose ports and global movements pushing for universal charging formats, manufacturers in the USA are incorporating USB-C across new product generations. The automotive sector’s move toward USB-C for in-vehicle infotainment and charging is further expanding the use case beyond traditional electronics.
Further, consumer expectations around speed and convenience are driving upgrades. Devices with older USB-A or proprietary ports are being replaced with USB-C models that offer higher power delivery (PD) capabilities and faster data transfer. As these trends converge, demand for the components and solutions surrounding USB Type-C in the USA is set to continue strong growth through 2035.
Demand is segmented by product type, standard, and industry. By product type, demand is divided into USB Type C receptacle and USB Type C plug. In terms of standard, the industry is categorized into USB 3.2, USB 2.0, USB 3.0, USB 3.1, and others. The industry is also segmented by industry, including consumer electronics, automotive, media & entertainment, telecom & tech, and healthcare. Regionally, demand is divided into West, South, Northeast, and Midwest.
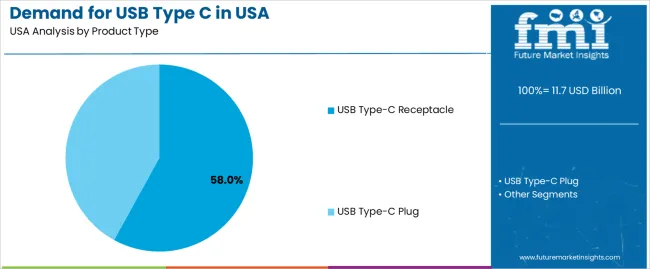
USB Type C receptacles account for 58% of the demand for USB Type C in the USA. USB Type C receptacles are the most commonly used components in devices, as they are designed to accept Type C plugs for charging, data transfer, and other functionalities. These receptacles are favored for their reversible design, compact size, and ability to support higher data transfer speeds and power delivery compared to previous USB standards.
As the adoption of USB Type C continues to rise in consumer electronics, including laptops, smartphones, and other portable devices, the demand for USB Type C receptacles grows. Their versatility and ability to serve as a universal connector across multiple device types make them integral to the ongoing shift towards standardized, efficient connections in modern electronics. With more devices adopting USB Type C as the standard connector, the demand for USB Type C receptacles is expected to continue to lead the industry.
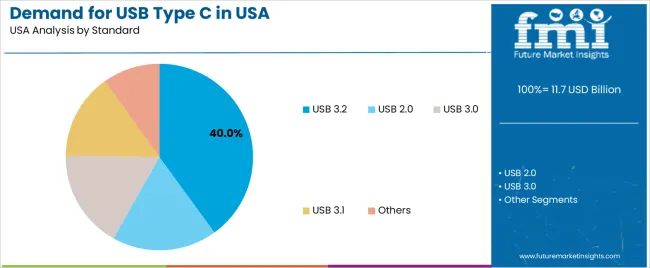
The USB 3.2 standard accounts for 40% of the demand for USB Type C in the USA. USB 3.2 offers significantly faster data transfer speeds compared to its predecessors, making it the preferred choice for high-performance devices. This standard supports data rates up to 20Gbps, which is essential for modern applications requiring high-speed data transfer, such as video editing, gaming, and large file backups.
The demand for USB 3.2 is driven by its compatibility with a wide range of devices, including consumer electronics, laptops, and external storage devices. As the need for faster data transfer grows in industries such as media & entertainment, telecom & tech, and consumer electronics, USB 3.2 has become the go-to standard for USB Type C. With ongoing technological advancements and the growing need for high-speed connectivity, USB 3.2 is expected to maintain its dominant position in the industry.
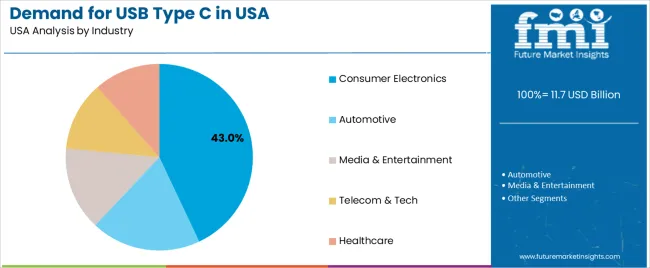
The consumer electronics industry represents 43% of the demand for USB Type C in the USA. USB Type Cis widely adopted in consumer electronics due to its versatility, speed, and compact design. It is commonly used for charging and data transfer in devices such as smartphones, laptops, tablets, and wearables. The growing demand for faster charging, data speeds, and universal connectivity has made USB Type C the preferred choice in this industry.
As more consumer electronics manufacturers adopt USB Type C as the standard connector, the demand for USB Type C receptacles and plugs is expected to rise. As devices continue to shrink in size while becoming more powerful, the compact, reversible, and efficient nature of USB Type C makes it a crucial technology in the development of next-generation consumer electronics. With increasing consumer preference for devices that offer seamless connectivity and faster charging, the consumer electronics sector will continue to drive the demand for USB Type C in the USA.
USB‑Type C connectors offer reversible plug orientation, high data‑throughput, and power‑delivery capabilities making them ideal for modern smartphones, laptops, gaming devices, and accessories. Growth is driven by increasing device upgrades, adoption of USB‑C in accessories and peripherals, and regulatory/industry momentum toward standardizing USB‑C as the default port. On the flip side, supply‑chain disruptions, incompatibility concerns with older USB types, and competition from wireless charging options present constraints.
Why Is USB C Demand Growing in USA?
USB C cable demand in the USA is growing because more devices now include USB‑C ports, making these cables indispensable for charging, syncing, and connecting across platforms. Consumers are buying new smartphones, tablets, laptops, gaming consoles, and accessories that prioritize USB C for its versatility including higher power delivery, faster data rates, and compact design. The desire to reduce charger‑and‑cable clutter by using a single cable standard across multiple devices further fuels uptake. As manufacturers bundle fewer proprietary cables and rely on USB C for universality, the industry for compatible cables and accessories expands significantly.
How are Technological Innovations Driving Growth of USB C Cables in USA?
Technological innovations are driving USB C cable growth in the USA by improving cable performance, reliability, and compatibility. Advances include higher wattage power‑delivery support (enabling laptop and even monitor charging), faster data transfer standards (USB 3.2/USB4) over USB‑C connectors, and greater durability (e.g., braided cables, reinforced connectors). Some cables now support alternate‑mode video output (USB‑C to HDMI/DisplayPort) and integrate smart‑chip features for safety and negotiation of power. These enhancements allow USB‑C cables to serve across consumer, gaming, professional, and industrial use‑cases, broadening appeal and accelerating replacement of older standards like USB‑A or micro‑USB.
What are the Key Challenges Limiting USB C Cable Adoption in the USA?
Despite strong momentum, several challenges limit universal adoption of USB‑C cables in the USA. One major barrier is legacy device compatibility: many existing devices still use USB‑A, micro‑USB or proprietary ports, creating fragmentation and the need for multiple cable types. Quality and counterfeit concerns also pose risks — sub‑standard cables may fail, degrade, or damage devices, which can undermine consumer confidence. Raw‑material cost volatility (e.g., copper, polymer insulators) and manufacturing constraints may lead to price pressures. Finally, the rising adoption of wireless charging and transfer technologies could reduce reliance on physical cables over the long‑term, especially in specific device segments.
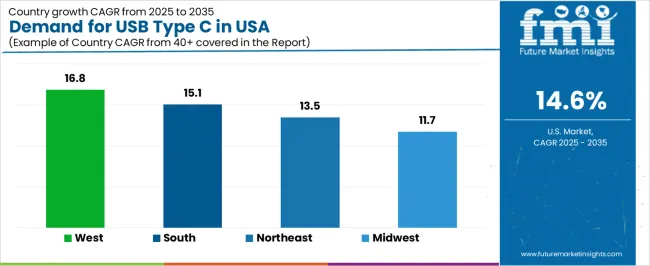
| Region | CAGR (%) |
|---|---|
| West | 16.8% |
| South | 15.1% |
| Northeast | 13.5% |
| Midwest | 11.7% |
The demand for USB Type C in the USA is growing across all regions, with the West leading at a 16.8% CAGR. This growth is driven by the rising adoption of USB Type C in consumer electronics, such as smartphones, laptops, and tablets. The South follows with a 15.1% CAGR, benefiting from strong tech industry presence and manufacturing. The Northeast shows a 13.5% CAGR, supported by its established technology and research sectors. The Midwest experiences moderate growth at 11.7%, driven by steady adoption in electronics and accessory industrys.
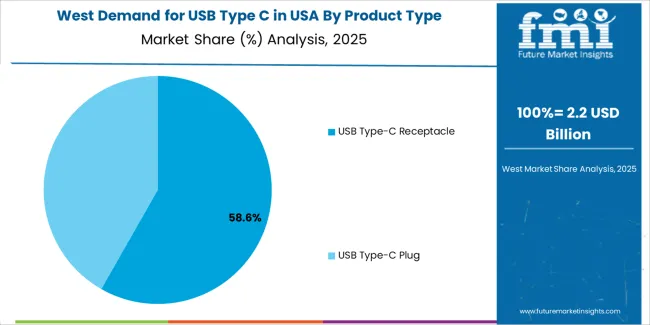
The West is seeing the highest growth in demand for USB Type C, with a 16.8% CAGR. The region’s dominance in the tech industry, including major companies in Silicon Valley, has been a significant driver of this growth. As companies like Apple, Google, and other tech innovators continue to adopt USB Type C in their latest devices, consumer adoption has followed suit. The West is a hub for electronics manufacturing and development, ensuring that USB Type C remains at the forefront of the region's technology. The rapid shift towards universal connectivity, with USB Type C becoming the standard for charging, data transfer, and video output in consumer electronics, is further accelerating demand in the West. The high concentration of early adopters and tech enthusiasts in this region ensures a continuous demand for USB Type C accessories and devices, making it the leader in growth for USB Type C adoption in the USA.
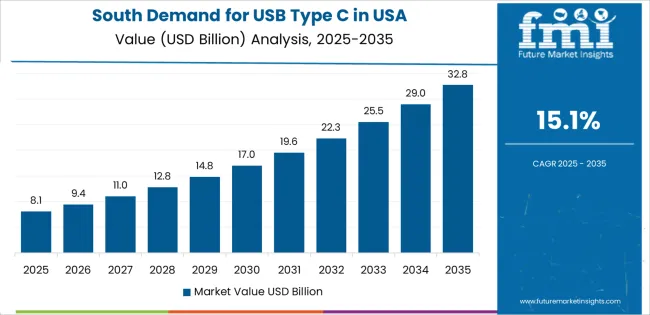
The South is experiencing robust growth in demand for USB Type C, with a 15.1% CAGR. The region benefits from its growing tech industry presence, especially in states like Texas and Georgia, where major companies in electronics and telecommunications are based. As the South continues to expand its manufacturing base for electronics, the demand for USB Type C is growing, particularly for smartphones, laptops, and peripheral devices.
The shift towards USB Type C as a universal standard for connectivity is driving the adoption in both consumer and commercial electronics in the South. The region's rising emphasis on smart devices and high-performance computing further fuels the demand for USB Type C ports and cables. With significant investments in technology infrastructure and electronics manufacturing, the South is likely to see continued growth in USB Type C adoption across consumer and enterprise industrys.
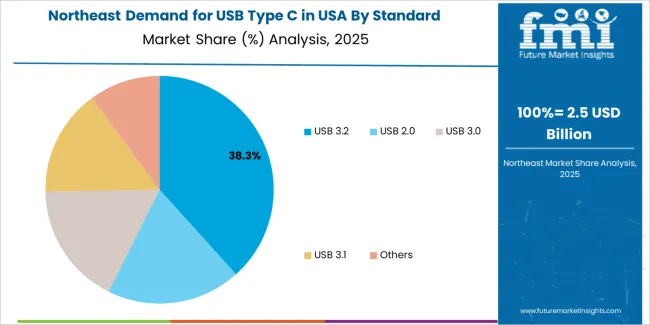
The Northeast is experiencing steady growth in demand for USB Type C, with a 13.5% CAGR. The region’s strong presence in research and development, particularly in technology hubs like Boston and New York, drives innovation and early adoption of USB Type C in devices. The Northeast is home to several universities, tech companies, and electronics manufacturers, all of which are increasingly incorporating USB Type C into their products.
As the standard for charging, data transfer, and video output, USB Type C ’s growth in the Northeast is fueled by the demand for high-performance devices in professional settings. With an increasing shift toward seamless and universal connectivity in consumer electronics, the Northeast’s tech industry will continue to contribute to the sustained growth of USB Type C in the region. Its focus on innovation and technology development ensures that the region will remain a key player in the USB Type C industry.
The Midwest is experiencing moderate growth in demand for USB Type C, with an 11.7% CAGR. The region’s steady adoption of USB Type C is driven by the increasing demand for modern consumer electronics, including laptops, smartphones, and peripherals. Cities like Chicago and Detroit, which have strong manufacturing and tech sectors, are contributing to the ongoing use of USB Type C as it becomes the standard for device connectivity.
Although the growth rate in the Midwest is slower compared to the West and South, the shift towards universal connectivity in electronics is still progressing. With the region’s focus on manufacturing and innovation in the electronics industry, the demand for USB Type C is expected to grow steadily. As USB Type C becomes more widely adopted across devices and accessories, the Midwest will continue to see steady growth in its USAge, particularly in consumer electronics and personal devices.
The demand for USB Type‑C technologies in the United States is expanding rapidly, driven by the widespread adoption of smartphones, laptops, tablets, and peripheral devices that rely on this connector standard. Key drivers include faster data transfer speeds, higher power delivery capabilities, and the push for a universal, reversible connector across consumer electronics and emerging applications such as electric vehicles and docking stations.
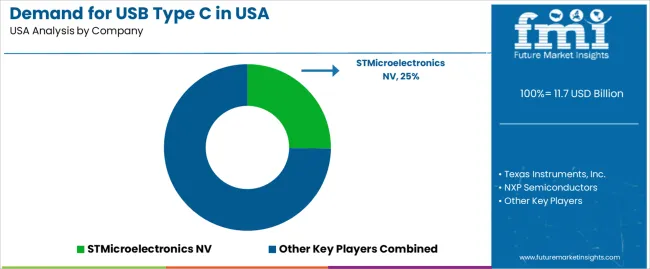
In the U.S. demand landscape, STMicroelectronics NV holds an estimated 25.2% share, reflecting its strong role in manufacturing USB Type‑C controllers and connectors for domestic device makers. Other major suppliers contributing to the U.S. demand include Texas Instruments, Inc., NXP Semiconductors, Infineon Technologies AG, and Analog Devices, Inc., each offering semiconductor and interface chips that support USB Type‑C connectivity in a wide range of devices from smartphones to industrial systems.
Key factors fueling demand in the U.S. include regulatory and industry moves toward standardizing USB Type‑C ports, the increasing integration of USB‑C in charging infrastructure, and the rise of multi‑port devices that require high‑performance connectivity. While challenges such as supply-chain constraints and rising material costs exist, the overall outlook for USB Type‑C demand in the U.S. remains robust, underpinned by the transition toward universal connectivity and device convergence.
| Items | Values |
|---|---|
| Quantitative Unit | USD billion |
| Product Type | USB Type-C Receptacle, USB Type-C Plug |
| Standard | USB 3.2, USB 2.0, USB 3.0, USB 3.1, Others |
| Industry | Consumer Electronics 43.0%, Automotive, Media & Entertainment, Telecom & Tech, Healthcare |
| Regions Covered | West, South, Northeast, Midwest |
| Key Players Profiled | STMicroelectronics NV, Texas Instruments, Inc., NXP Semiconductors, Infineon Technologies AG, Analog Devices, Inc. |
| Additional Attributes | Dollar sales by product type, industry, region, and standard, along with growing demand in consumer electronics and automotive sectors. |
The global demand for USB type C in USA is estimated to be valued at USD 11.7 billion in 2025.
The market size for the demand for USB type C in USA is projected to reach USD 45.7 billion by 2035.
The demand for USB type C in USA is expected to grow at a 14.6% CAGR between 2025 and 2035.
The key product types in demand for USB type C in USA are USB type-c receptacle and USB type-c plug.
In terms of standard, USB 3.2 segment to command 40.0% share in the demand for USB type C in USA in 2025.


Our Research Products

The "Full Research Suite" delivers actionable market intel, deep dives on markets or technologies, so clients act faster, cut risk, and unlock growth.

The Leaderboard benchmarks and ranks top vendors, classifying them as Established Leaders, Leading Challengers, or Disruptors & Challengers.

Locates where complements amplify value and substitutes erode it, forecasting net impact by horizon

We deliver granular, decision-grade intel: market sizing, 5-year forecasts, pricing, adoption, usage, revenue, and operational KPIs—plus competitor tracking, regulation, and value chains—across 60 countries broadly.

Spot the shifts before they hit your P&L. We track inflection points, adoption curves, pricing moves, and ecosystem plays to show where demand is heading, why it is changing, and what to do next across high-growth markets and disruptive tech

Real-time reads of user behavior. We track shifting priorities, perceptions of today’s and next-gen services, and provider experience, then pace how fast tech moves from trial to adoption, blending buyer, consumer, and channel inputs with social signals (#WhySwitch, #UX).

Partner with our analyst team to build a custom report designed around your business priorities. From analysing market trends to assessing competitors or crafting bespoke datasets, we tailor insights to your needs.
Supplier Intelligence
Discovery & Profiling
Capacity & Footprint
Performance & Risk
Compliance & Governance
Commercial Readiness
Who Supplies Whom
Scorecards & Shortlists
Playbooks & Docs
Category Intelligence
Definition & Scope
Demand & Use Cases
Cost Drivers
Market Structure
Supply Chain Map
Trade & Policy
Operating Norms
Deliverables
Buyer Intelligence
Account Basics
Spend & Scope
Procurement Model
Vendor Requirements
Terms & Policies
Entry Strategy
Pain Points & Triggers
Outputs
Pricing Analysis
Benchmarks
Trends
Should-Cost
Indexation
Landed Cost
Commercial Terms
Deliverables
Brand Analysis
Positioning & Value Prop
Share & Presence
Customer Evidence
Go-to-Market
Digital & Reputation
Compliance & Trust
KPIs & Gaps
Outputs
Full Research Suite comprises of:
Market outlook & trends analysis
Interviews & case studies
Strategic recommendations
Vendor profiles & capabilities analysis
5-year forecasts
8 regions and 60+ country-level data splits
Market segment data splits
12 months of continuous data updates
DELIVERED AS:
PDF EXCEL ONLINE
Demand Signal Repository Solutions Market Size and Share Forecast Outlook 2025 to 2035
Demand Side Management Market Size and Share Forecast Outlook 2025 to 2035
Demand Response Market Analysis - Size, Share, and Forecast Outlook 2025 to 2035
Demand and Trend Analysis of Gaming Monitor in Western Europe Size and Share Forecast Outlook 2025 to 2035
Demand and Trend Analysis of Gaming Monitor in Japan Size and Share Forecast Outlook 2025 to 2035
Demand and Trend Analysis of Gaming Monitor in Korea Size and Share Forecast Outlook 2025 to 2035
Demand and Trend Analysis of Yeast in Japan - Size, Share, and Forecast Outlook 2025 to 2035
Demand and Trends Analysis of Stevia in Japan Size and Share Forecast Outlook 2025 to 2035
Vanilla Bean Industry Analysis in Japan Size and Share Forecast Outlook 2025 to 2035
Banana Flour in Japan - Size and Share Forecast Outlook 2025 to 2035
Demand and Trend Analysis of Yogurt Powder in Western Europe Size and Share Forecast Outlook 2025 to 2035
Demand and Trend Analysis of Yogurt Powder in Korea Size and Share Forecast Outlook 2025 to 2035
Demand of Dehydrated Vegetables in Japan Size, Share, and Forecast Outlook 2025 to 2035
Demand and Trends Analysis of Fat Filled Milk Powder in Western Europe Size and Share Forecast Outlook 2025 to 2035
Demand and Trends Analysis of Fat Filled Milk Powder in Korea Size and Share Forecast Outlook 2025 to 2035
Demand of No-acid Whey Strained Dairy Processing Concepts in European Union Size and Share Forecast Outlook 2025 to 2035
Demand of Pistachio-based desserts & ingredients in France Analysis - Size, Share & Forecast 2025 to 2035
Demand of MFGM-enriched Powders & RTDs in European Union Size and Share Forecast Outlook 2025 to 2035
Demand for Bronte Pistachio in Italy Analysis - Size, Share & Forecast 2025 to 2035
Korea Cosmetics ODM Market Analysis – Size, Share & Trends 2025 to 2035

Thank you!
You will receive an email from our Business Development Manager. Please be sure to check your SPAM/JUNK folder too.
Chat With
MaRIA