The global industrial margarine market is estimated to be worth USD 2.9 billion in 2025. It is projected to reach a value of USD 4.9 billion by 2035, expanding at a CAGR of 5.3% over the assessment period of 2025 to 2035.
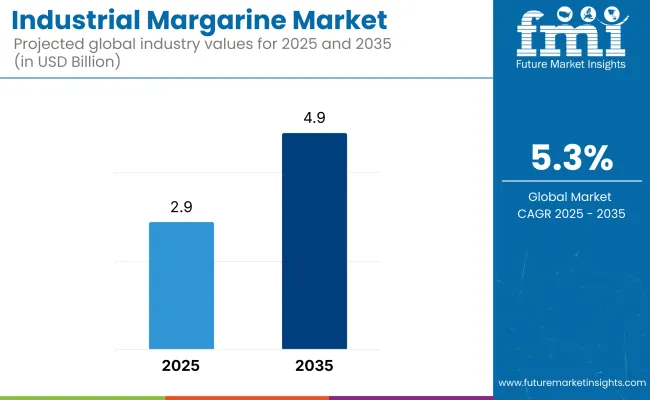
The industry is developing because of the broad usage of margarine in food processing, such as in bakery, confectionery, dairy, and convenience food products. Industrial margarine is often a choice for cost-effective substitutes for butter and has functional benefits like better texture and the increased shelf life that it provides, as well as being used in food production that is versatile and a more economical option. On top of this, the rising number of processed and packaged foods is now a major factor in the development.
Food manufacturers are rethinking how to make margarine. Vegetarians and people who tend to avoid dairy and dairy products are increasingly acquiring plant-based and vegan alternatives.
Furthermore, the increase in the bakery and confectionery sector is also contributing to the growth of the market. Industrial margarine is an indispensable ingredient for the making of pastries, cookies, and cakes. The use of laminated dough adds a flaky layer, advice, and a feeling in the mouth. The surge in demand for artisanal and specialty baked goods is the main drive of progressing innovation in margarine formulas used for special processing needs.
The improvement of the fat modification, emulsification, and texture enhancement quality has a positive effect on the functionality and stability of the industrial margarine. The innovations in the enzyme process interesterification and sustainable raw material sources have addressed the interests of the consumers in product quality and environmental issues. Besides, the creation of specific margarine solutions for big businesses is gaining ground in the area.
Issues include fluctuating raw materials prices, regulatory concerns related to partially hydrogenated oils (PHOs), and the environmental risk of palm oil sourcing. Moreover, competition from butter substitutes and alternative fat sources may affect the industry equilibrium.
The industry is growing, influenced by cost, functionality, and increasing demand for plant-based foodstuffs. The bakery and confectionery industry is still the biggest consumer, using margarine for texture, shelf life, and affordability. Due to its application flexibility, the food processing industry adds margarine to snacks, ready meals, and frozen foods.
Within the HoReCa industry, premium and health-oriented formulations are prioritized, with a drive towards trans-fat-free and fortified margarine. Retail and consumer consumption is turning towards healthier, sustainable, and dairy-free options, in line with trends for vegan and functional food products.
Fat composition innovation, such as omega-enriched and clean-label margarine, is redefining industry trends. However, raw material price volatility (vegetable oils) and regulatory controls on trans fats are challenges that make sustainable sourcing and product differentiation key to long-term success.
Between 2020 and 2024, there was substantial growth driven by the expanding bakery and confectionery sectors. The emphasis was on reformulating margarine to minimize trans fats and improve health benefits without compromising the required texture and functionality for baking purposes. Sustainable sourcing emerged as a major concern, migrating to RSPO-certified palm oil and honorable supply chains.
Regulators called for stronger regulation of trans fats and transparency in labels, prompting firms towards clean-label techniques. Industrial margarine persisted with its dominance over food service distribution and commercial bakery items, as demand rose on the strength of the product being a cost-effective and all-around adaptable application as compared to regular butter.
Looking forward to 2025 to 2035, there will be a shift due to growing consumer demand for plant-based, functional, and allergen-free margarine.
Processing technology developments will facilitate AI-driven formulation optimization to improve the nutrition content and shelf life of margarine. Sustainability imperatives will urge firms to seek palm-free options and regenerative agriculture sourcing.
Functional ingredient fortification, omega-3s, and plant sterols will target health-conscious consumers, while industrial margarine will expand from bakery applications to other dairy alternatives, meat alternatives, and medical nutrition uses. Updates in regulation will also drive innovation, leading to a future where industrial margarine adapts to global trends toward sustainability and wellness.
A Comparative Market Shift Analysis (2020 to 2024 vs. 2025 to 2035)
| 2020 to 2024 | 2025 to 2035 |
|---|---|
| Growth in bakery and confectionery applications | Increasing demand for plant-based and functional margarine replacements |
| Reformulation with lower trans fats and lower saturated fat levels | Fortified margarine with omega-3, plant sterols, and functional ingredients for cardiovascular health |
| Transition to sustainable palm oil and RSPO-certified sources | Migration to palm-free formulations and regenerative agriculture-based sourcing |
| Emulsifiers and stabilizers used for enhanced texture | AI formulation for improved nutritional quality and shelf life |
| Tighter trans-fat limitations and clean label demands | Greater international regulations of carbon footprint claims and traceability |
| High demand in food service. | Expansion to high-performance margarine for meat alternatives and plant-based meats |
The industry faces supply chain issues, which is why raw material supply prices, like vegetable oils, fluctuate. The state of palm, soybean, and sunflower oils fluctuates due to climatic disasters, geopolitical hurdles, and trade tariffs.
Shifting consumer behavior toward healthier and plant-based substitutes is a factor that may also alter the demand for industrial margarine. Butter, vegan spreads, and non-hydrogenated products, which are gaining acceptance now, bring about more competition. Innovation remains the only choice for industries to beat the competition, whether it be launching functional, clean-label, and fortified margarine types that comply with the new eating patterns.
Economic instability and inflation hurt production costs and consumers' purchasing power. Transportation expenses, an increase in the labor force, and an increase in energy costs associated with sustainability negatively affect profit margins. However, economic downturns that result in less demand in the bakery, confectionery, and food service sectors result from those negative factors. The path amidst this chaos includes the application of efficient processes, smart pricing, and product differentiation.
Concerns regarding sustainability, particularly around deforestation, ascribed to palm oil production, have a negative bearing on the brand's reputation as well as its industry growth. The responsibility of adopting proper sourcing mandates, achieving sustainable certifications, and maintaining absolute transparency in supply chains rests with the companies to be in line with environmental and ethical expectations.
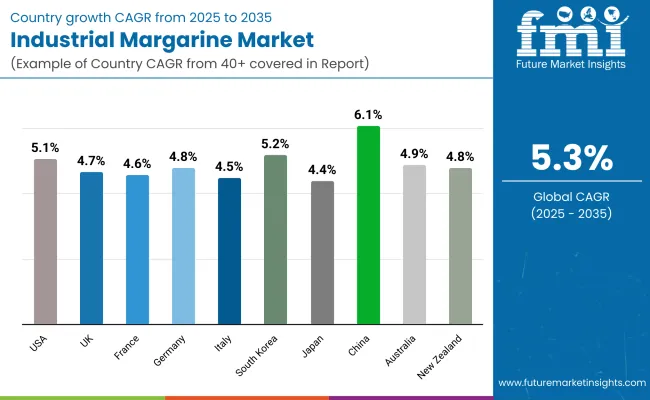
| Countries | CAGR (2025 to 2035) |
|---|---|
| USA | 5.1% |
| UK | 4.7% |
| France | 4.6% |
| Germany | 4.8% |
| Italy | 4.5% |
| South Korea | 5.2% |
| Japan | 4.4% |
| China | 6.1% |
| Australia | 4.9% |
| New Zealand | 4.8% |
The USA industrial margarine industry will increase at a CAGR of 5.1% between 2025 to 2035. This is due to the strong bakery and processed food industries where margarine is a major ingredient based on price sensitivity and functionality. Companies are resorting to product reformulation to eliminate trans fats and comply with health rules as consumers are becoming increasingly health-conscious.
Further, the need for vegetarians is mounting pressure on manufacturers to produce margarine varieties based on vegetable oil suitable for consumption by vegans and health food purchasers. Spending on R&D is utilized to develop the flavor and consistency of the margarine so that it closely resembles butter and is more appealing to consume as a spread on other foods.
The UK Industrial Margarine industry will grow at 4.7% CAGR for 2025 to 2035. Marginal manufacturing is being promoted by increased demand for sustainable and healthy food. Plant-based source food has also introduced an innovation to start lower-saturated fat content for margarine formulas without opting for any artificial ingredients. Bakeries, which are important margarine users, are also growing, mainly in premium and craft segments.
Sustainability issues are forcing companies to use oils that are sustainably sourced, and pressures from regulations are forcing the curbing of palm oil usage. The trend of organic and non-GMO is also propelling the market because consumers are becoming increasingly ingredient-conscious.
France is anticipated to showcase a 4.6% CAGR in 2025 to 2035. French food consumers are such that they prefer natural ingredients and quality goods, forcing companies to introduce luxury margarine lines. The nation's high culture in pastry and bread guarantees ongoing demand for margarine to be employed when making croissants and viennoiseries.
The health and wellness wave is spurring innovation, with producers' margarine offerings on store shelves being supplied with omega-3s as well as other functional components. French regulatory conditions are still tight, compelling the market to trim trans fats and maintain clean-label formats. Increasing numbers of flexitarians and vegans also push demand for plant-based alternatives to margarine.
Germany is expected to expand at a CAGR of 4.8% from 2025 to 2035. Germany possesses an industrially advanced bakery industry with a range of bread and pastry items, which depends on margarine for its functional properties. Germany's increasing demand for vegan and plant-based foods is compelling businesses to innovate and create animal-free ingredients-based margarine products.
One of the major areas of concentration is sustainability, with the company utilizing sustainable palm oil and considering alternative oils as a way of luring green-aware consumers. Sophisticated manufacturing processes through technology are also being adopted as a way of increasing product quality and meeting strict German food laws.
in Italy is set to achieve a CAGR of 4.5% from 2025 to 2035. The overwhelming predominance of traditional bakery and confectionery companies ensures constant demand for margarine, especially in large quantities. Italian consumers demand natural and high-quality ingredients, and this compels manufacturers to reformulate margarine products with reduced amounts of artificial ingredients.
The growing popularity of Mediterranean diet trends is moving consumer focus toward healthy fats, and thus, margarine blends with the inclusion of olive and sunflower oils are being formulated. Consumer pressure and regulatory forces are also compelling movement away from hydrogenated fats towards more market-preferred alternatives.
South Korea is anticipated to increase at a 5.2% CAGR from 2025 to 2035. Margarine has witnessed tremendous demand as a cheap substitute for butter after improvements in bakery and café culture in the country. Urbanization and improvement in solitary working household homes have helped achieve greater consumption of bakery foods easy to eat.
Health-conscious consumers are promoting the launch of trans-fat-free and lower-calorie margarine. The massive technological leap in food technology in South Korea enables the production of new varieties of margarine that cater to new consumer trends, such as functional ingredients like probiotics and plant-based additives.
Japan is forecast to develop at a 4.4% CAGR between 2025 to 2035. The nation's focus on accuracy in food processing has enabled the manufacture of superior-quality margarine for specific applications. Rising demand for Western-style baked items fuels the steady growth of the market, as margarine forms a key element of industrial bread-making.
Demographic change and the health-oriented consumer segment have, however, spurred demand for low-fat and fortified margarine products. Premiumization is underway, too, with firms introducing craft-style margarine products that yield the flavor and texture of top-tier better and health-functioning advantages.
China is expected to capture a CAGR of 6.1% over the forecast period. The reason is that the baking market continues to expand, and Chinese markets continue to see increasing demand for Western-style baked foods. Urbanization and rising disposable incomes are responsible for the increased consumption of convenience food. Thus, it is responsible for driving demand for margarine as an ingredient that has a variety of uses.
Companies are reacting by shifting to address local needs by formulating margarine products that are compatible with traditional Chinese pastries and snack foods. Joint ventures between local food service operators and bakeries assist in penetrating the market for the products. Attempts to improve the nutritional profile of margarine are made to minimize health issues and regulatory compliance.
Australia will register a CAGR of 4.9% in the 2025 to 2035 period. Clean-label and sustainable food is the game's name as consumers opt for margarine that doesn't contain artificial additives. The quick-service restaurant and café channels are leading performers.
Rising consciousness regarding plant-based diets is also boosting demand for non-dairy margarine substitutes. Ingredient innovations like locally sourced, sustainably sourced oils are driving product appeal among eco-aware customers.
New Zealand's industrial margarine market is expected to grow at a 4.8% CAGR through 2025 to 2035. The nation boasts robust food processing and dairy industries that support competitive scenarios, and margarine is a broadly used ingredient in the food processing and bakery segments.
The rebranding of products on health lines is fueling the industry with an emphasis on the elimination of trans fats and the use of natural ingredients. Flexitarian diets are also gaining popularity and pushing producers to introduce plant-based margarine variants. In addition, strict food safety legislation maintains high-quality levels, and hence, New Zealand is a prominent premium margarine maker.
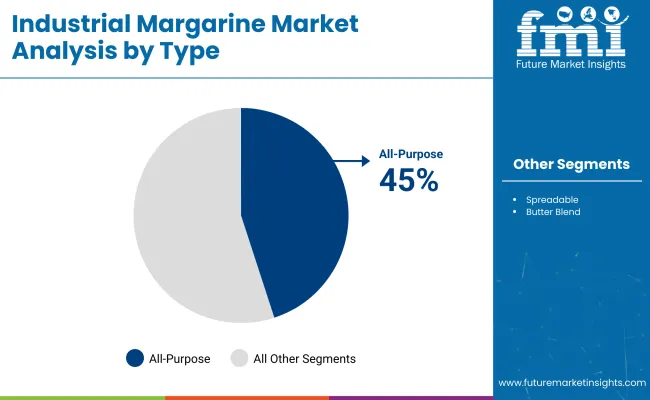
| Segment | Value Share (2025) |
|---|---|
| All-Purpose Margarine (By Type) | 45% |
The industrial margarine market is segmented by functionality and application into all-purpose margarine, spreadable margarine, and others. Of these, the all-purpose margarine segment is projected to hold the dominant share, 45.0%, in 2025, followed by the spreadable margarine segment, which has a share of 35.0%.
Used primarily for bakery, confectionary, and food service, all-purpose margarine is usually cost-effective, shelf-stable, and provides a long shelf life. It is commonly used in commercial baking for pastries, cakes, and laminated doughs. This segment is comprised of players like Bunge Limited, Cargill, and Wilmar International, who provide customized solutions for food manufacturers. Bunge’s Vream™ margarine, for example, creates flakiness and offers a certain texture to baked goods to be used in higher-size production.
Spreadable margarine has a higher percentage of liquid oils than regular margarine, which makes it spreadable even at refrigerated temperatures. In household consumption and food service applications, it is widely used as toast spreads and sandwich dressings.
Key Leaders Upfield (Flora, Blue Band), Conagra Brands (Country Crock, Blue Bonnet), and AAK AB have accordingly launched low-fat and plant-based alternatives to cater to health-conscious consumers. One example is Upfield’s Flora Plant Butter - a dairy-free and vegan spread that grows demand for more sustainable and plant-based products.
An Increasingly health-conscious consumer base is propelling these manufacturers to make products that are healthier, trans-fat-free, and fortified with other minerals/proteins, such as omega and cholesterol-free items.
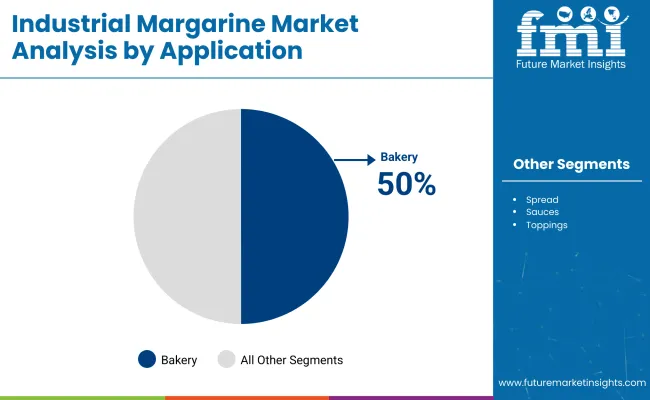
| Segment | Value Share (2025) |
|---|---|
| Bakery (By Application) | 50% |
Based on their industrial applications, bakery chains, and spreads are the major segments. The estimated revenue share of bakeries in 2025 is 50%, and for spreads, it will be 20%.
Margarine is ubiquitous in baked goods due to its low cost, long shelf life, and for its ability to enhance texture. It’s commonly used in pastries, cakes, cookies, and croissants to help provide the flake and moisture retention they desire. Bunge Limited, AAK AB, and Wilmar International are the leaders in this segment, as they provide specialized bakery margarine solutions. For example, AAK's Akoblend margarine, intended for large bakeries and food processors, adds to lamination and puff pastry quality.
Spreadable margarine is an exciting alternative to habitats and the food service industry. Due to increasing health awareness, consumers searching for plant-based, low-fat, and cholesterol-free products propel this industry. Conagra Brands (Country Crock) and Upfield (Flora, Blue Band) are companies that make spreadable margarine for all diets. Blue Band by Upfield isn't just tailored to segment its price point to suit emerging economies-having a vitamin-powered formula makes it even more attractive.
Increased consumption of healthy margarine, particularly functional varieties containing omega, along with trans-fat-free margarine products, is leading companies to introduce novel margin products.
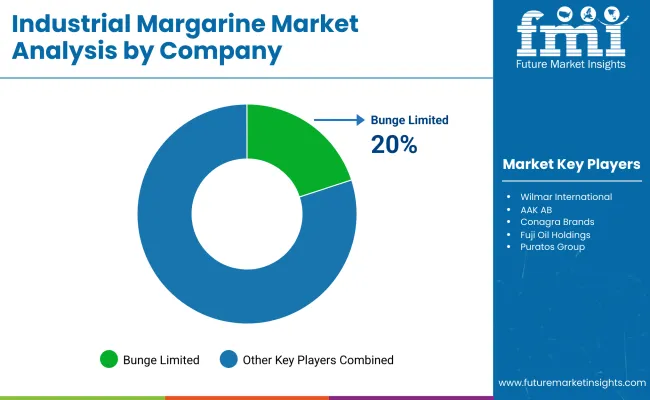
The industrial margarine market is undergoing a revolution driven by changes in consumer preferences, technological advancements, and shifts in regulations. As more people seek healthier alternatives, major margarine producers are reformulating their products by removing trans fats and incorporating sustainable ingredients.
Examples of industry leaders are the vertically integrated food ingredient companies Bunge Limited, Wilmar International, AAK AB, Conagra Brands, and Fuji Oil Holdings. All the companies employ extensive supply chains and advanced processing capabilities to support their leadership.
The competitiveness of sustainable and transparent manufacturing, mostly among key leaders, is also revealed by huge investments by these companies in RSPO-certified palm oil, plant-based margarine alternatives, and carbon-neutral production facilities.
An example of an innovative margarine formulation meeting clean-label demands is that of AAK AB, which is shea-based and non-hydrogenated. Other activities include the establishment and acquisition of regional production facilities involving specialized fat and oil processing companies to increase sales penetration and share. Government regulations putting pressure on trans-fat elimination, coupled with the harshest in Europe and North America, put competitive strategies in dire straits by pushing firms to hasten the transition to a healthier product formulation.
Market Share Analysis by Company
| Company Name | Estimated Market Share (%) |
|---|---|
| Bunge Limited | 20-24% |
| Wilmar International | 16-20% |
| AAK AB | 12-16% |
| Conagra Brands | 10-14% |
| Fuji Oil Holdings | 8-12% |
| Other Companies (Combined) | 25-35% |
| Company Name | Key Offerings & Activities |
|---|---|
| Bunge Limited | The industry leader in margarine solutions, investing in sustainable palm oil sourcing and low-trans-fat formulations. |
| Wilmar International | Global supplier of specialty fats and margarine, focusing on cost-effective, large-scale production and regional market expansion. |
| AAK AB | Specializes in plant-based and premium margarine alternatives, emphasizing clean-label as well as non-hydrogenated fat solutions. |
| Conagra Brands | Offers a broad range of industrial and consumer margarine products, integrating R&D-driven healthier fat alternatives. |
| Fuji Oil Holdings | Leading Asian manufacturer with expertise in palm-based and functional margarine solutions for bakery and food service applications. |
Key Company Insights
Bunge Limited (20-24%)
Bunge is the leader in the margarine segment for industries where it implements sustainable palm oil initiatives and integrates its supply chain. The company has constantly collaborated with several global food manufacturers to develop optimal fat formulations for health-conscious end-users that comply with trans-fat regulations.
Wilmar International (16-20%)
Wilmar uses this stronghold to cater to cost-competitive margarine solutions with applications in mass consumption. The companies have invested in the production of RSPO-certified palm oil and are penetrating developing Asian and African countries.
AAK AB (12-16%)
AAK leads sustainable margarine innovation by offering plant-based, low-saturated-fat alternatives. It partners with bakeries and food manufacturers worldwide to serve the clean-label and functional food industry.
Conagra Brands (10-14%)
Conagra offers both retail and industrial margarine products, supported by a solid brand portfolio and research and development based on trans-fat-free and non-GMO formulations.
Fuji Oil Holdings (8-12%)
Fuji Oil specializes in palm and shea butter margarine, which is used industrially in food production, mostly in bakery and processed food manufacturing. The company also advances its research and development for texture and flavor enhancement.
Other Key Players (25-35% Combined)
All-purpose, Spreadable, and Butter Blend Margarine are the major types of margarine found in the food industry.
Hard and Soft Margarine are also included, catering to end users such as bakeries, confectioneries, and other food production sectors.
The section is divided into Plant-Based and Animal-Based Margarine based on mark inclination and creates modernization.
In addition, industrial margarine is used in Bakery, Spreads, Sauces, Toppings, Confectionery, Convenience Foods, and other applications that call for fat-based formulations.
The regions covered are North America, Latin America, Western Europe, Eastern Europe, South Asia and the Pacific, East Asia, Central Asia, Balkan and Baltic Countries, Russia and Belarus, and the Middle East and Africa.
The industry is expected to reach USD 2.9 billion in 2025.
The market is projected to grow to USD 4.9 billion by 2035.
The market is expected to grow at a CAGR of 5.3% from 2025 to 2035.
China is expected to grow at the fastest rate, with a CAGR of 6.1% during the forecast period.
The All-Purpose Margarine segment is among the most widely used in the market.
Leading companies include Bunge Limited, Wilmar International, AAK AB, Conagra Brands, Fuji Oil Holdings, Cargill, Inc., Puratos Group, Vandemoortele, NMGK Group, and Richardson International.


Our Research Products

The "Full Research Suite" delivers actionable market intel, deep dives on markets or technologies, so clients act faster, cut risk, and unlock growth.

The Leaderboard benchmarks and ranks top vendors, classifying them as Established Leaders, Leading Challengers, or Disruptors & Challengers.

Locates where complements amplify value and substitutes erode it, forecasting net impact by horizon

We deliver granular, decision-grade intel: market sizing, 5-year forecasts, pricing, adoption, usage, revenue, and operational KPIs—plus competitor tracking, regulation, and value chains—across 60 countries broadly.

Spot the shifts before they hit your P&L. We track inflection points, adoption curves, pricing moves, and ecosystem plays to show where demand is heading, why it is changing, and what to do next across high-growth markets and disruptive tech

Real-time reads of user behavior. We track shifting priorities, perceptions of today’s and next-gen services, and provider experience, then pace how fast tech moves from trial to adoption, blending buyer, consumer, and channel inputs with social signals (#WhySwitch, #UX).

Partner with our analyst team to build a custom report designed around your business priorities. From analysing market trends to assessing competitors or crafting bespoke datasets, we tailor insights to your needs.
Supplier Intelligence
Discovery & Profiling
Capacity & Footprint
Performance & Risk
Compliance & Governance
Commercial Readiness
Who Supplies Whom
Scorecards & Shortlists
Playbooks & Docs
Category Intelligence
Definition & Scope
Demand & Use Cases
Cost Drivers
Market Structure
Supply Chain Map
Trade & Policy
Operating Norms
Deliverables
Buyer Intelligence
Account Basics
Spend & Scope
Procurement Model
Vendor Requirements
Terms & Policies
Entry Strategy
Pain Points & Triggers
Outputs
Pricing Analysis
Benchmarks
Trends
Should-Cost
Indexation
Landed Cost
Commercial Terms
Deliverables
Brand Analysis
Positioning & Value Prop
Share & Presence
Customer Evidence
Go-to-Market
Digital & Reputation
Compliance & Trust
KPIs & Gaps
Outputs
Full Research Suite comprises of:
Market outlook & trends analysis
Interviews & case studies
Strategic recommendations
Vendor profiles & capabilities analysis
5-year forecasts
8 regions and 60+ country-level data splits
Market segment data splits
12 months of continuous data updates
DELIVERED AS:
PDF EXCEL ONLINE
Industrial Low Profile Floor Scale Market Size and Share Forecast Outlook 2025 to 2035
Industrial Sand Mill Market Size and Share Forecast Outlook 2025 to 2035
Industrial Control Network Modules Market Size and Share Forecast Outlook 2025 to 2035
Industrial Precision Oven Market Size and Share Forecast Outlook 2025 to 2035
Industrial Water Chiller for PCB Market Size and Share Forecast Outlook 2025 to 2035
Industrial & Commercial HVLS Fans Market Size and Share Forecast Outlook 2025 to 2035
Industrial Robot Controller Market Size and Share Forecast Outlook 2025 to 2035
Industrial Wired Routers Market Size and Share Forecast Outlook 2025 to 2035
Industrial Evaporative Condensers Market Size and Share Forecast Outlook 2025 to 2035
Industrial Energy Management System Market Size and Share Forecast Outlook 2025 to 2035
Industrial Insulation Market Size and Share Forecast Outlook 2025 to 2035
Industrial Safety Gloves Market Size and Share Forecast Outlook 2025 to 2035
Industrial Cleaner Market Size and Share Forecast Outlook 2025 to 2035
Industrial Dust Treatment System Market Size and Share Forecast Outlook 2025 to 2035
Industrial Vertical Washing Tower Market Size and Share Forecast Outlook 2025 to 2035
Industrial Pepper Market Size and Share Forecast Outlook 2025 to 2035
Industrial Electronics Packaging Market Forecast and Outlook 2025 to 2035
Industrial Absorbent Market Forecast and Outlook 2025 to 2035
Industrial Furnace Industry Analysis in Europe Forecast and Outlook 2025 to 2035
Industrial Denox System Market Size and Share Forecast Outlook 2025 to 2035

Thank you!
You will receive an email from our Business Development Manager. Please be sure to check your SPAM/JUNK folder too.
Chat With
MaRIA