This site uses cookies, including third-party cookies, that help us to provide and improve our services.

Privacy Policy
- Global Locations -
Headquarters
Future Market Insights, Inc.
Christiana Corporate, 200 Continental Drive, Suite 401, Newark, Delaware - 19713, United States
T: +1-845-579-5705
MEA
Market Access DMCC

1602-6 Jumeirah Bay X2 Tower, Plot No: JLT-PH2-X2A,

Jumeirah Lakes Towers, Dubai,

United Arab Emirates

Americas
Future Market Insights
616 Corporate Way, Suite 2-9018,
Valley Cottage, NY 10989,
United States
T: +1-347-918-3531
Europe
Future Market Insights
3rd Floor, 207 Regent Street,
London W1B 3HH
United Kingdom
T: + 44 (0) 20 8123 9659
D: +44 (0) 20 3287 4268
APAC
Future Market Insights
Office No. 401-A, 4th Floor,
VANTAGE 9, S.No. 36/1/1,
Baner, Pune 411045 India

Network Attached Storage (NAS) Market

Market Insights on Network Attached Storage (NAS) covering sales outlook, demand forecast & up-to-date key trends

Network Attached Storage Market by Design, Product, Storage Solution, Deployment Type, End-user Industry, Components & Region - Forecast 2022 - 2032

Network Attached Storage (NAS) Market Outlook (2022-2032)

[345 Pages Report] The global network attached storage (NAS) market is predicted to rise at a CAGR of 14.2% during 2022-2032. The network attached storage (NAS) market is projected to reach US$ 116.6 Bn by 2032 from US$ 26.8 Bn in 2021.

The adoption of network attached storage (NAS) solutions is anticipated to rise due to the growing demand for data backup and redundancy. Furthermore, the demand for network attached storage (NAS) solutions is growing as network-attached systems provide higher data manageability and scalability for handling and storing data. 

Data Points

Market Insights

Network Attached Storage (NAS) Market Value (2021)

US$ 26.8 Bn

Estimated Market Value (2022)

US$ 31.0 Bn

Projected Market Value (2032)

US$ 116.6 Bn

Global Market Growth Rate (2022-2032)

14.2%

The widespread use of smart connected and IoT devices like smartphones, tablets, and laptops is projected to drive the network attached storage (NAS) market during the forecast period.

Customize this Report

Let us know your requirement to get
100% FREE customization

What is the Impact of COVID-19 on the Network Attached Storage (NAS) Market

Due to COVID-19, various companies adopted remote working practices. As a result, the demand for cloud-based solutions rose significantly. The epidemic has also accelerated the expansion of data usage. To accommodate the expanding demand for network attached storage (NAS) solutions around the world, key suppliers are creating innovative storage facilities.

With an increase in internet traffic during the COVID-19 epidemic, demand for network attached storage (NAS) solutions rose. In 2021, European countries experienced a 20 percent increase in internet traffic following the official announcement of the lockdown. Due to this factor, the sales of network attached storage (NAS) solutions grew immensely.

Furthermore, demand for network attached storage (NAS) hardware devices has decreased due to supply chain disruptions and increased worldwide import and export activity. This indicates that exports were limited as a result of the worldwide shutdown imposed by various governments.

In addition to this, corporations have raised their selling prices due to a scarcity of raw materials and manufacturing halts. Following the COVID-19 epidemic, network attached storage (NAS) solutions sales are growing due to rising data storage demands.

Several key firms created innovative network storage solutions in the first quarter of 2021 to fulfill the increased demand for network attached storage (NAS) solutions.

Sales Analysis of Network Attached Storage (NAS) Market for 2022 to 2032

“The rapid adoption of next-generation wireless internet technology, combined with an increase in business digital transformation journey, is predicted to drive network attached storage (NAS) market growth.”

The growth of unstructured data, the increasing footprint of scale-out NAS in business IT systems, and the focus on network virtualization and software-defined NAS drive the demand for network attached storage (NAS) solutions.

Vendors are developing customised network attached storage (NAS) solutions for enterprises that want to use NAS as a full-fledged data management solution. Due to this, the sales of network attached storage (NAS) solutions are increasing rapidly in enterprise environments.

Integration of on-premise NAS with cloud storage is projected to gain popularity in the future, allowing for complete control over data in the NAS and cloud backup and archiving. Several providers are working to integrate the existing NAS system with popular cloud storage services for storage provisioning. These factors are projected to drive the sales of network attached storage (NAS) solutions during the forecast period.

Easy access, a reasonable price, and a large capacity are key qualities responsible for the rising demand for network attached storage (NAS) solutions. The network attached storage (NAS) system also outperforms DAS in many circumstances, especially when several devices need to access the same store. NAS may be more effective for some workloads than SAN, depending on network traffic and storage communication protocol preferences.

The sales of network attached storage (NAS) solutions are projected to rise as the cloud is used to implement these solutions, which provides more convenience as the service provider is responsible for ensuring optimal uptime, data security, and frequent updates, lowering the total cost of ownership.

The demand for network attached storage (NAS) solutions and devices is predicted to grow as they have made it simple to offload and create data backups from computers while yet having remote access to the contents.

These units store information in a centralised location and provide secure dedicated IP addresses for authorised on-site and network access. The sales of network attached storage (NAS) solutions are growing as they come with various useful and adaptable capabilities to fulfill demands of end users.

Sudip Saha
Sudip Saha
Principal Consultant
LinkedIn
Talk to Analyst

Find your sweet spots for generating winning opportunities in this market.

Talk to Analyst

What are the Emerging Trends in the Network Attached Storage (NAS) Market

Current network attached storage (NAS) market trends, such as the supply of network attached storage (NAS) solutions on a pay-as-you-go basis and SaaS models, in which service vendors also assume responsibility for data and application information maintenance, are accelerating acceptance of these solutions.

Several telecommunications service providers, including T-Mobile U.S., Inc., Nokia Corporation, AT&T, Telefonaktiebolaget LM Ericsson, and Telefonica S.A., have invested in 5G service installations. The demand for network attached storage (NAS) solutions and the development of smart cities, manufacturing, and agriculture is being driven by increased investment in 5G technology and the sale of millions of gadgets. 

In addition, there is a growing demand for a variety of smart applications, such as smart city projects and smart homes, to be connected to the cloud, which generates a large amount of data. The network attached storage (NAS) market share has grown due to an increase in the sales of linked smart devices around the world, as well as an increase in internet penetration.

Furthermore, the sales of network attached storage (NAS) solutions are growing as it reduces the capital expenditure required to establish the infrastructure needed in business premises.

How are Some Challenges Stifling Network Attached Storage (NAS) Market Growth

As network attached storage (NAS) is a type of storage connected to a computer system and delivers file services, cyber attackers can access this data, posing a cyber security concern. This is anticipated to be a challenge that might hamper the growth of the network attached storage (NAS) market during the forecast period.

Data security and privacy are critical characteristics for network-connected storage systems servers and hardware. Failing to provide data security, the network attached storage (NAS) market is likely to face challenges throughout the forecast period.

MarketNage
Become a MarketNgage Insider

A unified Market Research Subscription Platform, built for today's disparate research needs.

Comparative View of Adjacent Network Attached Storage (NAS) Market

Network Attached Storage (NAS) Market:

Attributes

Network Attached Storage (NAS) Market

CAGR

(2022-2032)

14.2%

Market Value

(2026)

US$ 52.73 Bn

Growth Factor

The rapid adoption of next-generation wireless internet technology, and an increase in business digital transformation journeys.

Opportunity

Several suppliers are striving to combine the existing NAS system with popular cloud storage services for storage provisioning.

Key Trends

Deployment of pay-as-you-go network attached storage (NAS) systems and SaaS models

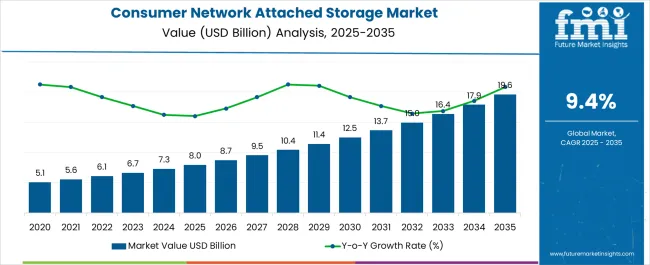
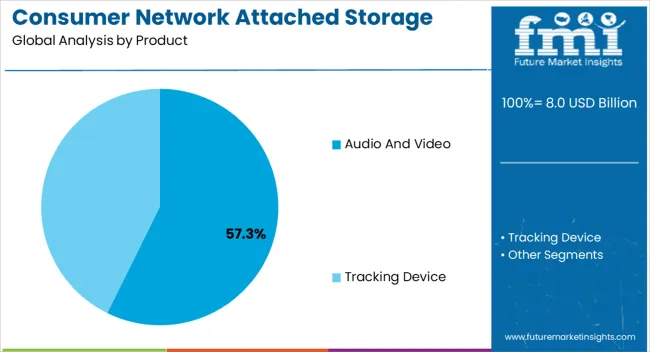
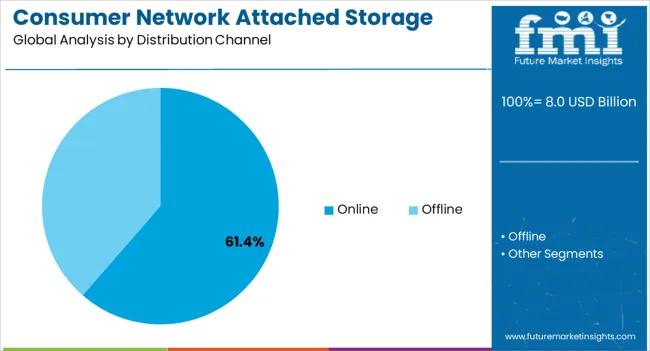
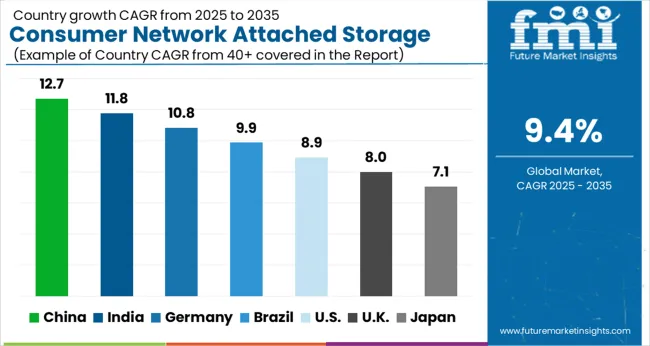
Consumer Network Attached Storage (NAS) Market:

Attributes

Consumer Network Attached Storage (NAS) Market

CAGR

(2022-2032)

13%

Market Value

(2026)

US$ 6.25 Bn

Growth Factor

The rising popularity of network attached storage as a way of accomplishing cost-effective data storage solutions is a primary driver of market growth.

Opportunity

The use of network attached storage devices can help companies and small company owners lower their total cost of ownership.

Key Trends

The market is growing due to an increase in overall backup operation efficiency with server-less backup provided by network attached storage systems architecture.

Multiprotocol Storage Market:

Attributes

Multiprotocol Storage Market

CAGR

(2022-2032)

11.51%

Market Value

(2026)

US$ 5.26 Bn

Growth Factor

The growing number of technological developments and advancements around the world are expected to propel the industry forward.

Opportunity

Due to increased investments by ICT and Telecom sectors in research and development activities related to digital transformation.

Key Trends

The arrival of 5G, along with other technologies such as AR, VR, MR, and the rapidly increasing Internet of Things (IoT), are some of the trends in multiprotocol storage market.

The network attached storage (NAS) market share is growing due to the rising demand for large amounts of multimedia material generated by consumer mobile devices such as smartphones, laptops, tablets, and smart gadgets.

COVID-19 regulations around the world have fueled the rise of the work-from-home trend in a variety of industries. As the number of people working from home grows, so does the demand for intelligent and adaptable storage solutions. The COVID-19 pandemic restrictions had a favorable impact on the network attached storage (NAS) market revenue. 

For consumer-level applications, the NAS system can be used as a home backup device, a mail server, a media streamer, a video surveillance recorder, or a website hosting device.

The network attached storage (NAS) system is simple to set up and provides cost-effective storage and backup options.

Furthermore, as hybrid cloud storage becomes more popular, demand for cutting-edge NAS solutions is likely to increase. As a result, the network-attached storage (NAS) industry is projected to have more prospects to grow in the coming years. 

The lack of sufficient infrastructure to utilise and safeguard data, on the other hand, may lead to a significant hurdle to the network-attached storage (NAS) market's growth in the near future.

Segment-wise Insights

What is the Segmentation Outlook for the Network Attached Storage (NAS) Market?

By design, 1 bay to 8 bays segment is predicted to dominate the network-attached storage (NAS) market with a CAGR of 14.0% during 2022-2032. This is due to the increased use of 1-bay to 8-bay NAS solutions by small and medium-sized organisations, homes, education and research centres, media and entertainment companies, and business and consulting service providers.

Increased demand for 1-bay to 8-bay NAS solutions is being driven by an increase in the volume of data generated across various industries.

Which Segment is Likely to Lead the Network Attached Storage (NAS) Market By Product Type?

During the forecast period, the midmarket NAS solutions segment is projected to expand at a CAGR of 14.2%, and this trend is expected to continue in the near future. The rise of digital media was fueled by the rising use of smart devices such as smartphones and tablets.

NAS systems are used by consumers for home monitoring, backup, and media streaming devices. Furthermore, midmarket NAS solutions are excellent and cost-effective for small and medium-sized organizations.

Region-wise Outlook

What is the Regional Demand Analysis in the Network Attached Storage (NAS) Market?

Regions

CAGR (2022-2032)

US Market

13.9%

UK Market

12.8%

China Market

13.5%

Japan Market

12.4%

South Korea Market

11.7%

During the forecast period, the North American network-attached storage (NAS) market is projected to have the biggest share. The network-attached storage (NAS) market is growing due to increased investment in wireless technology by both private and public companies in this region.  

Several telecom companies have also announced plans to build 5G networks across the country. It sparked a demand for sophisticated storage systems to handle the large amounts of data generated by linked devices using wireless technologies.

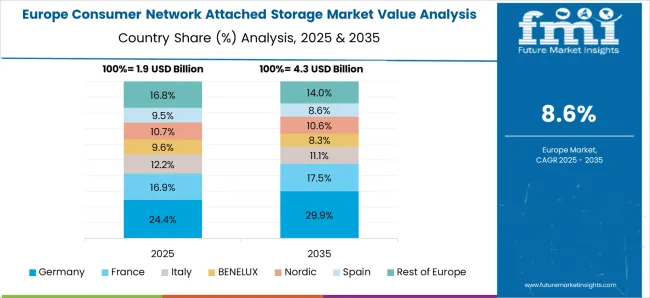
During the predicted period, Europe network-attached storage (NAS) market is expected to increase at a significant rate. This is due to an increase in the number of connected devices and the generation of large amounts of data. In addition, due to rising digitalization among organisations and consumers, Europe has the highest fixed broadband connection adoption rates.

According to the International Telecommunication Union (ITU), fixed-broadband penetration in Europe is expected to reach 32.9 percent in 2032, a significant increase over the global average of 15.2 percent. The growth in fixed broadband connections in a concentrated location of European countries has pushed up demand for network attached storage (NAS) solutions.

 During the projection period, the Asia Pacific network-attached storage (NAS) market is expected to rise at a considerable CAGR, providing promising prospects for market growth. This is primarily due to the increasing use of linked gadgets like smartphones. IoT devices are driving regional market growth.

Competitive Landscape

The network-attached storage (NAS) market is fragmented. Historically, the main players dominated the network-attached storage (NAS) market. However, businesses' increased demand for data storage is drawing a slew of new participants to the industry, making it more competitive.

Recent Developments in the Network Attached Storage (NAS) Market:

  •  QNAP Systems Inc. published the QTS 4.4.2 NAS operating system in April 2020. QTS 4.4.2 improves system security, scalability, and storage expandability with physical JBOD units to meet file storage and backup requirements.
  • Talon Storage (US), a leader in next-generation software-defined storage solutions, was bought by NetApp Inc. in March 2020 to enable global organizations to centralize and consolidate IT storage infrastructure to public clouds.
  •  Synology Inc. released the DiskStation DS420j (a 4-bay NAS server) in January 2020, file synchronization and sharing solution designed to meet the needs of residential customers.
  • Synology Inc. and the Taiwan Computer Emergency Response Team/Coordination Center (TWCERT/CC) teamed up with worldwide cybersecurity organisations in August 2019 to safeguard businesses from ransomware attacks.

Key Players

  • Dell Technologies Inc.(U.S.)
  • Western Digital Corporation (U.S.)
  • Synology, Inc.  (Taiwan)
  • QNAP Systems, Inc. (Taiwan)
  • NetApp, Inc. (U.S.)
  • Hewlett Packard Enterprise Company (HPE) (U.S.)
  • Hitachi, Ltd.  (Japan)
  • Seagate Technology Public Limited Company (PLC) (U.S.)
  • NETGEAR, Inc. (U.S.)
  • Buffalo Americas, Inc. (U.S.)

Key Segments

By Design:

  • 1Bay to 8 Bays
  • 8 Bays to 12 Bays
  • 12 Bays to 20 Bays
  • More than 20-bays

By Product:

  • Enterprise NAS Solutions
  • Midmarket NAS Solutions

 By Storage Solution:

  • Scale-up NAS
  • Scale-out NAS

By Deployment Type:

  • On-premises
  • Remote
  • Hybrid

By End-user Industry:

  • Banking, Financial Services, and Insurance (BFSI)
  • Consumer goods and retail
  • Telecommunications and ITES
  • Healthcare
  • Energy
  • Government
  • Education and research
  • Media and entertainment
  • Manufacturing
  • Business and consulting
  • Others (aerospace & defense, automotive, food processing, and logistics)

Components:

  • Hardware
  • Software

By Region:

  • North America 
  • Europe
  • APAC    
  • Middle East and Africa (MEA)    
  • Latin America

Frequently Asked Questions

The network attached storage (NAS) market is projected to rise at a CAGR of 14.2% during the projected period.

The global network attached storage (NAS) market was valued at US$ 26.8 Bn in 2021.

The global network attached storage (NAS) market is likely to be worth nearly US$ 116.6 Bn by 2032.

North America is the leading region in the network attached storage (NAS) market.

The 1 bay 8 bays segment is predicted to dominate the network-attached storage (NAS) market.

Table of Content

1. Executive Summary

    1.1. Global Market Outlook 

    1.2. Summary of Statistics

    1.3. Key Market Characteristics & Attributes

    1.4. FMI Analysis and Recommendations

2. Market Overview

    2.1. Market Coverage / Taxonomy 

    2.2. Market Definition / Scope / Limitations

3. Market Risks and Trends Assessment 

    3.1. Risk Assessment 

        3.1.1. COVID-19 Crisis and Impact on Network Attached Storage Demand

        3.1.2. COVID-19 Impact Benchmark with Previous Crisis 

        3.1.3. Impact on Market Value (US$ Mn)

        3.1.4. Assessment by Key Countries

        3.1.5. Assessment by Key Market Segments

        3.1.6. Action Points and Recommendation for Suppliers

    3.2. Key Trends Impacting the Market

    3.3. Designulation and Product Development Trends

4. Market Background 

    4.1. Network Attached Storage (NAS) Market By Country, US$ Mn

    4.2. Network Attached Storage (NAS) Market Opportunity Assessment (US$ Mn)

        4.2.1. Total Available Market

        4.2.2. Serviceable Addressable Market

        4.2.3. Serviceable Obtainable Market

    4.3. Market Scenario Forecast 

        4.3.1. Demand in optimistic Scenario

        4.3.2. Demand in Likely Scenario

        4.3.3. Demand in Conservative Scenario 

    4.4. Investment Feasibility Analysis

        4.4.1. Investment in Established Markets

            4.4.1.1. In Short Term

            4.4.1.2. In Long Term

        4.4.2. Investment in Emerging Markets

            4.4.2.1. In Short Term

            4.4.2.2. In Long Term

    4.5. Forecast Factors - Relevance & Impact

        4.5.1. Top Companies Historical Growth

        4.5.2. Global Network Attached Storage (NAS) Market Growth

        4.5.3. Network Attached Storage Adoption Rate, by Country

    4.6. Market Dynamics

        4.6.1. Market Driving Factors and Impact Assessment

        4.6.2. Prominent Market Challenges and Impact Assessment

        4.6.3. Network Attached Storage (NAS) Market Opportunities

        4.6.4. Prominent Trends in the Global Market & Their Impact Assessment

5. Key Success Factors 

    5.1. Manufacturers’ Focus on Low Penetration High Growth Markets

    5.2. Banking on with Segments High Incremental Opportunity

    5.3. Peer Benchmarking 

6. Global Network Attached Storage (NAS) Market Demand Analysis 2015-2021 and Forecast, 2022-2032

    6.1. Historical Market Analysis, 2015-2021

    6.2. Current and Future Market Projections, 2022-2032

    6.3. Y-o-Y Growth Trend Analysis

7. Global Network Attached Storage (NAS) Market Value Analysis 2015-2021 and Forecast, 2022-2032

    7.1. Historical Market Value (US$ Mn) Analysis, 2015-2021

    7.2. Current and Future Market Value (US$ Mn) Projections, 2022-2032

        7.2.1. Y-o-Y Growth Trend Analysis

        7.2.2. Absolute $ Opportunity Analysis

8. Global Network Attached Storage (NAS) Market Analysis 2015-2021 and Forecast 2022-2032, By Design

    8.1. Introduction / Key Findings

    8.2. Historical Market Value (US$ Mn) and Analysis By Design, 2015-2021

    8.3. Current and Future Market Value (US$ Mn) and Analysis and Forecast By Design, 2022-2032

        8.3.1. 1 Bay to 8 Bays

        8.3.2. 8 Bays to 12 Bays

        8.3.3. 12 Bays to 20 Bays

        8.3.4. More than 20-bays

    8.4. Market Attractiveness Analysis By Design

9. Global Network Attached Storage (NAS) Market Analysis 2015-2021 and Forecast 2022-2032, By Product

    9.1. Introduction / Key Findings

    9.2. Historical Market Value (US$ Mn) and Analysis By Product, 2015-2021

    9.3. Current and Future Market Value (US$ Mn) and Analysis and Forecast By Product, 2022-2032

        9.3.1. Enterprise NAS Solutions

        9.3.2. Midmarket NAS Solutions

    9.4. Market Attractiveness Analysis By Product

10. Global Network Attached Storage (NAS) Market Analysis 2015-2021 and Forecast 2022-2032, By Storage Solution

    10.1. Introduction / Key Findings

    10.2. Historical Market Value (US$ Mn) and Analysis By Storage Solution, 2015-2021

    10.3. Current and Future Market Value (US$ Mn) and Analysis and Forecast By Storage Solution, 2022-2032

        10.3.1. Scale-up NAS

        10.3.2. Scale-out NAS

    10.4. Market Attractiveness Analysis By Storage Solution

11. Global Network Attached Storage (NAS) Market Analysis 2015-2021 and Forecast 2022-2032, By Deployment Type

    11.1. Introduction / Key Findings

    11.2. Historical Market Value (US$ Mn) and Analysis By Deployment Type, 2015-2021

    11.3. Current and Future Market Value (US$ Mn) and Analysis and Forecast By Deployment Type, 2022-2032

        11.3.1. On-premises

        11.3.2. Remote

        11.3.3. Hybrid

    11.4. Market Attractiveness Analysis By Deployment Type

12. Global Network Attached Storage (NAS) Market Analysis 2015-2021 and Forecast 2022-2032, By End-user Industry

    12.1. Introduction / Key Findings

    12.2. Historical Market Value (US$ Mn) and Analysis By End-user Industry, 2015-2021

    12.3. Current and Future Market Value (US$ Mn) and Analysis and Forecast By End-user Industry, 2022-2032

        12.3.1. Banking, Financial Services, and Insurance (BFSI)

        12.3.2. Consumer goods and retail

        12.3.3. Telecommunications and ITES

        12.3.4. Healthcare

        12.3.5. Energy

        12.3.6. Government

        12.3.7. Education and research

        12.3.8. Media and entertainment

        12.3.9. Manufacturing

        12.3.10. Business and consulting

        12.3.11. Others (aerospace & defense, automotive, food processing, and logistics)

    12.4. Market Attractiveness Analysis By End-user Industry

13. Global Network Attached Storage (NAS) Market Analysis 2015-2021 and Forecast 2022-2032, By Components

    13.1. Introduction

    13.2. Historical Market Value (US$ Mn) and Analysis By Region, 2015-2021

    13.3. Current Market Size (US$ Mn) & Analysis and Forecast By Region, 2022-2032

        13.3.1. Hardware

        13.3.2. Software

    13.4. Market Attractiveness Analysis By Region

14. Global Network Attached Storage (NAS) Market Analysis 2015-2021 and Forecast 2022-2032, By Region

    14.1. Introduction

    14.2. Historical Market Value (US$ Mn) and Analysis By Region, 2015-2021

    14.3. Current Market Size (US$ Mn) & Analysis and Forecast By Region, 2022-2032

        14.3.1. North America

        14.3.2. Latin America

        14.3.3. Europe

        14.3.4. Asia Pacific

        14.3.5. Middle East and Africa (MEA)

    14.4. Market Attractiveness Analysis By Region

15. North America Network Attached Storage (NAS) Market Analysis 2015-2021 and Forecast 2022-2032

    15.1. Introduction

    15.2. Pricing Analysis

    15.3. Historical Market Value (US$ Mn) and Trend Analysis By Market Taxonomy, 2015-2021

    15.4. Market Value (US$ Mn) & Forecast By Market Taxonomy, 2022-2032

        15.4.1. By Country

            15.4.1.1. U.S.

            15.4.1.2. Canada

        15.4.2. By Storage Solution

        15.4.3. By Design

        15.4.4. By Product

        15.4.5. By Deployment Type

        15.4.6. By End-user Industry

        15.4.7. By Components 

    15.5. Market Attractiveness Analysis

        15.5.1. By Country

        15.5.2. By Storage Solution

        15.5.3. By Design

        15.5.4. By Product

        15.5.5. By Deployment Type

        15.5.6. By End-user Industry

        15.5.7. By Components  

16. Latin America Network Attached Storage (NAS) Market Analysis 2015-2021 and Forecast 2022-2032

    16.1. Introduction

    16.2. Pricing Analysis

    16.3. Historical Market Value (US$ Mn) and Trend Analysis By Market Taxonomy, 2015-2021

    16.4. Market Value (US$ Mn) & Forecast By Market Taxonomy, 2022-2032

        16.4.1. By Country

            16.4.1.1. Brazil

            16.4.1.2. Mexico

            16.4.1.3. Rest of Latin America

        16.4.2. By Storage Solution

        16.4.3. By Design

        16.4.4. By Product

        16.4.5. By Deployment Type

        16.4.6. By End-user Industry

        16.4.7. By Components 

    16.5. Market Attractiveness Analysis

        16.5.1. By Country

        16.5.2. By Storage Solution

        16.5.3. By Design

        16.5.4. By Product

        16.5.5. By Deployment Type

        16.5.6. By End-user Industry

        16.5.7. By Components 

17. Europe Network Attached Storage (NAS) Market Analysis 2015-2021 and Forecast 2022-2032

    17.1. Introduction

    17.2. Pricing Analysis

    17.3. Historical Market Value (US$ Mn) and Trend Analysis By Market Taxonomy, 2015-2021

    17.4. Market Value (US$ Mn) & Forecast By Market Taxonomy, 2022-2032

        17.4.1. By Country

            17.4.1.1. Germany

            17.4.1.2. France

            17.4.1.3. U.K.

            17.4.1.4. Italy

            17.4.1.5. Benelux

            17.4.1.6. Russia

            17.4.1.7. Rest of Europe

        17.4.2. By Storage Solution

        17.4.3. By Design

        17.4.4. By Product

        17.4.5. By Deployment Type

        17.4.6. By End-user Industry

        17.4.7. By Components 

    17.5. Market Attractiveness Analysis

        17.5.1. By Country

        17.5.2. By Storage Solution

        17.5.3. By Design

        17.5.4. By Product

        17.5.5. By Deployment Type

        17.5.6. By End-user Industry

        17.5.7. By Components  

18. Asia Pacific Network Attached Storage (NAS) Market Analysis 2015-2021 and Forecast 2022-2032

    18.1. Introduction

    18.2. Pricing Analysis

    18.3. Historical Market Value (US$ Mn) and Trend Analysis By Market Taxonomy, 2015-2021

    18.4. Market Value (US$ Mn) & Forecast By Market Taxonomy, 2022-2032

        18.4.1. By Country

            18.4.1.1. China

            18.4.1.2. Japan

            18.4.1.3. South Korea

            18.4.1.4. Rest of Asia Pacific

        18.4.2. By Storage Solution

        18.4.3. By Design

        18.4.4. By Product

        18.4.5. By Deployment Type

        18.4.6. By End-user Industry

        18.4.7. By Components 

    18.5. Market Attractiveness Analysis

        18.5.1. By Country

        18.5.2. By Storage Solution

        18.5.3. By Design

        18.5.4. By Product

        18.5.5. By Deployment Type

        18.5.6. By End-user Industry

        18.5.7. By Components 

19. Middle East and Africa Network Attached Storage (NAS) Market Analysis 2015-2021 and Forecast 2022-2032

    19.1. Introduction

    19.2. Pricing Analysis

    19.3. Historical Market Value (US$ Mn) and Trend Analysis By Market Taxonomy, 2015-2021

    19.4. Market Value (US$ Mn) & Forecast By Market Taxonomy, 2022-2032

        19.4.1. By Country

            19.4.1.1. GCC Countries

            19.4.1.2. South Africa

            19.4.1.3. Turkey

            19.4.1.4. Rest of Middle East and Africa

        19.4.2. By Storage Solution

        19.4.3. By Design

        19.4.4. By Product

        19.4.5. By Deployment Type

        19.4.6. By End-user Industry

        19.4.7. By Components 

    19.5. Market Attractiveness Analysis

        19.5.1. By Country

        19.5.2. By Storage Solution

        19.5.3. By Design

        19.5.4. By Product

        19.5.5. By Deployment Type

        19.5.6. By End-user Industry

        19.5.7. By Components 

20. Key Countries Network Attached Storage (NAS) Market Analysis 2015-2021 and Forecast 2022-2032

    20.1. Introduction

        20.1.1. Market Value Proportion Analysis, By Key Countries

        20.1.2. Global Vs. Country Growth Comparison

    20.2. US Network Attached Storage (NAS) Market Analysis

        20.2.1. Value Proportion Analysis by Market Taxonomy

        20.2.2. Value & Analysis and Forecast by Market Taxonomy, 2015-2032

            20.2.2.1. By Storage Solution

            20.2.2.2. By Design

            20.2.2.3. By Product

            20.2.2.4. By Deployment Type

            20.2.2.5. By End-user Industry

            20.2.2.6. By Components 

    20.3. Canada Network Attached Storage (NAS) Market Analysis

        20.3.1. Value Proportion Analysis by Market Taxonomy

        20.3.2. Value & Analysis and Forecast by Market Taxonomy, 2015-2032

            20.3.2.1. By Storage Solution

            20.3.2.2. By Design

            20.3.2.3. By Product

            20.3.2.4. By Deployment Type

            20.3.2.5. By End-user Industry

            20.3.2.6. By Components

    20.4. Mexico Network Attached Storage (NAS) Market Analysis

        20.4.1. Value Proportion Analysis by Market Taxonomy

        20.4.2. Value & Analysis and Forecast by Market Taxonomy, 2015-2032

            20.4.2.1. By Storage Solution

            20.4.2.2. By Design

            20.4.2.3. By Product

            20.4.2.4. By Deployment Type

            20.4.2.5. By End-user Industry

            20.4.2.6. By Components

    20.5. Brazil Network Attached Storage (NAS) Market Analysis

        20.5.1. Value Proportion Analysis by Market Taxonomy

        20.5.2. Value & Analysis and Forecast by Market Taxonomy, 2015-2032

            20.5.2.1. By Storage Solution

            20.5.2.2. By Design

            20.5.2.3. By Product

            20.5.2.4. By Deployment Type

            20.5.2.5. By End-user Industry

            20.5.2.6. By Components

    20.6. Germany Network Attached Storage (NAS) Market Analysis

        20.6.1. Value Proportion Analysis by Market Taxonomy

        20.6.2. Value & Analysis and Forecast by Market Taxonomy, 2015-2032

            20.6.2.1. By Storage Solution

            20.6.2.2. By Design

            20.6.2.3. By Product

            20.6.2.4. By Deployment Type

            20.6.2.5. By End-user Industry

            20.6.2.6. By Components

    20.7. France Network Attached Storage (NAS) Market Analysis

        20.7.1. Value Proportion Analysis by Market Taxonomy

        20.7.2. Value & Analysis and Forecast by Market Taxonomy, 2015-2032

            20.7.2.1. By Storage Solution

            20.7.2.2. By Design

            20.7.2.3. By Product

            20.7.2.4. By Deployment Type

            20.7.2.5. By End-user Industry

            20.7.2.6. By Components

    20.8. Italy Network Attached Storage (NAS) Market Analysis

        20.8.1. Value Proportion Analysis by Market Taxonomy

        20.8.2. Value & Analysis and Forecast by Market Taxonomy, 2015-2032

            20.8.2.1. By Storage Solution

            20.8.2.2. By Design

            20.8.2.3. By Product

            20.8.2.4. By Deployment Type

            20.8.2.5. By End-user Industry

            20.8.2.6. By Components  

    20.9. Russia Network Attached Storage (NAS) Market Analysis

        20.9.1. Value Proportion Analysis by Market Taxonomy

        20.9.2. Value & Analysis and Forecast by Market Taxonomy, 2015-2032

            20.9.2.1. By Storage Solution

            20.9.2.2. By Design

            20.9.2.3. By Product

            20.9.2.4. By Deployment Type

            20.9.2.5. By End-user Industry

            20.9.2.6. By Components

    20.10. UK Network Attached Storage (NAS) Market Analysis

        20.10.1. Value Proportion Analysis by Market Taxonomy

        20.10.2. Value & Analysis and Forecast by Market Taxonomy, 2015-2032

            20.10.2.1. By Storage Solution

            20.10.2.2. By Design

            20.10.2.3. By Product

            20.10.2.4. By Deployment Type

            20.10.2.5. By End-user Industry

            20.10.2.6. By Components

    20.11. Benelux Network Attached Storage (NAS) Market Analysis

        20.11.1. Value Proportion Analysis by Market Taxonomy

        20.11.2. Value & Analysis and Forecast by Market Taxonomy, 2015-2032

            20.11.2.1. By Storage Solution

            20.11.2.2. By Design

            20.11.2.3. By Product

            20.11.2.4. By Deployment Type

            20.11.2.5. By End-user Industry

            20.11.2.6. By Components

    20.12. China Network Attached Storage (NAS) Market Analysis

        20.12.1. Value Proportion Analysis by Market Taxonomy

        20.12.2. Value & Analysis and Forecast by Market Taxonomy, 2015-2032

            20.12.2.1. By Storage Solution

            20.12.2.2. By Design

            20.12.2.3. By Product

            20.12.2.4. By Deployment Type

            20.12.2.5. By End-user Industry

            20.12.2.6. By Components

    20.13. Japan Network Attached Storage (NAS) Market Analysis

        20.13.1. Value Proportion Analysis by Market Taxonomy

        20.13.2. Value & Analysis and Forecast by Market Taxonomy, 2015-2032

            20.13.2.1. By Storage Solution

            20.13.2.2. By Design

            20.13.2.3. By Product

            20.13.2.4. By Deployment Type

            20.13.2.5. By End-user Industry

            20.13.2.6. By Components

    20.14. South Korea Network Attached Storage (NAS) Market Analysis

        20.14.1. Value Proportion Analysis by Market Taxonomy

        20.14.2. Value & Analysis and Forecast by Market Taxonomy, 2015-2032

            20.14.2.1. By Storage Solution

            20.14.2.2. By Design

            20.14.2.3. By Product

            20.14.2.4. By Deployment Type

            20.14.2.5. By End-user Industry

            20.14.2.6. By Components

    20.15. GCC Countries Network Attached Storage (NAS) Market Analysis

        20.15.1. Value Proportion Analysis by Market Taxonomy

        20.15.2. Value & Analysis and Forecast by Market Taxonomy, 2015-2032

            20.15.2.1. By Storage Solution

            20.15.2.2. By Design

            20.15.2.3. By Product

            20.15.2.4. By Deployment Type

            20.15.2.5. By End-user Industry

            20.15.2.6. By Components

    20.16. South Africa Network Attached Storage (NAS) Market Analysis

        20.16.1. Value Proportion Analysis by Market Taxonomy

        20.16.2. Value & Analysis and Forecast by Market Taxonomy, 2015-2032

            20.16.2.1. By Storage Solution

            20.16.2.2. By Design

            20.16.2.3. By Product

            20.16.2.4. By Deployment Type

            20.16.2.5. By End-user Industry

            20.16.2.6. By Components

    20.17. Turkey Network Attached Storage (NAS) Market Analysis

        20.17.1. Value Proportion Analysis by Market Taxonomy

        20.17.2. Value & Analysis and Forecast by Market Taxonomy, 2015-2032

            20.17.2.1. By Storage Solution

            20.17.2.2. By Design

            20.17.2.3. By Product

            20.17.2.4. By Deployment Type

            20.17.2.5. By End-user Industry

            20.17.2.6. By Components

        20.17.3. Competition Landscape and Player Concentration in the Country

21. Market Structure Analysis

    21.1. Market Analysis by Tier of Companies 

    21.2. Market Concentration

    21.3. Market Share Analysis of Top Players

    21.4. Market Presence Analysis

        21.4.1. By Regional footprint of Players

        21.4.2. Product footprint by Players

22. Competition Analysis

    22.1. Competition Dashboard

    22.2. Competition Benchmarking

    22.3. Competition Deep Dive 

        22.3.1. DELL TECHNOLOGIES INC.

            22.3.1.1. Overview

            22.3.1.2. Product Portfolio

            22.3.1.3. Sales Footprint

            22.3.1.4. Strategy Overview

        22.3.2. NETAPP, INC.

            22.3.2.1. Overview

            22.3.2.2. Product Portfolio

            22.3.2.3. Sales Footprint

            22.3.2.4. Strategy Overview

        22.3.3. HEWLETT PACKARD ENTERPRISE COMPANY (HPE)

            22.3.3.1. Overview

            22.3.3.2. Product Portfolio

            22.3.3.3. Sales Footprint

            22.3.3.4. Strategy Overview

        22.3.4. HITACHI, LTD.

            22.3.4.1. Overview

            22.3.4.2. Product Portfolio

            22.3.4.3. Sales Footprint

            22.3.4.4. Strategy Overview

        22.3.5. WESTERN DIGITAL CORPORATION

            22.3.5.1. Overview

            22.3.5.2. Product Portfolio

            22.3.5.3. Sales Footprint

            22.3.5.4. Strategy Overview

        22.3.6. SEAGATE TECHNOLOGY PUBLIC LIMITED COMPANY (PLC)

            22.3.6.1. Overview

            22.3.6.2. Product Portfolio

            22.3.6.3. Sales Footprint

            22.3.6.4. Strategy Overview

        22.3.7. NETGEAR, INC.

            22.3.7.1. Overview

            22.3.7.2. Product Portfolio

            22.3.7.3. Sales Footprint

            22.3.7.4. Strategy Overview

        22.3.8. SYNOLOGY, INC.

            22.3.8.1. Overview

            22.3.8.2. Product Portfolio

            22.3.8.3. Sales Footprint

            22.3.8.4. Strategy Overview

        22.3.9. QNAP SYSTEMS INC.

            22.3.9.1. Overview

            22.3.9.2. Product Portfolio

            22.3.9.3. Sales Footprint

            22.3.9.4. Strategy Overview

        22.3.10. DROBO, INC.

            22.3.10.1. Overview

            22.3.10.2. Product Portfolio

            22.3.10.3. Sales Footprint

            22.3.10.4. Strategy Overview

        22.3.11. IBM

            22.3.11.1. Overview

            22.3.11.2. Product Portfolio

            22.3.11.3. Sales Footprint

            22.3.11.4. Strategy Overview

23. Assumptions and Acronyms Used

24. Research Methodology
Customize this Report

Let us know your requirement to get
100% FREE customization

List of Tables

Table 1: Global Network Attached Storage (NAS) Market Value (US$ Mn),By Components , 2015 – 2021

Table 2: Global Network Attached Storage (NAS) Market Value (US$ Mn),By Components , 2022 – 2032

Table 3: Global Network Attached Storage (NAS) Market Value (US$ Mn), By Design, 2015 – 2021

Table 4: Global Network Attached Storage (NAS) Market Value (US$ Mn), By Design, 2022 – 2032

Table 5: Global Network Attached Storage (NAS) Market Value (US$ Mn), By Storage Solution, 2015 – 2021

Table 6: Global Network Attached Storage (NAS) Market Value (US$ Mn), By Storage Solution, 2022 – 2032

Table 7: Global Network Attached Storage (NAS) Market Value (US$ Mn), By Product, 2015 – 2021

Table 8: Global Network Attached Storage (NAS) Market Value (US$ Mn), By Product, 2022 – 2032

Table 9: Global Network Attached Storage (NAS) Market Value (US$ Mn), By Deployment Type, 2015 – 2021

Table 10: Global Network Attached Storage (NAS) Market Value (US$ Mn), By Deployment Type, 2022 – 2032

Table 11: Global Network Attached Storage (NAS) Market Value (US$ Mn), By End-user Industry, 2015 – 2021

Table 12: Global Network Attached Storage (NAS) Market Value (US$ Mn), By End-user Industry, 2022 – 2032

Table 13: Global Network Attached Storage (NAS) Market, By Region, 2015 – 2021

Table 14: Global Network Attached Storage (NAS) Market, By Region, 2022 – 2032

Table 15: North America Network Attached Storage (NAS) Market Value (US$ Mn),By Components , 2015 – 2021

Table 16: North America Network Attached Storage (NAS) Market Value (US$ Mn),By Components , 2022 – 2032

Table 17: North America Network Attached Storage (NAS) Market Value (US$ Mn), By Design, 2015 – 2021

Table 18: North America Network Attached Storage (NAS) Market Value (US$ Mn), By Design, 2022 – 2032

Table 19: North America Network Attached Storage (NAS) Market Value (US$ Mn), By Storage Solution, 2015 – 2021

Table 20: North America Network Attached Storage (NAS) Market Value (US$ Mn), By Storage Solution, 2022 – 2032

Table 21: North America Network Attached Storage (NAS) Market Value (US$ Mn), By Product, 2015 – 2021

Table 22: North America Network Attached Storage (NAS) Market Value (US$ Mn), By Product, 2022 – 2032

Table 23: North America Network Attached Storage (NAS) Market Value (US$ Mn), By Deployment Type, 2015 – 2021

Table 24: North America Network Attached Storage (NAS) Market Value (US$ Mn), By Deployment Type, 2022 – 2032

Table 25: North America Network Attached Storage (NAS) Market Value (US$ Mn), By End-user Industry, 2015 – 2021

Table 26: North America Network Attached Storage (NAS) Market Value (US$ Mn), By End-user Industry, 2022 – 2032

Table 27: North America Network Attached Storage (NAS) Market, By Country, 2015 – 2021

Table 28: North America Network Attached Storage (NAS) Market, By Country, 2022 – 2032

Table 29: Latin America Network Attached Storage (NAS) Market Value (US$ Mn),By Components , 2015 – 2021

Table 30: Latin America Network Attached Storage (NAS) Market Value (US$ Mn),By Components , 2022 – 2032

Table 31: Latin America Network Attached Storage (NAS) Market Value (US$ Mn), By Design, 2015 – 2021

Table 32: Latin America Network Attached Storage (NAS) Market Value (US$ Mn), By Design, 2022 – 2032

Table 33: Latin America Network Attached Storage (NAS) Market Value (US$ Mn), By Storage Solution, 2015 – 2021

Table 34: Latin America Network Attached Storage (NAS) Market Value (US$ Mn), By Storage Solution, 2022 – 2032

Table 35: Latin America Network Attached Storage (NAS) Market Value (US$ Mn), By Product, 2015 – 2021

Table 36: Latin America Network Attached Storage (NAS) Market Value (US$ Mn), By Product, 2022 – 2032

Table 37: Latin America Network Attached Storage (NAS) Market Value (US$ Mn), By Deployment Type, 2015 – 2021

Table 38: Latin America Network Attached Storage (NAS) Market Value (US$ Mn), By Deployment Type, 2022 – 2032

Table 39: Latin America Network Attached Storage (NAS) Market Value (US$ Mn), By End-user Industry, 2015 – 2021

Table 40: Latin America Network Attached Storage (NAS) Market Value (US$ Mn), By End-user Industry, 2022 – 2032

Table 41: Latin America Network Attached Storage (NAS) Market, By Country, 2015 – 2021

Table 42: Latin America Network Attached Storage (NAS) Market, By Country, 2022 – 2032

Table 43: Europe Network Attached Storage (NAS) Market Value (US$ Mn),By Components , 2015 – 2021

Table 44: Europe Network Attached Storage (NAS) Market Value (US$ Mn),By Components , 2022 – 2032

Table 45: Europe Network Attached Storage (NAS) Market Value (US$ Mn), By Design, 2015 – 2021

Table 46: Europe Network Attached Storage (NAS) Market Value (US$ Mn), By Design, 2022 – 2032

Table 47: Europe Network Attached Storage (NAS) Market Value (US$ Mn), By Storage Solution, 2015 – 2021

Table 48: Europe Network Attached Storage (NAS) Market Value (US$ Mn), By Storage Solution, 2022 – 2032

Table 49: Europe Network Attached Storage (NAS) Market Value (US$ Mn), By Product, 2015 – 2021

Table 50: Europe Network Attached Storage (NAS) Market Value (US$ Mn), By Product, 2022 – 2032

Table 51: Europe Network Attached Storage (NAS) Market Value (US$ Mn), By Deployment Type, 2015 – 2021

Table 52: Europe Network Attached Storage (NAS) Market Value (US$ Mn), By Deployment Type, 2022 – 2032

Table 53: Europe Network Attached Storage (NAS) Market Value (US$ Mn), By End-user Industry, 2015 – 2021

Table 54: Europe Network Attached Storage (NAS) Market Value (US$ Mn), By End-user Industry, 2022 – 2032

Table 55: Europe Network Attached Storage (NAS) Market, By Country, 2015 – 2021

Table 56: Europe Network Attached Storage (NAS) Market, By Country, 2022 – 2032

Table 57: Asia Pacific Network Attached Storage (NAS) Market Value (US$ Mn),By Components , 2015 – 2021

Table 58: Asia Pacific Network Attached Storage (NAS) Market Value (US$ Mn),By Components , 2022 – 2032

Table 59: Asia Pacific Network Attached Storage (NAS) Market Value (US$ Mn), By Design, 2015 – 2021

Table 60: Asia Pacific Network Attached Storage (NAS) Market Value (US$ Mn), By Design, 2022 – 2032

Table 61: Asia Pacific Network Attached Storage (NAS) Market Value (US$ Mn), By Storage Solution, 2015 – 2021

Table 62: Asia Pacific Network Attached Storage (NAS) Market Value (US$ Mn), By Storage Solution, 2022 – 2032

Table 63: Asia Pacific Network Attached Storage (NAS) Market Value (US$ Mn), By Product, 2015 – 2021

Table 64: Asia Pacific Network Attached Storage (NAS) Market Value (US$ Mn), By Product, 2022 – 2032

Table 65: Asia Pacific Network Attached Storage (NAS) Market Value (US$ Mn), By Deployment Type, 2015 – 2021

Table 66: Asia Pacific Network Attached Storage (NAS) Market Value (US$ Mn), By Deployment Type, 2022 – 2032

Table 67: Asia Pacific Network Attached Storage (NAS) Market Value (US$ Mn), By End-user Industry, 2015 – 2021

Table 68: Asia Pacific Network Attached Storage (NAS) Market Value (US$ Mn), By End-user Industry, 2022 – 2032

Table 69: Asia Pacific Network Attached Storage (NAS) Market, By Country, 2015 – 2021

Table 70: Asia Pacific Network Attached Storage (NAS) Market, By Country, 2022 – 2032

Table 71: MEA Network Attached Storage (NAS) Market Value (US$ Mn),By Components , 2015 – 2021

Table 72: MEA Network Attached Storage (NAS) Market Value (US$ Mn),By Components , 2022 – 2032

Table 73: MEA Network Attached Storage (NAS) Market Value (US$ Mn), By Design, 2015 – 2021

Table 74: MEA Network Attached Storage (NAS) Market Value (US$ Mn), By Design, 2022 – 2032

Table 75: MEA Network Attached Storage (NAS) Market Value (US$ Mn), By Storage Solution, 2015 – 2021

Table 76: MEA Network Attached Storage (NAS) Market Value (US$ Mn), By Storage Solution, 2022 – 2032

Table 77: MEA Network Attached Storage (NAS) Market Value (US$ Mn), By Product, 2015 – 2021

Table 78: MEA Network Attached Storage (NAS) Market Value (US$ Mn), By Product, 2022 – 2032

Table 79: MEA Network Attached Storage (NAS) Market Value (US$ Mn), By Deployment Type, 2015 – 2021

Table 80: MEA Network Attached Storage (NAS) Market Value (US$ Mn), By Deployment Type, 2022 – 2032

Table 81: MEA Network Attached Storage (NAS) Market Value (US$ Mn), By End-user Industry, 2015 – 2021

Table 82: MEA Network Attached Storage (NAS) Market Value (US$ Mn), By End-user Industry, 2022 – 2032

Table 83: MEA Network Attached Storage (NAS) Market, By Country, 2015 – 2021

Table 84: MEA Network Attached Storage (NAS) Market, By Country, 2022 – 2032
Sudip Saha
Principal Consultant
LinkedIn
Talk to Analyst

Find your sweet spots for generating winning opportunities in this market.

Talk to Analyst

List of Charts

Figure 1: Global Network Attached Storage (NAS) Market Value (US$ Mn) and Year-on-Year Growth, 2015-2032

Figure 2: Global Network Attached Storage (NAS) Market Absolute $ Historical Gain (2015 - 2021) and Opportunity (2022 – 2032), US$ Mn

Figure 3: Global Network Attached Storage (NAS) Market Share,By Components , 2022 & 2032

Figure 4: Global Network Attached Storage (NAS) Market Y-o-Y Growth Projections,By Components  – 2022-2032

Figure 5: Global Network Attached Storage (NAS) Market Attractiveness Index,By Components  – 2022-2032

Figure 6: Global Network Attached Storage (NAS) Market Share, By Design, 2022 & 2032

Figure 7: Global Network Attached Storage (NAS) Market Y-o-Y Growth Projections, By Design – 2022-2032

Figure 8: Global Network Attached Storage (NAS) Market Attractiveness Index, By Design – 2022-2032

Figure 9: Global Network Attached Storage (NAS) Market Share, By Product, 2022 & 2032

Figure 10: Global Network Attached Storage (NAS) Market Y-o-Y Growth Projections, By Product – 2022-2032

Figure 11: Global Network Attached Storage (NAS) Market Attractiveness Index, By Product – 2022-2032

Figure 12: Global Network Attached Storage (NAS) Market Share, By End-user Industry, 2022 & 2032

Figure 13: Global Network Attached Storage (NAS) Market Y-o-Y Growth Projections, By End-user Industry – 2022-2032

Figure 14: Global Network Attached Storage (NAS) Market Attractiveness Index, By End-user Industry – 2022-2032

Figure 15: Global Network Attached Storage (NAS) Market Share, By Storage Solution, 2022 & 2032

Figure 16: Global Network Attached Storage (NAS) Market Y-o-Y Growth Projections, By Storage Solution – 2022-2032

Figure 17: Global Network Attached Storage (NAS) Market Attractiveness Index, By Storage Solution – 2022-2032

Figure 18: Global Network Attached Storage (NAS) Market Share, By Deployment Type, 2022 & 2032

Figure 19: Global Network Attached Storage (NAS) Market Y-o-Y Growth Projections, By Deployment Type – 2022-2032

Figure 20: Global Network Attached Storage (NAS) Market Attractiveness Index, By Deployment Type – 2022-2032

Figure 21: Global Network Attached Storage (NAS) Market Share, By Region, 2022 & 2032

Figure 22: Global Network Attached Storage (NAS) Market Y-o-Y Growth Projections, By Region – 2022-2032

Figure 23: Global Network Attached Storage (NAS) Market Attractiveness Index, By Region – 2022-2032

Figure 24: North America Network Attached Storage (NAS) Market Value (US$ Mn) and Year-on-Year Growth, 2015-2032

Figure 25: North America Network Attached Storage (NAS) Market Absolute $ Historical Gain (2015 - 2021) and Opportunity (2022 – 2032), US$ Mn

Figure 26: North America Network Attached Storage (NAS) Market Share,By Components , 2022 & 2032

Figure 27: North America Network Attached Storage (NAS) Market Y-o-Y Growth Projections,By Components  – 2022-2032

Figure 28: North America Network Attached Storage (NAS) Market Attractiveness Index,By Components  – 2022-2032

Figure 29: North America Network Attached Storage (NAS) Market Share, By Design, 2022 & 2032

Figure 30: North America Network Attached Storage (NAS) Market Y-o-Y Growth Projections, By Design – 2022-2032

Figure 31: North America Network Attached Storage (NAS) Market Attractiveness Index, By Design – 2022-2032

Figure 32: North America Network Attached Storage (NAS) Market Share, By Product, 2022 & 2032

Figure 33: North America Network Attached Storage (NAS) Market Y-o-Y Growth Projections, By Product – 2022-2032

Figure 34: North America Network Attached Storage (NAS) Market Attractiveness Index, By Product – 2022-2032

Figure 35: North America Network Attached Storage (NAS) Market Share, By Storage Solution, 2022 & 2032

Figure 36: North America Network Attached Storage (NAS) Market Y-o-Y Growth Projections, By Storage Solution – 2022-2032

Figure 37: North America Network Attached Storage (NAS) Market Attractiveness Index, By Storage Solution – 2022-2032

Figure 38: North America Network Attached Storage (NAS) Market Share, By Deployment Type, 2022 & 2032

Figure 39: North America Network Attached Storage (NAS) Market Y-o-Y Growth Projections, By Deployment Type – 2022-2032

Figure 40: North America Network Attached Storage (NAS) Market Attractiveness Index, By Deployment Type – 2022-2032

Figure 41: North America Network Attached Storage (NAS) Market Share, By End-user Industry, 2022 & 2032

Figure 42: North America Network Attached Storage (NAS) Market Y-o-Y Growth Projections, By End-user Industry – 2022-2032

Figure 43: North America Network Attached Storage (NAS) Market Attractiveness Index, By End-user Industry – 2022-2032

Figure 44: North America Network Attached Storage (NAS) Market Share, By Country, 2022 & 2032

Figure 45: North America Network Attached Storage (NAS) Market Y-o-Y Growth Projections, By Country – 2022-2032

Figure 46: North America Network Attached Storage (NAS) Market Attractiveness Index, By Country – 2022-2032

Figure 47: Latin America Network Attached Storage (NAS) Market Value (US$ Mn) and Year-on-Year Growth, 2015-2032

Figure 48: Latin America Network Attached Storage (NAS) Market Absolute $ Historical Gain (2015 - 2021) and Opportunity (2022 – 2032), US$ Mn

Figure 49: Latin America Network Attached Storage (NAS) Market Share,By Components , 2022 & 2032

Figure 50: Latin America Network Attached Storage (NAS) Market Y-o-Y Growth Projections,By Components  – 2022-2032

Figure 51: Latin America Network Attached Storage (NAS) Market Attractiveness Index,By Components  – 2022-2032

Figure 52: Latin America Network Attached Storage (NAS) Market Share, By Design, 2022 & 2032

Figure 53: Latin America Network Attached Storage (NAS) Market Y-o-Y Growth Projections, By Design – 2022-2032

Figure 54: Latin America Network Attached Storage (NAS) Market Attractiveness Index, By Design – 2022-2032

Figure 55: Latin America Network Attached Storage (NAS) Market Share, By Product, 2022 & 2032

Figure 56: Latin America Network Attached Storage (NAS) Market Y-o-Y Growth Projections, By Product – 2022-2032

Figure 57: Latin America Network Attached Storage (NAS) Market Attractiveness Index, By Product – 2022-2032

Figure 58: Latin America Network Attached Storage (NAS) Market Share, By Storage Solution, 2022 & 2032

Figure 59: Latin America Network Attached Storage (NAS) Market Y-o-Y Growth Projections, By Storage Solution – 2022-2032

Figure 60: Latin America Network Attached Storage (NAS) Market Attractiveness Index, By Storage Solution – 2022-2032

Figure 61: Latin America Network Attached Storage (NAS) Market Share, By Deployment Type, 2022 & 2032

Figure 62: Latin America Network Attached Storage (NAS) Market Y-o-Y Growth Projections, By Deployment Type – 2022-2032

Figure 63: Latin America Network Attached Storage (NAS) Market Attractiveness Index, By Deployment Type – 2022-2032

Figure 64: Latin America Network Attached Storage (NAS) Market Share, By End-user Industry, 2022 & 2032

Figure 65: Latin America Network Attached Storage (NAS) Market Y-o-Y Growth Projections, By End-user Industry – 2022-2032

Figure 66: Latin America Network Attached Storage (NAS) Market Attractiveness Index, By End-user Industry – 2022-2032

Figure 67: Latin America Network Attached Storage (NAS) Market Share, By Country, 2022 & 2032

Figure 68: Latin America Network Attached Storage (NAS) Market Y-o-Y Growth Projections, By Country – 2022-2032

Figure 69: Latin America Network Attached Storage (NAS) Market Attractiveness Index, By Country – 2022-2032

Figure 70: Europe Network Attached Storage (NAS) Market Value (US$ Mn) and Year-on-Year Growth, 2015-2032

Figure 71: Europe Network Attached Storage (NAS) Market Absolute $ Historical Gain (2015 - 2021) and Opportunity (2022 – 2032), US$ Mn

Figure 72: Europe Network Attached Storage (NAS) Market Share,By Components , 2022 & 2032

Figure 73: Europe Network Attached Storage (NAS) Market Y-o-Y Growth Projections,By Components  – 2022-2032

Figure 74: Europe Network Attached Storage (NAS) Market Attractiveness Index,By Components  – 2022-2032

Figure 75: Europe Network Attached Storage (NAS) Market Share, By Design, 2022 & 2032

Figure 76: Europe Network Attached Storage (NAS) Market Y-o-Y Growth Projections, By Design – 2022-2032

Figure 77: Europe Network Attached Storage (NAS) Market Attractiveness Index, By Design – 2022-2032

Figure 78: Europe Network Attached Storage (NAS) Market Share, By Product, 2022 & 2032

Figure 79: Europe Network Attached Storage (NAS) Market Y-o-Y Growth Projections, By Product – 2022-2032

Figure 80: Europe Network Attached Storage (NAS) Market Attractiveness Index, By Product – 2022-2032

Figure 81: Europe Network Attached Storage (NAS) Market Share, By Storage Solution, 2022 & 2032

Figure 82: Europe Network Attached Storage (NAS) Market Y-o-Y Growth Projections, By Storage Solution – 2022-2032

Figure 83: Europe Network Attached Storage (NAS) Market Attractiveness Index, By Storage Solution – 2022-2032

Figure 84: Europe Network Attached Storage (NAS) Market Share, By Deployment Type, 2022 & 2032

Figure 85: Europe Network Attached Storage (NAS) Market Y-o-Y Growth Projections, By Deployment Type – 2022-2032

Figure 86: Europe Network Attached Storage (NAS) Market Attractiveness Index, By Deployment Type – 2022-2032

Figure 87: Europe Network Attached Storage (NAS) Market Share, By End-user Industry, 2022 & 2032

Figure 88: Europe Network Attached Storage (NAS) Market Y-o-Y Growth Projections, By End-user Industry – 2022-2032

Figure 89: Europe Network Attached Storage (NAS) Market Attractiveness Index, By End-user Industry – 2022-2032

Figure 90: Europe Network Attached Storage (NAS) Market Share, By Country, 2022 & 2032

Figure 91: Europe Network Attached Storage (NAS) Market Y-o-Y Growth Projections, By Country – 2022-2032

Figure 92: Europe Network Attached Storage (NAS) Market Attractiveness Index, By Country – 2022-2032

Figure 93: Asia Pacific Network Attached Storage (NAS) Market Value (US$ Mn) and Year-on-Year Growth, 2015-2032

Figure 94: Asia Pacific Network Attached Storage (NAS) Market Absolute $ Historical Gain (2015 - 2021) and Opportunity (2022 – 2032), US$ Mn

Figure 95: Asia Pacific Network Attached Storage (NAS) Market Share,By Components , 2022 & 2032

Figure 96: Asia Pacific Network Attached Storage (NAS) Market Y-o-Y Growth Projections,By Components  – 2022-2032

Figure 97: Asia Pacific Network Attached Storage (NAS) Market Attractiveness Index,By Components  – 2022-2032

Figure 98: Asia Pacific Network Attached Storage (NAS) Market Share, By Design, 2022 & 2032

Figure 99: Asia Pacific Network Attached Storage (NAS) Market Y-o-Y Growth Projections, By Design – 2022-2032

Figure 100: Asia Pacific Network Attached Storage (NAS) Market Attractiveness Index, By Design – 2022-2032

Figure 101: Asia Pacific Network Attached Storage (NAS) Market Share, By Product, 2022 & 2032

Figure 102: Asia Pacific Network Attached Storage (NAS) Market Y-o-Y Growth Projections, By Product – 2022-2032

Figure 103: Asia Pacific Network Attached Storage (NAS) Market Attractiveness Index, By Product – 2022-2032

Figure 104: Asia Pacific Network Attached Storage (NAS) Market Share, By Storage Solution, 2022 & 2032

Figure 105: Asia Pacific Network Attached Storage (NAS) Market Y-o-Y Growth Projections, By Storage Solution – 2022-2032

Figure 106: Asia Pacific Network Attached Storage (NAS) Market Attractiveness Index, By Storage Solution – 2022-2032

Figure 107: Asia Pacific Network Attached Storage (NAS) Market Share, By Deployment Type, 2022 & 2032

Figure 108: Asia Pacific Network Attached Storage (NAS) Market Y-o-Y Growth Projections, By Deployment Type – 2022-2032

Figure 109: Asia Pacific Network Attached Storage (NAS) Market Attractiveness Index, By Deployment Type – 2022-2032

Figure 110: Asia Pacific Network Attached Storage (NAS) Market Share, By End-user Industry, 2022 & 2032

Figure 111: Asia Pacific Network Attached Storage (NAS) Market Y-o-Y Growth Projections, By End-user Industry – 2022-2032

Figure 112: Asia Pacific Network Attached Storage (NAS) Market Attractiveness Index, By End-user Industry – 2022-2032

Figure 113: Asia Pacific Network Attached Storage (NAS) Market Share, By Country, 2022 & 2032

Figure 114: Asia Pacific Network Attached Storage (NAS) Market Y-o-Y Growth Projections, By Country – 2022-2032

Figure 115: Asia Pacific Network Attached Storage (NAS) Market Attractiveness Index, By Country – 2022-2032

Figure 116: MEA Network Attached Storage (NAS) Market Value (US$ Mn) and Year-on-Year Growth, 2015-2032

Figure 117: MEA Network Attached Storage (NAS) Market Absolute $ Historical Gain (2015 - 2021) and Opportunity (2022 – 2032), US$ Mn

Figure 118: MEA Network Attached Storage (NAS) Market Share,By Components , 2022 & 2032

Figure 119: MEA Network Attached Storage (NAS) Market Y-o-Y Growth Projections,By Components  – 2022-2032

Figure 120: MEA Network Attached Storage (NAS) Market Attractiveness Index,By Components  – 2022-2032

Figure 121: MEA Network Attached Storage (NAS) Market Share, By Design, 2022 & 2032

Figure 122: MEA Network Attached Storage (NAS) Market Y-o-Y Growth Projections, By Design – 2022-2032

Figure 123: MEA Network Attached Storage (NAS) Market Attractiveness Index, By Design – 2022-2032

Figure 124: MEA Network Attached Storage (NAS) Market Share, By Product, 2022 & 2032

Figure 125: MEA Network Attached Storage (NAS) Market Y-o-Y Growth Projections, By Product – 2022-2032

Figure 126: MEA Network Attached Storage (NAS) Market Attractiveness Index, By Product – 2022-2032

Figure 127: MEA Network Attached Storage (NAS) Market Share, By Storage Solution, 2022 & 2032

Figure 128: MEA Network Attached Storage (NAS) Market Y-o-Y Growth Projections, By Storage Solution – 2022-2032

Figure 129: MEA Network Attached Storage (NAS) Market Attractiveness Index, By Storage Solution – 2022-2032

Figure 130: MEA Network Attached Storage (NAS) Market Share, By Deployment Type, 2022 & 2032

Figure 131: MEA Network Attached Storage (NAS) Market Y-o-Y Growth Projections, By Deployment Type – 2022-2032

Figure 132: MEA Network Attached Storage (NAS) Market Attractiveness Index, By Deployment Type – 2022-2032

Figure 133: MEA Network Attached Storage (NAS) Market Share, By End-user Industry, 2022 & 2032

Figure 134: MEA Network Attached Storage (NAS) Market Y-o-Y Growth Projections, By End-user Industry – 2022-2032

Figure 135: MEA Network Attached Storage (NAS) Market Attractiveness Index, By End-user Industry – 2022-2032

Figure 136: MEA Network Attached Storage (NAS) Market Share, By Country, 2022 & 2032

Figure 137: MEA Network Attached Storage (NAS) Market Y-o-Y Growth Projections, By Country – 2022-2032

Figure 138: MEA Network Attached Storage (NAS) Market Attractiveness Index, By Country – 2022-2032

Need specific information?

Request Customization

Explore Technology Insights

View Reports

Recommendations

Technology

Gigabit Passive Optical Network (GPON) Market

Published : March 2022

Technology

External Storage Market

Published : February 2017

Technology

Middle East & Africa Data Storage Market

Published : January 2022

Technology

Storage Area Network (SAN) Market

Published : February 2022

Google translate

Network Attached Storage (NAS) Market