

- Market Size (2026)
- USD 8.2 Bn
- Forecast (2036)
- USD 13.9 Bn
- CAGR (2026 to 2036)
- 5.4%
Specialty Silica Market Size, Market Forecast and Outlook By FMI
The specialty silica market is projected to reach USD 8.2 billion in 2026. The market is forecast to expand at a CAGR of 5.6% between 2026 and 2036 to reach USD 14.1 billion by 2036. Highly dispersible and precipitated silica are expected to lead product type with 41.3% share, while rubber and tire manufacturing is projected to hold 36.0% share.
Summary of the Specialty Silica Market
- Demand and Growth Drivers
- Tire producers use specialty silica to improve traction and tread durability.
- Personal care and cosmetic brands use silica for texture and formulation stability.
- Electronics and pharmaceutical applications require high-purity grades with tight particle control.
- Product and Segment View
- Highly dispersible and precipitated silica lead product type because rubber reinforcement needs consistent dispersion.
- Rubber and tire manufacturing leads application because tires remain the largest outlet for performance fillers.
- Fumed and colloidal silica are gaining relevance in electronics and high-value specialty formulations.
- Food and pharmaceutical uses remain specification-heavy because silica acts as a flow aid and stabilizer.
- Geography and Competitive Outlook
- East Asia remains important due to automotive and industrial production scale.
- Europe and North America retain value because tire and regulated applications require consistent quality.
- Companies with particle engineering and purity control capabilities are expected to hold advantage.
- Analyst Opinion
- Nikhil Kaitwade, Principal Consultant at FMI, indicates that specialty silica suppliers need tighter control over purity, surface area and particle behavior. Supplier advantage depends more on application-specific grades and processing discipline than on commodity filler supply.
- Specialty Silica Market Value Analysis
- The market is moving from basic filler demand toward performance-specific silica consumption.
- Demand is likely to rise as tires and personal care formulations need controlled material behavior.
- Adoption is expected to gain support from EV tire requirements and high-purity electronics production.
- Spending is anticipated to be backed by technical grade differentiation and customer qualification requirements.
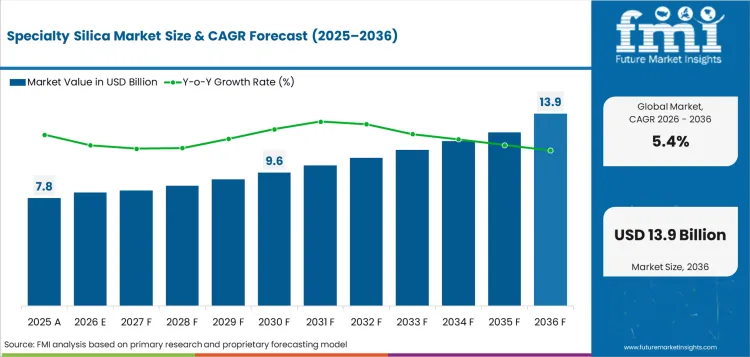
Key Takeaways, Market Size, and Forecast
| Metric | Value |
|---|---|
| Market Size (2026) | USD 8.2 Billion |
| Market Size (2036) | USD 14.1 Billion |
| CAGR (2026–2036) | 5.6% |
| Incremental Opportunity (2026–2036) | USD 5.9 Billion |
| Leading Product Type | Highly Dispersible And Precipitated Silica |
| Highly Dispersible And Precipitated Silica Share | 41.3% |
| Leading Material | Rubber And Tire Manufacturing |
| Rubber And Tire Manufacturing Share | 36.0% |
| Key Regions | East Asia and North America remain key demand regions |
Specialty Silica Market Definition
The sector covers engineered silicon dioxide products sold for functional performance across industrial and consumer applications. Included products cover highly dispersible silica and precipitated silica. Colloidal silica and fumed silica are included. Silica gel and fused silica are included. The scope includes grades used in tire reinforcement and coatings thickening. Adhesive rheology and absorbency are included. Personal care texture and electronics polishing are included. Optical uses are included. Commodity sand and construction aggregates remain outside this study. Glass cullet and finished tire or coating products are excluded.
Specialty Silica Market Inclusions
Market scope covers all commercially traded specialty silica products classified by product type, including precipitated silica and fumed silica. End users include automotive producers, construction material makers, consumer goods manufacturers, electronics suppliers, and healthcare producers. Applications include tire compounds, paints, coatings, adhesives, sealants, cosmetics, semiconductor materials, excipients, feed additives, and packaging. Product forms include powder, liquid colloidal suspensions, gels, fine powder, and granular grades. Revenue scope covers 2026 to 2036. The participant group includes specialty silica makers, tire compounders, coating formulators, adhesive producers, personal care formulators, distributors, testing labs, and industrial users.
Specialty Silica Market Exclusions
The study excludes commodity silica sand and glass sand. Foundry sand and construction aggregates are excluded. Finished tires and finished coatings are excluded. Finished adhesives and untreated mineral fillers are excluded.
Specialty Silica Market Research Methodology
- Primary Research: FMI analysts reviewed tire compounders and specialty chemical distributors using specialty silica grades. Interviews focused on dispersion and particle size. Dosing form and supply reliability were reviewed before price discussion.
- Desk Research: The desk review used IEA electric vehicle data and OICA vehicle output data. Official company actions after January 2024 supported supply-side cross-checks.
- Market Sizing and Forecasting: Forecast work combined tire compound exposure with coatings and adhesives. Personal care and electronics use supported the forecast. Dose bands and country-level manufacturing activity supported the forecast.
- Data Validation: Segment shares were checked against product form use and application needs before distribution channel review.
Why is the Specialty Silica Market Growing?
- Green tire formulation is expected to raise the use of highly dispersible silica across passenger and commercial tire compounds.
- OICA reported global vehicle production rose from 92.7 million units in 2024 to 96.4 million units in 2025.
- IEA reported electric car sales exceeded 17 million units worldwide in 2024 and reached a sales share above 20%.
Tire reinforcement remains the clearest growth channel for specialty silica. Tire compounds need clean silica dispersion before rolling resistance and wet-grip targets can be met. Highly dispersible grades further influence this as silane coupling and mixing control become purchase points. Suppliers with tire lab and repeatable particle control are expected to hold wider technical access by 2036.
Coatings and adhesives extend specialty silica demand beyond tires. Fumed silica supports thickening and sag resistance in coating systems, proving handling and application control more important. Colloidal silica promotes coating performance through adhesion and surface control. Product approval depends on purity and handling form, leading suppliers to compete on technical service alongside volume availability.
Market Segmentation Analysis
- Highly dispersible and precipitated silica is expected to account for 41.6% share in 2026, as tire makers use silica for rolling resistance and wet grip.
- Rubber and tire manufacturing are projected to hold 38.9% share in 2026 as passenger and commercial tire compounders hold the largest purchase pool.
- Automotive is anticipated to represent 34.7% share in 2026 as tire production and molded components require reinforcement.
- Powder is expected to hold 46.2% share in 2026, since dry blending suits rubber mixers and compounder dosing systems.
The specialty silica industry is segmented by product type into highly dispersible and precipitated silica, water dispersible and colloidal silica, pyrogenic and fumed silica, silica gel, and fused silica. By application, industry demand is divided into rubber and tire manufacturing, paints and coatings, adhesives and sealants, personal care, electronics and optics, pharmaceuticals, food and feed, catalysts, packaging, and others. Based on end use industry, demand is categorized into automotive, construction, consumer goods, electronics, and healthcare. By form, demand is segmented into powder, liquid, and gel. Based on distribution channel, demand is categorized into direct sales, distributors, and online sales. By function, demand is segmented into reinforcement agent, thickening agent, anti-caking agent, and absorbent.
Specialty Silica Market Analysis by Product Type
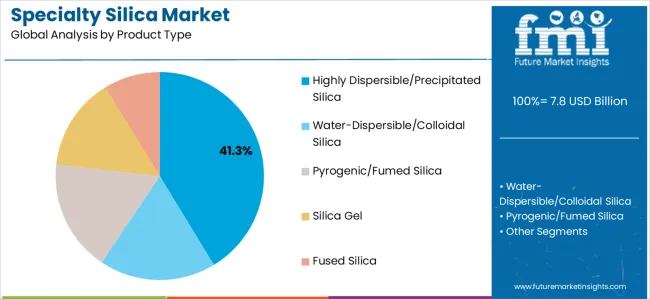
- Highly dispersible and precipitated silica is expected to account for 41.6% share in 2026 as green tire reinforcement and tire label efficiency requirements support use.
- Rubber grade silica is preferred as tire compounders seek stronger dispersion and lower rolling resistance without sacrificing tread grip.
Specialty Silica Market Analysis by Application
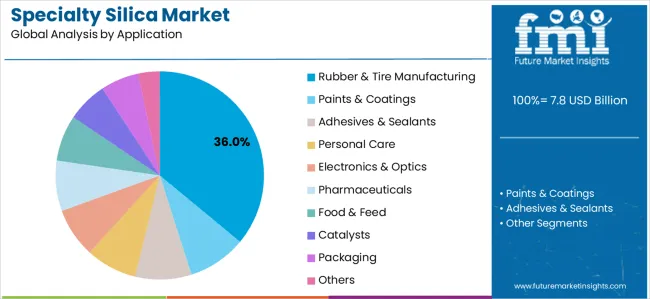
- Rubber and tire manufacturing is projected to represent 38.9% share in 2026 as tire compounds depend on silica for strength and energy efficiency.
- Paints and coatings use colloidal and fumed grades for viscosity control. Matte finish and film stability influence repeat use.
Specialty Silica Market Analysis by End Use Industry
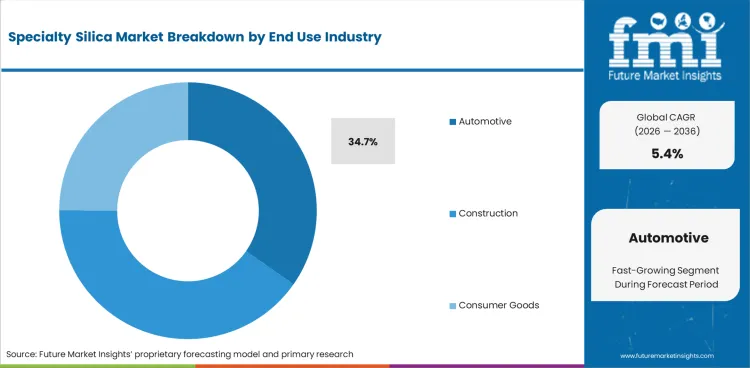
- Automotive use is anticipated to make up 34.7% share in 2026 as tire output and component reinforcement requirements support demand.
- Construction demand follows through coatings and sealants as builders prefer materials with stable handling and surface performance.
Specialty Silica Market Analysis by Form
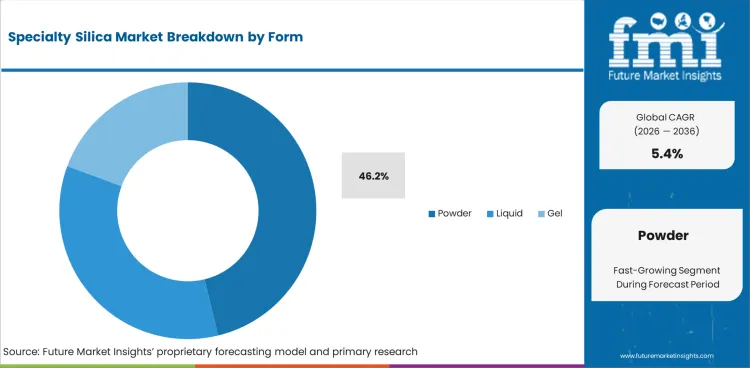
- In 2026, powder is forecast to account for a 46.2% share, aligned with the dry dosing compatibility needs of tire mixers and coatings producers.
- Liquid forms are important in colloidal silica uses where suspension stability and clean dispersion shape buyer approval.
Specialty Silica Market Analysis by Distribution Channel
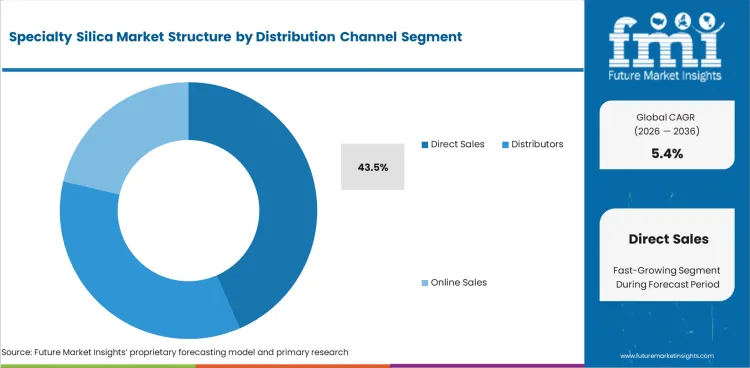
- Direct sales are anticipated to represent a 43.5% share in 2026, as tire and coatings customers require direct technical support from manufacturers.
- Distributors support smaller formulators where order size and delivery flexibility weigh heavily in supplier selection.
Specialty Silica Market Analysis by Function
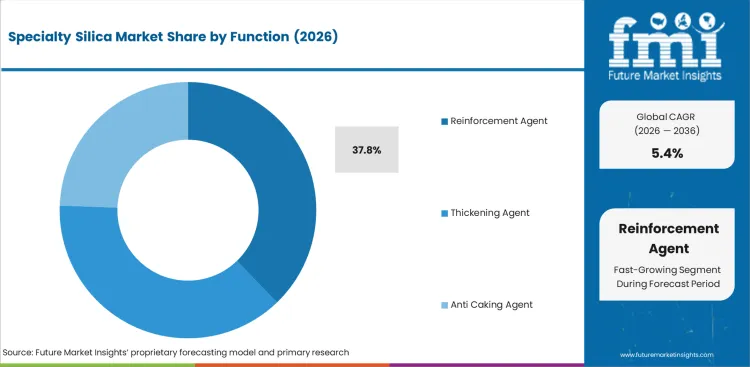
- Reinforcement agent is anticipated to represent 37.8% share in 2026 since rubber compounds rely on silica for stiffness and durability.
- Thickening agent demand advances through coatings and sealants where rheology control affects application speed and finish quality.
Specialty Silica Market Drivers, Restraints, and Opportunities
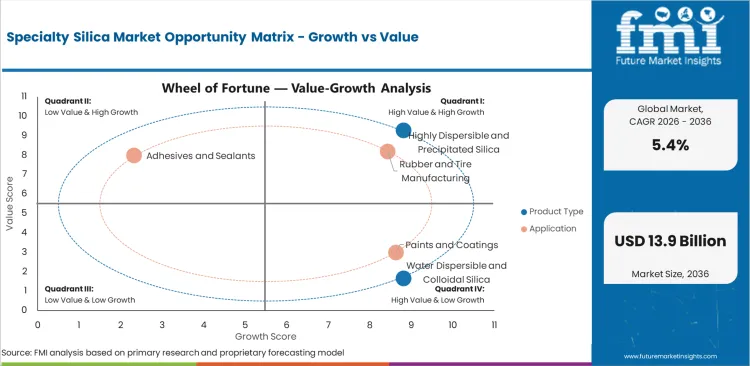
- Green tire reinforcement is expected to favor highly dispersible silica grades improving wet grip and lower rolling resistance.
- Fumed silica cost exposure is expected to slow larger use in lower-margin coatings and sealants.
- Electronics and healthcare applications are expected to create higher-value demand as purity and particle consistency carry more weight in approvals.
Tire formulation is anticipated to propel specialty silica further into rubber compound design by 2036. Evonik broke ground on its Charleston precipitated silica expansion in October 2024, with the project planned to raise site capacity by 50%. Regional output should reduce freight exposure for tire makers requiring dependable local supply. Suppliers able to combine volume support with compound testing are expected to gain wider direct sales access.
Cost pressure is expected to limit faster adoption in price-sensitive application groups. Fumed silica production uses high-temperature flame hydrolysis, maintaining its cost position above basic mineral fillers. Coatings and sealant makers are expected to test silica grades against dosage efficiency and finish control before widening use. Supplier advantage should shift toward grades proving lower loading and stable processing together.
Application-Wise Use Analysis
Specialty silica is expected to gain wider use in tire compounds and coatings over the assessment period. IEA reported global electric car sales above 17 million units in 2024, which increases buyer attention to efficient tires and battery-adjacent materials. OICA reported global vehicle production at 96.4 million units in 2025 after 92.7 million units in 2024. Tire producers and material suppliers are expected to keep silica trials focused on energy efficiency and reinforcement performance.
Technology Adoption and Dispersion Control Analysis
Technology adoption is expected to center on particle size control and repeatable dispersion in mixing lines. Solvay said in September 2025 that its Qingdao and Gunsan HDS plants would adopt ISCC+ certified waste sand from 2026. Circular raw material claims will carry commercial value only when tire makers witness stable compound performance. Suppliers can gain account access by connecting sustainable inputs with dispersion data and tire-grade consistency.
Regional Analysis
.webp "Top Country Growth Comparison Specialty Silica Market Cagr (2026 2036)")
| Country | CAGR 2026 to 2036 |
|---|---|
| China | 6.8% |
| India | 7.2% |
| USA | 5.9% |
| South Korea | 6.3% |
| Thailand | 6.0% |
| Indonesia | 5.8% |
| Brazil | 5.7% |
| Germany | 5.5% |
| Japan | 5.4% |
| France | 5.2% |
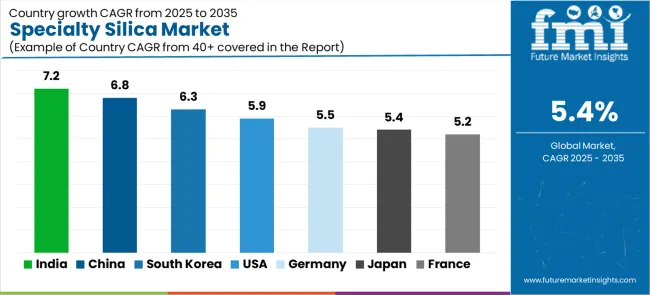
Source: Future Market Insights analysis based on primary research and public source checks in 2026.
Analysis of Specialty Silica by Key Countries
- India is projected to record 7.2% CAGR by 2036 as tire manufacturing and domestic fumed silica use expand together.
- China is expected to advance at 6.8% CAGR by 2036 as HDS silica production influences tire exports and electric vehicle supply chains.
- South Korea is estimated at 6.3% CAGR by 2036 through electronics materials and automotive applications.
- Thailand at 6.0% CAGR and Indonesia at 5.8% CAGR are expected to move ahead through regional tire and rubber processing.
- USA at 5.9% CAGR and Brazil at 5.7% CAGR indicate mature tire and coatings demand. Germany at 5.5% CAGR and Japan at 5.4% CAGR show steadier conditions. France at 5.2% CAGR reflects mature coatings and tire demand.
Country performance varies with tire output scale and specialty chemical supply depth. India and China lead the country outlook as tire capacity and automotive supply chains support larger silica trials. South Korea and Thailand benefit from electronics and rubber processing. Mature markets retain value through technical approvals and green tire compounds. High-purity grades support coatings and healthcare applications.
Demand Outlook for Specialty Silica in China
Demand for specialty silica in China is projected to rise at 6.8% CAGR by 2036, as tire exports and electric vehicle supply chains increase HDS silica adoption. Local producers need grades combining reinforcement with clean dispersion for passenger tire compounds. China leads the country group for the sector through large rubber processing capacity and circular silica moves at regional production sites.
- Tire makers raise use of HDS silica as rolling resistance and wet grip requirements influence compound design.
- Colloidal silica demand benefits from electronics and coatings users needing controlled particle size.
- Local production access supports direct account supply for high-volume tire and industrial customers.
Demand Outlook for Specialty Silica in India
Specialty silica demand in India is expected to expand at 7.2% CAGR by 2036 as tire manufacturing and fumed silica use in chemicals expand. India ranks first in the country set as local manufacturing depth improves and import substitution gains purchase attention. Domestic compounders need affordable grades able to handle rubber reinforcement and coatings thickening.
- Local suppliers can gain position by offering direct technical service and stable batch quality.
- Tire reinforcement creates the largest opportunity as domestic mobility and replacement tire use support compounding lines.
- Fumed silica expansion improves supply for coatings and pharmaceuticals. Personal care and chemical processing users gain better local access.
Demand Outlook for Specialty Silica in United States
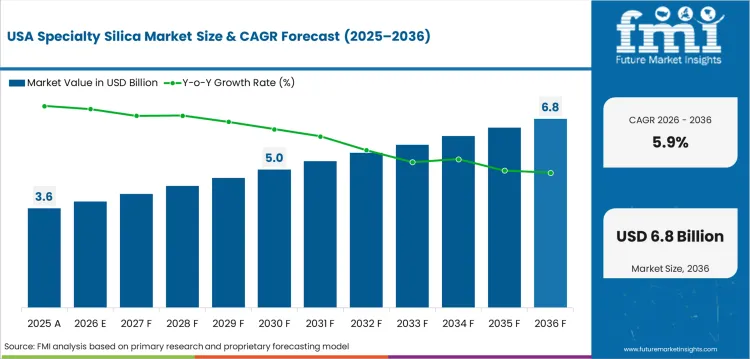
Sales of specialty silica in the United States are projected to increase at 5.9% CAGR by 2036, shaped by green tire compounds and regional precipitated silica supply. Established tire accounts depend on silica producers with application labs and reliable logistics. United States demand remains firm as automotive and coatings buyers require proven reinforcement or rheology benefits.
- Regional tire makers are expected to use HDS silica to improve energy efficiency and wet grip targets.
- Evonik capacity work in South Carolina points to greater focus on local precipitated silica supply.
- Coatings and adhesives producers prefer fumed silica grades sustaining stable sag control during application.
Demand Outlook for Specialty Silica in South Korea
Industry demand in South Korea is forecast to grow at 6.3% CAGR by 2036 as electronics materials and tire applications sustain silica use. Local buyers need narrow particle control for coatings and semiconductor-adjacent applications. South Korea maintains a strong technical position as electronics and automotive supply chains value consistent specialty grades.
- Electronics producers promote colloidal and fused silica demand through polishing and optical material requirements.
- Direct supply from regional producers improves qualification speed for larger material accounts.
- Automotive suppliers use silica in tire compounds and molded component applications requiring reinforcement.
Demand Outlook for Specialty Silica in Thailand
Thailand is expected to advance at 6.0% CAGR by 2036 since rubber processing and tire production influences specialty silica adoption. Thailand remains commercially relevant as Southeast Asian automotive and rubber supply chains keep tire inputs in evaluation. Local compounding lines require silica grades suited to rubber mixing and export-oriented tire quality.
- Rubber compounders use precipitated silica to improve tread strength and lower rolling resistance.
- Regional tire exporters are expected to prefer direct supply arrangements for consistent compound performance.
- Distributors prefer coatings and adhesive makers depending on smaller lot sizes and technical grade access.
Demand Outlook for Specialty Silica in Indonesia
Indonesia is projected to rise at 5.8% CAGR by 2036, as rubber availability and industrial coatings promote silica consumption. Local buyers need cost-balanced precipitated silica for rubber and functional fillers. Indonesia holds a developing position as tire and sealant producers broaden material sourcing across Southeast Asia.
- Rubber processing supports reinforcement silica demand across tire and industrial goods applications.
- Coatings and sealants create steady pull for thickening grades in construction and consumer product channels.
- Supplier success depends on distributor reach and technical support for smaller formulator accounts.
Demand Outlook for Specialty Silica in Brazil
Brazil is forecast at 5.7% CAGR by 2036, as automotive replacement tires and coatings demand sustain specialty silica adoption. Brazil remains important in Latin America as regional automotive production and industrial coatings use protect functional filler demand. Domestic tire compounders depend on reinforcement grades functioning across passenger and commercial tire lines.
- Replacement tire demand influences repeat purchases of precipitated silica for durable tread compounds.
- Paints and coatings producers use fumed and colloidal grades for viscosity and finish control.
- Regional distributors remain important for small and medium industrial users needing flexible delivery.
Demand Outlook for Specialty Silica in Germany
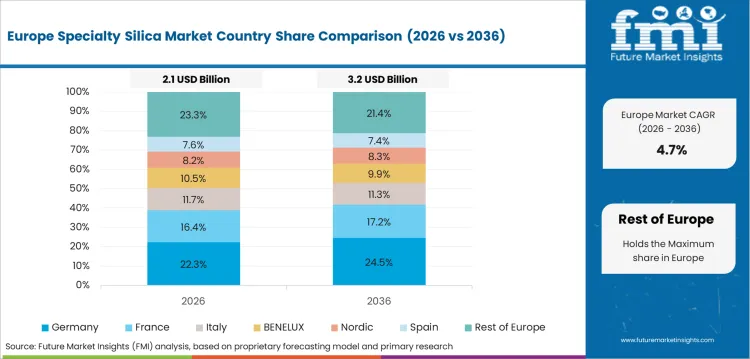
Germany is expected to expand at 5.5% CAGR by 2036, shaped by high-performance tires and specialty coatings guiding technical silica selection. German buyers focus on documented dispersion and quality consistency before expanding supplier use. Growth is measured as mature applications shift toward lower rolling resistance and more specialized coating functions.
- Tire engineering teams require silica grades with proven reinforcement and repeatable mixing behavior.
- Industrial coatings demand favors fumed grades that improve sag resistance and surface control.
- Supplier approval cycles are longer as buyers test compound quality before wider rollout.
Demand Outlook for Specialty Silica in Japan
The sector in Japan is expected to post 5.4% CAGR by 2036 reflecting electronics and automotive applications continue to use high-purity silica. Japanese buyers prioritize grade consistency and clean handling across technical applications. Japan records a stable pace as electronics polishing and tire material programs remain selective.
- Electronics and optics applications influence fused and colloidal silica implementation in higher-purity channels.
- Automotive material suppliers prefer silica grades preserving compound consistency in tire programs.
- Specialty distributors serve niche users requiring small batches with strict quality documentation.
Demand Outlook for Specialty Silica in France
France is projected to record 5.2% CAGR by 2036 as coatings and tire-linked materials continue to use specialty silica. Local demand is mature and tied to technical grades over volume replacement alone. France remains a steady European outlet through coatings and personal care. Automotive material users add stable demand.
- Coatings and sealants producers use silica to control viscosity and application finish in industrial products.
- Personal care formulators value fine silica grades for texture and absorbency in skin products.
- Mature tire applications maintain a steady demand for reinforcement silica across premium compound programs.
Competitive Positioning and Strategic Supplier Strength

- Tire compounders are expected to favor suppliers offering dispersion data before new silica grades enter rubber approval programs.
- Coatings producers are expected to prefer fumed grades backed by viscosity control and application testing across major resin systems.
- Electronics and healthcare suppliers are expected to assess partners by purity control and application documentation.
Solvay and Evonik show how supplier advantage develops based on tire-grade silica depth and regional supply positioning. Solvay advanced circular HDS supply in Asia through ISCC+ certified waste sand plans for Qingdao and Gunsan. Evonik expanded Charleston precipitated silica capacity and repositioned older North American assets to reduce cost exposure. Buyers are expected to compare dispersion and reinforcement performance before approving larger account volumes. Regional supply strength should improve account confidence where tire makers require dependable material access.
Cabot and Wacker expand fumed silica positioning in specialty applications requiring rheology control and clean handling. Wacker points to pyrogenic silica use in wind turbine adhesives where thixotropy supports easier processing and sag control. PQ Corporation and W.R. Grace retain relevance through silica gel and absorbent functions in industrial and packaging uses. By 2036, market advantage is expected to favor suppliers combining application support with consistent particle control.
Key Companies in Specialty Silica Market
Competition spans tire-grade silica producers, fumed silica suppliers, and silica gel specialists serving rubber, coatings, and absorbent applications.
- Tire-grade and precipitated silica suppliers: Solvay SA and Evonik Industries AG compete through highly dispersible silica portfolios for green tire reinforcement. PPG Industries and Tata Chemicals Ltd. serve rubber and industrial-grade silica demand through established material supply positions.
- Fumed and colloidal silica suppliers: Cabot Corporation and Wacker Chemie AG compete through pyrogenic silica grades used in coatings, sealants, and specialty adhesives. PQ Corporation supports colloidal and silica-based materials for industrial formulation needs.
- Silica gel and regional specialists: W.R. Grace and Co. and Tosoh Silica Corporation compete through silica gel and adsorbent functions. Madhu Silica Pvt. Ltd. and Qingdao Makall Group Inc. serve regional customers through precipitated silica and gel-based product lines.
Competitive Benchmarking: Specialty Silica Market
| Company | Tire Reinforcement Depth | Fumed Silica Range | Direct Account Reach | Footprint |
|---|---|---|---|---|
| Solvay SA | High | Moderate | High | Global |
| Evonik Industries AG | High | High | High | Global |
| Cabot Corporation | Moderate | High | High | Global |
| Wacker Chemie AG | Moderate | High | Moderate | Global |
| PPG Industries | Moderate | Moderate | High | Global |
| Tata Chemicals Ltd. | Moderate | Moderate | Moderate | Regional |
| Madhu Silica Pvt. Ltd. | Moderate | Moderate | Moderate | Regional |
| PQ Corporation | Moderate | Moderate | High | Global |
Source: Future Market Insights competitive analysis based on public product portfolios and company activity in 2026.
Key Developments in the Specialty Silica Market
- In September 2025, Solvay said its Qingdao and Gunsan HDS plants would adopt ISCC+ certified waste sand from 2026.
- In October 2024, Evonik broke ground on a Charleston precipitated silica expansion planned to raise local capacity by 50%.
- In January 2025, Evonik launched Smart Effects by merging its silica and silanes business lines into one strategic entity.
- In June 2024, Wacker broke ground on a Czech silicone specialties site tied to electromobility and medical care applications.
Key Players in the Specialty Silica Market
Global silica suppliers
- Solvay SA
- Evonik Industries AG
- Cabot Corporation
- Wacker Chemie AG
- PPG Industries
- PQ Corporation
- W.R. Grace and Co.
Regional and specialty participants
- Tata Chemicals Ltd.
- Madhu Silica Pvt. Ltd.
- Tosoh Silica Corporation
- Akzo Nobel NV
- Qingdao Makall Group Inc.
- Nalco Holding Company
- PT Darisa Intimitra
- MLA Group of Industries
Report Scope and Coverage
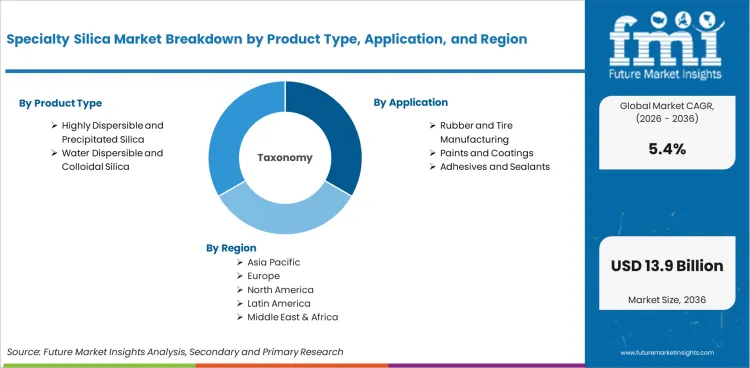
| Item | Value |
| Market value in 2025 | USD 7.8 billion |
| Market value in 2026 | USD 8.2 billion |
| Market value in 2036 | USD 13.9 billion |
| CAGR from 2026 to 2036 | 5.4% |
| Quantitative units | USD billion |
| Market definition | Specialty silica products engineered for reinforcement, thickening, absorbency, and surface-control functions across tire, coatings, personal care, electronics, and industrial uses |
| By product type | Highly Dispersible and Precipitated Silica, Water Dispersible and Colloidal Silica, Pyrogenic and Fumed Silica, Silica Gel, Fused Silica |
| By application | Rubber and Tire Manufacturing, Paints and Coatings, Adhesives and Sealants, Personal Care, Electronics and Optics, Pharmaceuticals, Food and Feed, Catalysts, Packaging, Others |
| By end use industry | Automotive, Construction, Consumer Goods, Electronics, Healthcare |
| By form | Powder, Liquid, Gel |
| By distribution channel | Direct Sales, Distributors, Online Sales |
| By function | Reinforcement Agent, Thickening Agent, Anti Caking Agent, Absorbent |
| Regions covered | North America, Latin America, Europe, East Asia, South Asia and Pacific, Middle East and Africa |
| Countries covered | China, India, USA, South Korea, Thailand, Indonesia, Brazil, Germany, Japan, France |
| Key companies profiled | Solvay SA, Evonik Industries AG, Cabot Corporation, Wacker Chemie AG, PPG Industries, Tata Chemicals Ltd., Madhu Silica Pvt. Ltd., PQ Corporation, Tosoh Silica Corporation |
| Forecast period | 2026 to 2036 |
| Approach | FMI analysis based on specialty silica application use, tire reinforcement needs, company activity, and public source checks |
Source: Future Market Insights analysis, 2026.
Specialty Silica Market Breakdown By Product Type, Application, End Use Industry, Form, Distribution Channel, Function, and Region
Specialty Silica Market Segmented by Product Type
- Highly Dispersible and Precipitated Silica
- Rubber Grade Silica
- Industrial Grade Silica
- Water Dispersible and Colloidal Silica
- Alkaline Silica Sol
- Acidic Silica Sol
- Pyrogenic and Fumed Silica
- Hydrophilic Fumed Silica
- Hydrophobic Fumed Silica
- Silica Gel
- Indicating Gel
- Non Indicating Gel
- Fused Silica
- High Purity Fused Silica
- Optical Grade Silica
Specialty Silica Market Segmented by Application
- Rubber and Tire Manufacturing
- Passenger Vehicle Tires
- Commercial Vehicle Tires
- Paints and Coatings
- Decorative Coatings
- Industrial Coatings
- Adhesives and Sealants
- Construction Adhesives
- Industrial Sealants
- Personal Care
- Cosmetics
- Skincare Products
- Electronics and Optics
- Semiconductors
- Optical Fibers
- Pharmaceuticals
- Drug Formulation
- Excipients
- Food and Feed
- Anti Caking Agents
- Nutritional Additives
- Catalysts
- Petrochemical Catalysts
- Chemical Processing Catalysts
- Packaging
- Flexible Packaging
- Rigid Packaging
- Others
Specialty Silica Market Segmented by End Use Industry
- Automotive
- Tire Manufacturing
- Automotive Components
- Construction
- Infrastructure Projects
- Residential Construction
- Consumer Goods
- Personal Care Products
- Household Products
- Electronics
- Semiconductor Industry
- Display Technologies
- Healthcare
- Pharmaceutical Industry
- Medical Devices
Specialty Silica Market Segmented by Form
- Powder
- Fine Powder
- Granular Powder
- Liquid
- Colloidal Suspensions
- Silica Sol
- Gel
- Beaded Gel
- Granular Gel
Specialty Silica Market Segmented by Distribution Channel
- Direct Sales
- Manufacturer Direct Contracts
- Bulk Supply Agreements
- Distributors
- Regional Distributors
- Specialty Chemical Distributors
- Online Sales
- Industrial E Commerce Platforms
Specialty Silica Market Segmented by Function
- Reinforcement Agent
- Rubber Reinforcement
- Plastics Reinforcement
- Thickening Agent
- Paint Thickening
- Adhesive Thickening
- Anti Caking Agent
- Food Grade Applications
- Feed Additives
- Absorbent
- Moisture Absorption
- Desiccants
Specialty Silica Market by Region
- North America
- United States
- Canada
- Mexico
- Latin America
- Brazil
- Chile
- Western Europe
- Germany
- United Kingdom
- Italy
- France
- Eastern Europe
- Poland
- East Asia
- China
- Japan
- South Korea
- South Asia and Pacific
- India
- ASEAN
- Australia and New Zealand
- Middle East and Africa
- Kingdom of Saudi Arabia
- South Africa
Research Sources and Bibliography
- Adhesive and Sealant Council. (2024, September 9). Wacker using pyrogenic fumed silica in wind turbine adhesives for easier processing.
- Cabot Corporation. (2025, March). New products for March: European Coating Show edition. Cabot in the News.
- Evonik Industries AG. (2024, October 1). Evonik breaks ground on major silica expansion at Charleston site.
- Evonik Industries AG. (2025, January 17). Evonik to close two silica plants in North America.
- Evonik Industries AG. (2025, January 22). Evonik announces Smart Effects as a strategic merger of Silica and Silanes Business Line.
- International Energy Agency. (2025, May 14). Global EV Outlook 2025.
- Organisation Internationale des Constructeurs d’Automobiles. (2026, April 23). Auto industry growth shifted east in 2025 amid global repositioning.
- Solvay. (2025, September 16). Solvay advances worldwide circular silica strategy.
- USA Geological Survey. (2025). Mineral commodity summaries 2025 (Version 1.2, March 2025). U.S. Geological Survey.
- Wacker Chemie AG. (2024, June 20). Groundbreaking ceremony: WACKER strengthens focus on silicone specialties with the construction of a new production site in the Czech Republic.
The bibliography is provided for reader reference and direct source checking.
Report Questions Answered
- How large the specialty silica sector is in 2026 and how far it can rise by 2036?
- Which product type and form hold the largest projected share positions in 2026?
- Why highly dispersible and precipitated silica holds the clearest lead in current product structure?
- Why India and China lead the country growth set by 2036?
- How rubber and tire manufacturing shapes demand for reinforcement silica grades?
- Which supplier capabilities help companies defend position in specialty silica qualification?
- What public vehicle data and company actions support the forecast method used in this study?
Frequently Asked Questions
How large is the specialty silica market in 2026?
The specialty silica market is projected to reach USD 8.2 billion in 2026 as tire reinforcement accounts drive core volume.
What will the specialty silica market be worth by 2036?
The specialty silica market is forecast to reach USD 13.9 billion by 2036 as automotive and coatings applications expand.
What is the expected specialty silica market CAGR?
The specialty silica market is expected to expand at 5.4% CAGR from 2026 to 2036 across major application groups.
Which product type leads the specialty silica market?
Highly dispersible and precipitated silica is projected to account for 41.6% share in 2026 due to tire reinforcement use.
Which countries grow fastest in the specialty silica market?
India at 7.2% CAGR and China at 6.8% CAGR are expected to grow fastest by 2036.
Which companies shape the specialty silica market?
Solvay and Evonik lead tire-grade silica supply. Cabot and Wacker support fumed silica supply for adhesives and coatings.
Preview the report firsthand - request a free sample
Get SampleGet the brochure for pricing and purchase details.
Get PDFTable of Content
- Executive Summary
- Global Market Outlook
- Demand-side Trends
- Supply-side Trends
- Technology Roadmap Analysis
- Analysis and Recommendations
- Market Overview
- Market Coverage / Taxonomy
- Market Definition / Scope / Limitations
- Research Methodology
- Chapter Orientation
- Analytical Lens and Working Hypotheses
- Market Structure, Signals, and Trend Drivers
- Benchmarking and Cross-market Comparability
- Market Sizing, Forecasting, and Opportunity Mapping
- Research Design and Evidence Framework
- Desk Research Programme (Secondary Evidence)
- Company Annual and Sustainability Reports
- Peer-reviewed Journals and Academic Literature
- Corporate Websites, Product Literature, and Technical Notes
- Earnings Decks and Investor Briefings
- Statutory Filings and Regulatory Disclosures
- Technical White Papers and Standards Notes
- Trade Journals, Industry Magazines, and Analyst Briefs
- Conference Proceedings, Webinars, and Seminar Materials
- Government Statistics Portals and Public Data Releases
- Press Releases and Reputable Media Coverage
- Specialist Newsletters and Curated Briefings
- Sector Databases and Reference Repositories
- FMI Internal Proprietary Databases and Historical Market Datasets
- Subscription Datasets and Paid Sources
- Social Channels, Communities, and Digital Listening Inputs
- Additional Desk Sources
- Expert Input and Fieldwork (Primary Evidence)
- Primary Modes
- Qualitative Interviews and Expert Elicitation
- Quantitative Surveys and Structured Data Capture
- Blended Approach
- Why Primary Evidence is Used
- Field Techniques
- Interviews
- Surveys
- Focus Groups
- Observational and In-context Research
- Social and Community Interactions
- Stakeholder Universe Engaged
- C-suite Leaders
- Board Members
- Presidents and Vice Presidents
- R&D and Innovation Heads
- Technical Specialists
- Domain Subject-matter Experts
- Scientists
- Physicians and Other Healthcare Professionals
- Governance, Ethics, and Data Stewardship
- Research Ethics
- Data Integrity and Handling
- Primary Modes
- Tooling, Models, and Reference Databases
- Desk Research Programme (Secondary Evidence)
- Data Engineering and Model Build
- Data Acquisition and Ingestion
- Cleaning, Normalisation, and Verification
- Synthesis, Triangulation, and Analysis
- Quality Assurance and Audit Trail
- Market Background
- Market Dynamics
- Drivers
- Restraints
- Opportunity
- Trends
- Scenario Forecast
- Demand in Optimistic Scenario
- Demand in Likely Scenario
- Demand in Conservative Scenario
- Opportunity Map Analysis
- Product Life Cycle Analysis
- Supply Chain Analysis
- Investment Feasibility Matrix
- Value Chain Analysis
- PESTLE and Porter’s Analysis
- Regulatory Landscape
- Regional Parent Market Outlook
- Production and Consumption Statistics
- Import and Export Statistics
- Market Dynamics
- Global Market Analysis 2021 to 2025 and Forecast, 2026 to 2036
- Historical Market Size Value (USD Million) Analysis, 2021 to 2025
- Current and Future Market Size Value (USD Million) Projections, 2026 to 2036
- Y-o-Y Growth Trend Analysis
- Absolute $ Opportunity Analysis
- Global Market Pricing Analysis 2021 to 2025 and Forecast 2026 to 2036
- Global Market Analysis 2021 to 2025 and Forecast 2026 to 2036, By Product Type
- Introduction / Key Findings
- Historical Market Size Value (USD Million) Analysis By Product Type , 2021 to 2025
- Current and Future Market Size Value (USD Million) Analysis and Forecast By Product Type , 2026 to 2036
- Highly Dispersible and Precipitated Silica
- Water Dispersible and Colloidal Silica
- Highly Dispersible and Precipitated Silica
- Y-o-Y Growth Trend Analysis By Product Type , 2021 to 2025
- Absolute $ Opportunity Analysis By Product Type , 2026 to 2036
- Global Market Analysis 2021 to 2025 and Forecast 2026 to 2036, By Application
- Introduction / Key Findings
- Historical Market Size Value (USD Million) Analysis By Application, 2021 to 2025
- Current and Future Market Size Value (USD Million) Analysis and Forecast By Application, 2026 to 2036
- Rubber and Tire Manufacturing
- Paints and Coatings
- Adhesives and Sealants
- Rubber and Tire Manufacturing
- Y-o-Y Growth Trend Analysis By Application, 2021 to 2025
- Absolute $ Opportunity Analysis By Application, 2026 to 2036
- Global Market Analysis 2021 to 2025 and Forecast 2026 to 2036, By End Use Industry
- Introduction / Key Findings
- Historical Market Size Value (USD Million) Analysis By End Use Industry, 2021 to 2025
- Current and Future Market Size Value (USD Million) Analysis and Forecast By End Use Industry, 2026 to 2036
- Automotive
- Construction
- Consumer Goods
- Automotive
- Y-o-Y Growth Trend Analysis By End Use Industry, 2021 to 2025
- Absolute $ Opportunity Analysis By End Use Industry, 2026 to 2036
- Global Market Analysis 2021 to 2025 and Forecast 2026 to 2036, By Form
- Introduction / Key Findings
- Historical Market Size Value (USD Million) Analysis By Form, 2021 to 2025
- Current and Future Market Size Value (USD Million) Analysis and Forecast By Form, 2026 to 2036
- Powder
- Liquid
- Gel
- Powder
- Y-o-Y Growth Trend Analysis By Form, 2021 to 2025
- Absolute $ Opportunity Analysis By Form, 2026 to 2036
- Global Market Analysis 2021 to 2025 and Forecast 2026 to 2036, By Distribution Channel
- Introduction / Key Findings
- Historical Market Size Value (USD Million) Analysis By Distribution Channel, 2021 to 2025
- Current and Future Market Size Value (USD Million) Analysis and Forecast By Distribution Channel, 2026 to 2036
- Direct Sales
- Distributors
- Online Sales
- Direct Sales
- Y-o-Y Growth Trend Analysis By Distribution Channel, 2021 to 2025
- Absolute $ Opportunity Analysis By Distribution Channel, 2026 to 2036
- Global Market Analysis 2021 to 2025 and Forecast 2026 to 2036, By Function
- Introduction / Key Findings
- Historical Market Size Value (USD Million) Analysis By Function, 2021 to 2025
- Current and Future Market Size Value (USD Million) Analysis and Forecast By Function, 2026 to 2036
- Reinforcement Agent
- Thickening Agent
- Anti Caking Agent
- Reinforcement Agent
- Y-o-Y Growth Trend Analysis By Function, 2021 to 2025
- Absolute $ Opportunity Analysis By Function, 2026 to 2036
- Global Market Analysis 2021 to 2025 and Forecast 2026 to 2036, By Region
- Introduction
- Historical Market Size Value (USD Million) Analysis By Region, 2021 to 2025
- Current Market Size Value (USD Million) Analysis and Forecast By Region, 2026 to 2036
- North America
- Latin America
- Western Europe
- Eastern Europe
- East Asia
- South Asia and Pacific
- Middle East & Africa
- Market Attractiveness Analysis By Region
- North America Market Analysis 2021 to 2025 and Forecast 2026 to 2036, By Country
- Historical Market Size Value (USD Million) Trend Analysis By Market Taxonomy, 2021 to 2025
- Market Size Value (USD Million) Forecast By Market Taxonomy, 2026 to 2036
- By Country
- USA
- Canada
- Mexico
- By Product Type
- By Application
- By End Use Industry
- By Form
- By Distribution Channel
- By Function
- By Country
- Market Attractiveness Analysis
- By Country
- By Product Type
- By Application
- By End Use Industry
- By Form
- By Distribution Channel
- By Function
- Key Takeaways
- Latin America Market Analysis 2021 to 2025 and Forecast 2026 to 2036, By Country
- Historical Market Size Value (USD Million) Trend Analysis By Market Taxonomy, 2021 to 2025
- Market Size Value (USD Million) Forecast By Market Taxonomy, 2026 to 2036
- By Country
- Brazil
- Chile
- Rest of Latin America
- By Product Type
- By Application
- By End Use Industry
- By Form
- By Distribution Channel
- By Function
- By Country
- Market Attractiveness Analysis
- By Country
- By Product Type
- By Application
- By End Use Industry
- By Form
- By Distribution Channel
- By Function
- Key Takeaways
- Western Europe Market Analysis 2021 to 2025 and Forecast 2026 to 2036, By Country
- Historical Market Size Value (USD Million) Trend Analysis By Market Taxonomy, 2021 to 2025
- Market Size Value (USD Million) Forecast By Market Taxonomy, 2026 to 2036
- By Country
- Germany
- UK
- Italy
- Spain
- France
- Nordic
- BENELUX
- Rest of Western Europe
- By Product Type
- By Application
- By End Use Industry
- By Form
- By Distribution Channel
- By Function
- By Country
- Market Attractiveness Analysis
- By Country
- By Product Type
- By Application
- By End Use Industry
- By Form
- By Distribution Channel
- By Function
- Key Takeaways
- Eastern Europe Market Analysis 2021 to 2025 and Forecast 2026 to 2036, By Country
- Historical Market Size Value (USD Million) Trend Analysis By Market Taxonomy, 2021 to 2025
- Market Size Value (USD Million) Forecast By Market Taxonomy, 2026 to 2036
- By Country
- Russia
- Poland
- Hungary
- Balkan & Baltic
- Rest of Eastern Europe
- By Product Type
- By Application
- By End Use Industry
- By Form
- By Distribution Channel
- By Function
- By Country
- Market Attractiveness Analysis
- By Country
- By Product Type
- By Application
- By End Use Industry
- By Form
- By Distribution Channel
- By Function
- Key Takeaways
- East Asia Market Analysis 2021 to 2025 and Forecast 2026 to 2036, By Country
- Historical Market Size Value (USD Million) Trend Analysis By Market Taxonomy, 2021 to 2025
- Market Size Value (USD Million) Forecast By Market Taxonomy, 2026 to 2036
- By Country
- China
- Japan
- South Korea
- By Product Type
- By Application
- By End Use Industry
- By Form
- By Distribution Channel
- By Function
- By Country
- Market Attractiveness Analysis
- By Country
- By Product Type
- By Application
- By End Use Industry
- By Form
- By Distribution Channel
- By Function
- Key Takeaways
- South Asia and Pacific Market Analysis 2021 to 2025 and Forecast 2026 to 2036, By Country
- Historical Market Size Value (USD Million) Trend Analysis By Market Taxonomy, 2021 to 2025
- Market Size Value (USD Million) Forecast By Market Taxonomy, 2026 to 2036
- By Country
- India
- ASEAN
- Australia & New Zealand
- Rest of South Asia and Pacific
- By Product Type
- By Application
- By End Use Industry
- By Form
- By Distribution Channel
- By Function
- By Country
- Market Attractiveness Analysis
- By Country
- By Product Type
- By Application
- By End Use Industry
- By Form
- By Distribution Channel
- By Function
- Key Takeaways
- Middle East & Africa Market Analysis 2021 to 2025 and Forecast 2026 to 2036, By Country
- Historical Market Size Value (USD Million) Trend Analysis By Market Taxonomy, 2021 to 2025
- Market Size Value (USD Million) Forecast By Market Taxonomy, 2026 to 2036
- By Country
- Kingdom of Saudi Arabia
- Other GCC Countries
- Turkiye
- South Africa
- Other African Union
- Rest of Middle East & Africa
- By Product Type
- By Application
- By End Use Industry
- By Form
- By Distribution Channel
- By Function
- By Country
- Market Attractiveness Analysis
- By Country
- By Product Type
- By Application
- By End Use Industry
- By Form
- By Distribution Channel
- By Function
- Key Takeaways
- Key Countries Market Analysis
- USA
- Pricing Analysis
- Market Share Analysis, 2025
- By Product Type
- By Application
- By End Use Industry
- By Form
- By Distribution Channel
- By Function
- Canada
- Pricing Analysis
- Market Share Analysis, 2025
- By Product Type
- By Application
- By End Use Industry
- By Form
- By Distribution Channel
- By Function
- Mexico
- Pricing Analysis
- Market Share Analysis, 2025
- By Product Type
- By Application
- By End Use Industry
- By Form
- By Distribution Channel
- By Function
- Brazil
- Pricing Analysis
- Market Share Analysis, 2025
- By Product Type
- By Application
- By End Use Industry
- By Form
- By Distribution Channel
- By Function
- Chile
- Pricing Analysis
- Market Share Analysis, 2025
- By Product Type
- By Application
- By End Use Industry
- By Form
- By Distribution Channel
- By Function
- Germany
- Pricing Analysis
- Market Share Analysis, 2025
- By Product Type
- By Application
- By End Use Industry
- By Form
- By Distribution Channel
- By Function
- UK
- Pricing Analysis
- Market Share Analysis, 2025
- By Product Type
- By Application
- By End Use Industry
- By Form
- By Distribution Channel
- By Function
- Italy
- Pricing Analysis
- Market Share Analysis, 2025
- By Product Type
- By Application
- By End Use Industry
- By Form
- By Distribution Channel
- By Function
- Spain
- Pricing Analysis
- Market Share Analysis, 2025
- By Product Type
- By Application
- By End Use Industry
- By Form
- By Distribution Channel
- By Function
- France
- Pricing Analysis
- Market Share Analysis, 2025
- By Product Type
- By Application
- By End Use Industry
- By Form
- By Distribution Channel
- By Function
- India
- Pricing Analysis
- Market Share Analysis, 2025
- By Product Type
- By Application
- By End Use Industry
- By Form
- By Distribution Channel
- By Function
- ASEAN
- Pricing Analysis
- Market Share Analysis, 2025
- By Product Type
- By Application
- By End Use Industry
- By Form
- By Distribution Channel
- By Function
- Australia & New Zealand
- Pricing Analysis
- Market Share Analysis, 2025
- By Product Type
- By Application
- By End Use Industry
- By Form
- By Distribution Channel
- By Function
- China
- Pricing Analysis
- Market Share Analysis, 2025
- By Product Type
- By Application
- By End Use Industry
- By Form
- By Distribution Channel
- By Function
- Japan
- Pricing Analysis
- Market Share Analysis, 2025
- By Product Type
- By Application
- By End Use Industry
- By Form
- By Distribution Channel
- By Function
- South Korea
- Pricing Analysis
- Market Share Analysis, 2025
- By Product Type
- By Application
- By End Use Industry
- By Form
- By Distribution Channel
- By Function
- Russia
- Pricing Analysis
- Market Share Analysis, 2025
- By Product Type
- By Application
- By End Use Industry
- By Form
- By Distribution Channel
- By Function
- Poland
- Pricing Analysis
- Market Share Analysis, 2025
- By Product Type
- By Application
- By End Use Industry
- By Form
- By Distribution Channel
- By Function
- Hungary
- Pricing Analysis
- Market Share Analysis, 2025
- By Product Type
- By Application
- By End Use Industry
- By Form
- By Distribution Channel
- By Function
- Kingdom of Saudi Arabia
- Pricing Analysis
- Market Share Analysis, 2025
- By Product Type
- By Application
- By End Use Industry
- By Form
- By Distribution Channel
- By Function
- Turkiye
- Pricing Analysis
- Market Share Analysis, 2025
- By Product Type
- By Application
- By End Use Industry
- By Form
- By Distribution Channel
- By Function
- South Africa
- Pricing Analysis
- Market Share Analysis, 2025
- By Product Type
- By Application
- By End Use Industry
- By Form
- By Distribution Channel
- By Function
- USA
- Market Structure Analysis
- Competition Dashboard
- Competition Benchmarking
- Market Share Analysis of Top Players
- By Regional
- By Product Type
- By Application
- By End Use Industry
- By Form
- By Distribution Channel
- By Function
- Competition Analysis
- Competition Deep Dive
- Solvay SA
- Overview
- Product Portfolio
- Profitability by Market Segments (Product/Age /Sales Channel/Region)
- Sales Footprint
- Strategy Overview
- Marketing Strategy
- Product Strategy
- Channel Strategy
- Evonik Industries AG
- Cabot Corporation
- Wacker Chemie AG
- PPG Industries
- PQ Corporation
- Solvay SA
- Competition Deep Dive
- Assumptions & Acronyms Used


