Laminated Tubes Market Size, Share, and Forecast Outlook 2025 to 2035

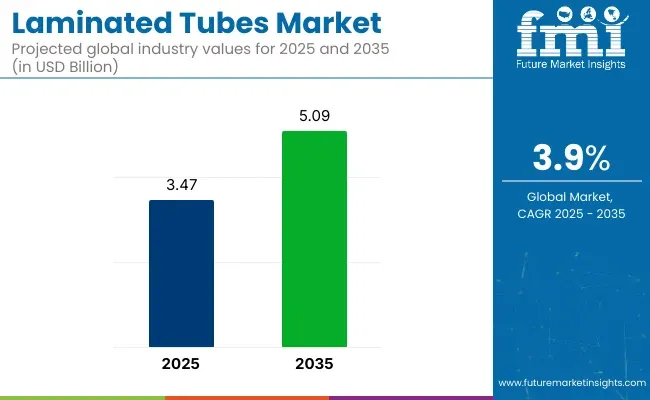
The global laminated tubes market is estimated to generate USD 3.47 billion in 2025 and is projected to reach USD 5.09 billion by 2035, with a compound annual growth rate (CAGR) of 3.9% during the forecast period. Laminated tubes are widely used across various industries, including cosmetics, pharmaceuticals, and food, due to their superior barrier properties, lightweight design, and excellent printability, making them ideal for packaging products that require protection from light, air, and moisture.

Recent developments in the laminated tubes market highlight a significant shift towards sustainability and innovation. Manufacturers are increasingly focusing on producing eco-friendly laminated tubes by incorporating recyclable materials and reducing plastic content.

This move aligns with the growing consumer demand for sustainable packaging solutions and stricter environmental regulations. Additionally, advancements in printing technologies have enabled brands to achieve high-quality, customizable designs on laminated tubes, enhancing product appeal and brand identity.
Laminated Tubes Market

Attribute Value
Market Size in 2025 USD 3.47 billion
Market Size in 2035 USD 5.09 billion
CAGR (2025 to 2035) 3.9%

In 2024, Huhtamäki Oyj introduced the blueloop™ Tube ONE, a groundbreaking high-barrier laminated tube that eliminates the need for EVOH (ethylene vinyl alcohol) in its construction. This innovation offers enhanced recyclability and cost-effectiveness, aligning with the industry's shift towards more sustainable packaging solutions. The blueloop™ Tube ONE has been recognized with the prestigious "Tube of the Year" award, underscoring its significance in advancing eco-friendly packaging technologies. This was officially announced in the company's press release.

The market's growth is also driven by the expanding applications of laminated tubes in various sectors. In the cosmetics industry, laminated tubes are preferred for packaging creams, lotions, and other personal care products due to their ability to maintain product integrity and enhance shelf life.

The pharmaceutical sector utilizes laminated tubes for packaging ointments and gels, ensuring precise dosage and preventing contamination. In the food industry, laminated tubes are used for packaging sauces and condiments, offering convenience and portion control to consumers.

As the laminated tubes market continues to evolve, ongoing research and development efforts are expected to lead to the introduction of more specialized and efficient products. These advancements will cater to the diverse needs of industries seeking to leverage laminated tubes for improved packaging solutions, further driving the market's growth and impact on global packaging trends

Semi Annual Market Update

The below table presents the expected CAGR for the global laminated tubes market over several semi-annual periods spanning from 2024 to 2034.

Particular Value CAGR
H1 (2024 to 2034) 1.8%
H2 (2024 to 2034) 3.0%
H1 (2025 to 2035) 2.7%
H2 (2025 to 2035) 3.9%

In the first half (H1) of the decade from 2024 to 2034, the business is predicted to surge at a CAGR of 1.8%, followed by a slightly higher growth rate of 3.0% in the second half (H2) of the same decade. Moving into the subsequent period, from H1 2024 to H2 2034, the CAGR is projected to decrease slightly to 2.7% in the first half and remain relatively moderate at 3.9% in the second half. In the first half (H1) the market witnessed a decrease of 90 BPS while in the second half (H2), the market witnessed an increase of 90 BPS.

Analyzing Laminated Tubes Market by Top Investment Segments

The global laminated tubes market is projected to experience strong growth from 2025 to 2035. Key segments contributing to this growth include aluminum barrier laminated (ABL) tubes and the 50 to 100 ml capacity. These segments are driven by increasing demand for packaging solutions that offer superior protection, convenience, and sustainability across industries such as cosmetics, pharmaceuticals, and food & beverages. Leading companies like Amcor and Essel Propack are expanding their offerings to cater to the evolving needs of the packaging market.

Aluminum Barrier Laminated (ABL) Tubes to Lead Market with Superior Protection and Durability

Aluminum barrier laminated (ABL) tubes are expected to account for 59.7% of the market share in 2025. This segment dominates due to ABL tubes' exceptional barrier properties, which protect the contents from air, moisture, and light, ensuring longer shelf life and maintaining product integrity.
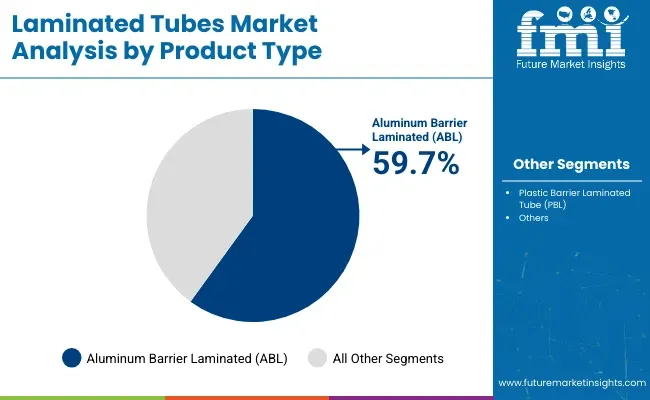
Laminated Tubes Market Analysis By Product Type

These tubes are particularly favored in the cosmetics, pharmaceuticals, and food industries, where preserving the quality of the product is crucial. ABL tubes are ideal for packaging sensitive products such as creams, gels, ointments, and food pastes, offering both protection and convenience.

Key players like Amcor and Essel Propack are innovating in the ABL segment by using advanced materials and manufacturing techniques to create stronger, more sustainable packaging solutions. The growth of eco-friendly packaging is further driving the adoption of ABL tubes, as they offer recyclability and reduced environmental impact compared to other plastic-based packaging options. As industries continue to prioritize product protection and sustainability, ABL tubes are expected to remain a dominant segment in the laminated tubes market.

50 to 100 ml Capacity Segment Poised for Growth with Versatility and Consumer Preference

The 50 to 100 ml capacity segment is projected to hold 57.2% of the market share in 2025. This segment is experiencing strong growth driven by the versatility and consumer preference for medium-sized packaging across various industries.
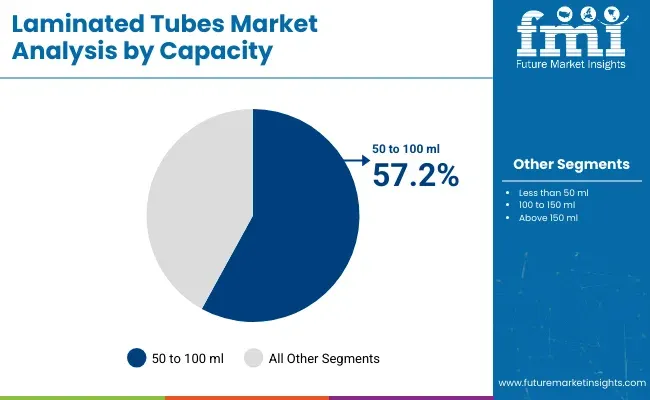
Laminated Tubes Market Analysis By Capacity

The 50 to 100 ml range is particularly popular for personal care products such as lotions, shampoos, toothpaste, and pharmaceuticals, where the size is ideal for both retail and travel applications. This capacity is also well-suited for products that require precise dosing or are used frequently, offering an optimal balance between product quantity and convenience.

Manufacturers in the laminated tubes market, including companies like Mondi and Huhtamaki, are focusing on expanding their product offerings within this capacity range by developing functional, user-friendly designs. Innovations in tube dispensing, ease of use, and improved sealing technology are enhancing the appeal of 50 to 100 ml laminated tubes.

The ongoing trend toward smaller, more convenient packaging solutions, along with the growth of e-commerce and on-the-go lifestyles, is further supporting the strong demand for this capacity segment. As consumer demand for smaller, more sustainable packaging grows, the 50 to 100 ml capacity segment is expected to continue its strong market position.

Key Industry Highlights

Need for Barrier Protective Packaging Propels Laminated Tubes Demand

The global laminated tubes market is driven by the growing demand for barrier protective packaging. Since consumers require products to have long shelf life and better protection against external forces, the laminated multi-layered tubes has become the ideal solution. For instance, moisture, oxygen, and light penetration are barred by barrier layers made of aluminum or EVOH.

Industrially, today, more pharma, food and cosmetic brands are turning their attention toward using laminated tubes for products while ensuring their safe quality. As hygiene awareness improves and the value of convenience gets higher, even more customers fall in line and demand this innovative packaging option, which not only supports market interest in the preference for more and more green friendly packaging options.

Pharma & Cosmetic Industry Push Demand for Laminated Tubes for Enhance Product Protection and Appeal

Laminated tubes are fast becoming a preferred choice in the pharmaceutical industry, as there are stringent regulatory standards on the protection of products, especially ointments, gels, and creams. Such tubes possess better barrier properties to ensure sensitive products remain safe and effective, free from contamination, fresh, and with longer shelf life.

Demand for laminated tubes is increasing in the cosmetics and personal care industries due to their premium, visually attractive packaging that addresses consumer needs. Laminated tubes are flexible, and a brand can get custom designs with vibrant graphics; hence, laminated tubes can be very appealing for skincare, haircare, and hygiene products. The combination of functionality benefits with versatility places laminated tubes as the leading choice in the global market.

Availability of Alternative and Environmental Friendly Packaging May Hinder Growth

As the laminated tubes market continues to grow there is more competition from alternative packaging solutions such as flexible pouches, plastic bottles and airless pumps. These alternatives offer similar functionality in terms of ease of use protection against contaminants and efficient dispensing but typically are lower cost. Flexible pouches are lightweight and convenient for transportation.

Airless pumps preserve the product with better quality as they ensure fewer risks of contamination. Importantly, green products have tremendous market drive due to the rise of biodegradable and compostable packaging among consumers and brands focusing on sustainability. If laminated tubes fail to adjust and become more environmentally friendly by changing their production materials then this future may hinder growth due primarily in the form of greener alternatives.

Market Concentration

Tier 1 companies comprise market leaders capturing significant market share in laminated tubes market. These market leaders are characterized by high production capacity and a wide product portfolio. These market leaders are distinguished by their extensive expertise in manufacturing across multiple packaging formats and a broad geographical reach, underpinned by a robust consumer base.

They provide a wide range of series including recycling and manufacturing utilizing the latest technology and meeting the regulatory standards providing the highest quality. Prominent companies within tier 1 include CCL Industries, Inc., Berry Global Group, Inc., Albéa S.A. and Hoffman Neopac AG.

Tier 2 companies include mid-size players having presence in specific regions and highly influencing the local market. These are characterized by a strong presence overseas and strong market knowledge. These market players have good technology and ensure regulatory compliance but may not have advanced technology and wide global reach.

Prominent companies in tier 2 include Huhtamäki Oyj, Essel Propack Limited, ALLTUB Group, Montebello Packaging Inc., LINHARDT GmbH & Co. KG., CTL PACK, APackaging Group, Tubapack A.S., Antilla Propack Inc., Guangzhou Rego Packing Industry Co., Ltd and San Ying Packaging (Jiangsu) Co., Ltd.

Tier 3 includes the majority of small-scale companies operating at the local presence and serving niche markets. These companies are notably oriented towards fulfilling local market demands and are consequently classified within the tier 3 share segment. They are small-scale players and have limited geographical reach. Tier 3, within this context, is recognized as an unorganized market, denoting a sector characterized by a lack of extensive structure and formalization when compared to organized competitors.

Country-wise Insights

The section below covers the future forecast for the laminated tubes market in terms of countries. Information on key countries in several parts of the globe, including North America, Latin America, East Asia, South Asia and Pacific, Western Europe, Eastern Europe and MEA is provided. USA is expected to account for a CAGR of 2.9% through 2035. In Europe, Spain is projected to witness a CAGR of 2.2% by 2035.
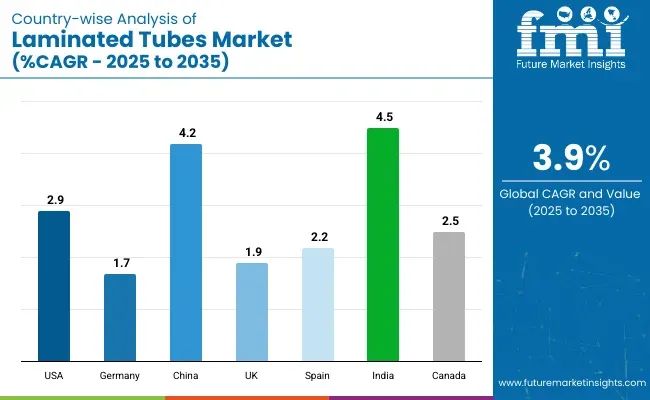
Country Wise Analysis Of Laminated Tubes Market Cagr 2025 To 2035

Countries Value CAGR (2025 to 2035)
USA 2.9%
Germany 1.7%
China 4.2%
UK 1.9%
Spain 2.2%
India 4.5%
Canada 2.5%

USA Consumer Demand for Convenient & Easy-to-Use Laminated Tube Packaging

Consumer demand for convenient packaging in the USA raises demand for laminated tubes mainly for personal care and healthcare products. Consumers crave easy-to-use products that are portable and mess-free. Laminated tubes possess these advantages through their lightness, squeezability, and controlled dispensing to perfectly work for on-the-go use.

For instance, toothpaste tubes from companies like Colgate and Sensodyne are laminated so that one can squeeze down the last drop from the tube without wasting a lot of the product inside. This is something that people greatly value because it contributes to the total user experience; therefore, laminated tubes become the best for daily personal care items.

Consumer Preference for Premium Packaging in the UK Drives Demand for Laminated Tube Packaging

The demand for premium packaging in the UK market is increasing, especially among personal care and luxury goods as these consumers are investing in outwardly attractive, high-quality packaging. Laminated tubes are preferred as an effective means to combine functionality with the visual appearance for that premium look and feel.

In addition, these tubes also meet consumers' demand for convenience. For instance, very expensive high-class skincare products always use laminated tubes with a flip top in order not to waste a thing while applying and for a friendly use in their everyday applications. Such friendly use is reflective of the customer need for both the convenience as well as quality during daily applications.

Competitive Landscape

Key players of global laminated tubes industry are developing and launching new products in the market. They are integrating with different firms and extending their geographical presence. Few of them are also collaborating and partnering with local brands and start-up companies

Key Developments:

  • In October 2024, Neopac introduced a new Polyfoil® Mono-Material Barrier (MMB) Mini tubes downsized diameters of 13.5-16mm, the tiny tubes expand Neopac’s award-winning line of high-barrier mono-material solutions.
  • In October 2024, Berry Global Group, Inc. announced investment to expand and enhance the company’s tube manufacturing capabilities using its new, patented DecoFusion™ hybrid technology process

Key Players in Laminated Tubes Market

  • CCL Industries, Inc.
  • Berry Global Group, Inc.
  • Albéa S.A.
  • Hoffman Neopac AG
  • Huhtamäki Oyj
  • Essel Propack Limited
  • ALLTUB Group
  • Montebello Packaging Inc.
  • LINHARDT GmbH & Co. KG.
  • CTL PACK
  • APackaging Group
  • Tubapack A.S.
  • Antilla Propack Inc.
  • Guangzhou Rego Packing Industry Co., Ltd.
  • San Ying Packaging (Jiangsu) Co., Ltd.

Report Scope Table - Laminated Tubes Market

Report Attributes Details
Current Total Market Size (2025) USD 3.47 billion
Projected Market Size (2035) USD 5.09 billion
CAGR (2025 to 2035) 3.9%
Base Year for Estimation 2024
Historical Period 2020 to 2024
Projections Period 2025 to 2035
Quantitative Units USD billion for dollar sales
Product Types Analyzed (Segment 1) Plastic Barrier Laminated Tube (Ethylene Vinyl Alcohol, Polyamide (PA), Polyester), Aluminum Barrier Laminated Tube
Neck Diameters Analyzed (Segment 2) 13.5 mm, 16 mm, Other Customized Sizes
Capacities Analyzed (Segment 3) Less than 50 ml, 50 to 100 ml, 100 to 150 ml, Above 150 ml
Cap Types Analyzed (Segment 4) Stand-up Cap, Nozzle Cap, Fez Cap, Flip Top Cap, Others
End-uses Analyzed (Segment 5) Cosmetics (Haircare, Skincare/Facial Care, Body Care, Make-up, Baby Care, Hand Care), Commercial (Sealants & Adhesives, Lubricants, Others), Pharmaceuticals (Ointments, Creams), Oral Care, Home & Other Personal Care (Laundry Gel, Toiletries & Hand Wash Gels, Others), Food, Others (Paints, Crayons, Shoe Polish)
Regions Covered North America, Latin America, East Asia, South Asia & Pacific, Western Europe, Eastern Europe, Middle East and Africa
Countries Covered United States, Canada, Mexico, Brazil, Argentina, Germany, France, United Kingdom, Italy, Spain, Netherlands, China, India, Japan, South Korea, ANZ, GCC Countries, South Africa
Key Players influencing the Laminated Tubes Market CCL Industries, Inc., Berry Global Group, Inc., Albéa S.A., Hoffman Neopac AG, Huhtamäki Oyj, Essel Propack Limited, ALLTUB Group, Montebello Packaging Inc., LINHARDT GmbH & Co. KG., CTL PACK
Additional Attributes dollar sales, CAGR trends, product type segmentation, neck diameter demand, cap type preferences, capacity distribution, end-use industry trends, competitor dollar sales & market share, regional growth patterns

Global Laminated Tubes Market Segmentation

By Product Type:

In terms of product type, the industry is segmented into plastic barrier laminated tube (PBL) and aluminum barrier laminated tube (ABL). Plastic barrier laminated tube include ethylene vinyl alcohol, polyamide (PA) and polyester.

By Neck Diameter:

In terms of neck diameter, the industry is segmented into include 13.5 mm, 16 mm and other customized sizes.

By Capacity:

Laminated tubes include multiple capacities such as less than 50 ml, 50 to 100 ml, 100 to 150 ml and above 150 ml.

By Cap Type:

In terms of cap type, the industry is segmented into stand-up cap, nozzle cap, fez cap, flip top cap and others.

By End Use:

End users of laminated tubes include cosmetics, commercial, pharmaceuticals, oral care, home & other personal care, food and others (paints, crayons, shoe polish, etc.). Cosmetics include haircare, skincare/facial care, body care, make-up, baby care and hand care. Commercial includes sealants & adhesives, lubricants and others (specialty grease and pesticides.). Pharmaceuticals include ointments and creams. Home & other personal care include laundry gel, toiletries & hand wash gels and others.

Haircare further includes shampoo, conditioner, hair oil, hair gels, hair color, and other hair styling products. Skincare/facial care includes cleanser, toner, moisturizer, sunscreen and serums & tonics. Body care includes body scrub, body wash, moisturizer and sunscreen. Make-up includes foundation, concealer, eyeshadow, eyeliner/ mascara and lipstick/lip gloss. Baby care includes baby shampoo/ baby wash, baby lotion, sunscreen and baby oil. Hand care includes hand wash/ gel, hand cream/lotions and hand sanitizer.

By Region:

Key Countries of North America, Latin America, East Asia, South Asia & Pacific, Western Europe, Eastern Europe and Middle East & Africa are covered.

Table of Content

  1. Executive Summary
  2. Industry Introduction, including Taxonomy and Market Definition
  3. Market Trends and Success Factors, including Macro-economic Factors, Market Dynamics, and Recent Industry Developments
  4. Global Market Demand Analysis 2020 to 2024 and Forecast 2025 to 2035, including Historical Analysis and Future Projections
  5. Global Market Analysis 2020 to 2024 and Forecast 2025 to 2035
    • Product Type
    • Cap Type
    • Capacity
    • Neck Diameter
    • End Use
  6. Global Market Analysis 2020 to 2024 and Forecast 2025 to 2035, By Product Type
    • Plastic Barrier Laminated (PBL)
    • Aluminum Barrier Laminated (ABL)
  7. Global Market Analysis 2020 to 2024 and Forecast 2025 to 2035, By Cap Type
    • Stand-Up Cap
    • Nozzle Cap
    • Fez Cap
    • Flip Top Cap
    • Other Caps
  8. Global Market Analysis 2020 to 2024 and Forecast 2025 to 2035, By Capacity
    • Less Than 50 ml
    • 50 to 100 ml
    • 101 to 150 ml
    • Above 150 ml
  9. Global Market Analysis 2020 to 2024 and Forecast 2025 to 2035, By Neck Diameter
    • 13.5 mm
    • 16 mm
    • Other Customized Sizes
  10. Global Market Analysis 2020 to 2024 and Forecast 2025 to 2035, By End Use
    • Cosmetics
    • Commercial
    • Pharmaceuticals
    • Oral Care
    • Home & Other Personal Care
    • Food
    • Others (Paints, Crayons, Shoe Polish, etc.)
  11. Global Market Analysis 2020 to 2024 and Forecast 2025 to 2035, By Region
    • North America
    • Latin America
    • Western Europe
    • Eastern Europe
    • East Asia
    • South Asia & Pacific
    • Middle East & Africa
  12. North America Sales Analysis 2020 to 2024 and Forecast 2025 to 2035, by Key Segments and Countries
  13. Latin America Sales Analysis 2020 to 2024 and Forecast 2025 to 2035, by Key Segments and Countries
  14. Western Europe Sales Analysis 2020 to 2024 and Forecast 2025 to 2035, by Key Segments and Countries
  15. Eastern Europe Sales Analysis 2020 to 2024 and Forecast 2025 to 2035, by Key Segments and Countries
  16. East Asia Sales Analysis 2020 to 2024 and Forecast 2025 to 2035, by Key Segments and Countries
  17. South Asia & Pacific Sales Analysis 2020 to 2024 and Forecast 2025 to 2035, by Key Segments and Countries
  18. Middle East & Africa Sales Analysis 2020 to 2024 and Forecast 2025 to 2035, by Key Segments and Countries
  19. Sales Forecast 2025 to 2035 by Product Type, Cap Type, Capacity, Neck Diameter, and End Use for 30 Countries
  20. Competition Outlook, including Market Structure Analysis, Company Share Analysis by Key Players, and Competition Dashboard
  21. Company Profile
    • CCL Industries, Inc.
    • Berry Global Group, Inc.
    • Albéa S.A.
    • Hoffman Neopac AG
    • Huhtamäki Oyj
    • Essel Propack Limited
    • ALLTUB Group
    • Montebello Packaging Inc.
    • LINHARDT GmbH & Co. KG.
    • CTL PACK

List of Tables

  • Table 01: Global Market Volume (Million Units) Analysis, by Product Type, 2020 to 2035
  • Table 02: Global Market Value (US$ million) Analysis, by Product Type, 2020 to 2035
  • Table 03: Global Market Volume (Million Units) Analysis, by Capacity, 2020 to 2035
  • Table 04: Global Market Value (US$ million) Analysis, by Capacity, 2020 to 2035
  • Table 05: Global Market Volume (Million Units) Analysis, by Cap Type, 2020 to 2035
  • Table 06: Global Market Value (US$ million) Analysis, by Cap Type, 2020 to 2035
  • Table 07: Global Market Volume (Million Units) Analysis, by End Use, 2020 to 2035
  • Table 08: Global Market Value (US$ million) Analysis, by End Use, 2020 to 2035
  • Table 09: Global Market Volume (Million Units) Analysis, by Region, 2020 to 2035
  • Table 10: Global Market Value (US$ million) Analysis, by Region, 2020 to 2035
  • Table 11: North America Market Volume (Million Units) Analysis, by Product Type, 2020 to 2035
  • Table 12: North America Market Value (US$ million) Analysis, by Product Type, 2020 to 2035
  • Table 13: North America Market Volume (Million Units) Analysis, by Capacity, 2020 to 2035
  • Table 14: North America Market Value (US$ million) Analysis, by Capacity, 2020 to 2035
  • Table 15: North America Market Volume (Million Units) Analysis, by Cap Type, 2020 to 2035
  • Table 16: North America Market Value (US$ million) Analysis, by Cap Type, 2020 to 2035
  • Table 17: North America Market Volume (Million Units) Analysis, by End Use, 2020 to 2035
  • Table 18: North America Market Value (US$ million) Analysis, by End Use, 2020 to 2035
  • Table 19: North America Market Volume (Million Units) Analysis, by Country, 2020 to 2035
  • Table 20: North America Market Value (US$ million) Analysis, by Country, 2020 to 2035
  • Table 21: Latin America Market Volume (Million Units) Analysis, by Product Type, 2020 to 2035
  • Table 22: Latin America Market Value (US$ million) Analysis, by Product Type, 2020 to 2035
  • Table 23: Latin America Market Volume (Million Units) Analysis, by Capacity, 2020 to 2035
  • Table 24: Latin America Market Value (US$ million) Analysis, by Capacity, 2020 to 2035
  • Table 25: Latin America Market Volume (Million Units) Analysis, by Cap Type, 2020 to 2035
  • Table 26: Latin America Market Value (US$ million) Analysis, by Cap Type, 2020 to 2035
  • Table 27: Latin America Market Volume (Million Units) Analysis, by End Use, 2020 to 2035
  • Table 28: Latin America Market Value (US$ million) Analysis, by End Use, 2020 to 2035
  • Table 29: Latin America Market Volume (Million Units) Analysis, by Country, 2020 to 2035
  • Table 30: Latin America Market Value (US$ million) Analysis, by Country, 2020 to 2035
  • Table 31: Europe Market Volume (Million Units) Analysis, by Product Type, 2020 to 2035
  • Table 32: Europe Market Value (US$ million) Analysis, by Product Type, 2020 to 2035
  • Table 33: Europe Market Volume (Million Units) Analysis, by Capacity, 2020 to 2035
  • Table 34: Europe Market Value (US$ million) Analysis, by Capacity, 2020 to 2035
  • Table 35: Europe Market Volume (Million Units) Analysis, by Cap Type, 2020 to 2035
  • Table 36: Europe Market Value (US$ million) Analysis, by Cap Type, 2020 to 2035
  • Table 37: Europe Market Volume (Million Units) Analysis, by End Use, 2020 to 2035
  • Table 38: Europe Market Value (US$ million) Analysis, by End Use, 2020 to 2035
  • Table 39: Europe Market Volume (Million Units) Analysis, by Country, 2020 to 2035
  • Table 40: Europe Market Value (US$ million) Analysis, by Country, 2020 to 2035
  • Table 41: Middle East and Africa Market Volume (Million Units) Analysis, by Product Type, 2020 to 2035
  • Table 42: Middle East and Africa Market Value (US$ million) Analysis, by Product Type, 2020 to 2035
  • Table 43: Middle East and Africa Market Volume (Million Units) Analysis, by Capacity, 2020 to 2035
  • Table 44: Middle East and Africa Market Value (US$ million) Analysis, by Capacity, 2020 to 2035
  • Table 45: Middle East and Africa Market Volume (Million Units) Analysis, by Cap Type, 2020 to 2035
  • Table 46: Middle East and Africa Market Value (US$ million) Analysis, by Cap Type, 2020 to 2035
  • Table 47: Middle East and Africa Market Volume (Million Units) Analysis, by End Use, 2020 to 2035
  • Table 48: Middle East and Africa Market Value (US$ million) Analysis, by End Use, 2020 to 2035
  • Table 49: Middle East and Africa Market Volume (Million Units) Analysis, by Country, 2020 to 2035
  • Table 50: Middle East and Africa Market Value (US$ million) Analysis, by Country, 2020 to 2035
  • Table 51: East Asia Market Volume (Million Units) Analysis, by Product Type, 2020 to 2035
  • Table 52: East Asia Market Value (US$ million) Analysis, by Product Type, 2020 to 2035
  • Table 53: East Asia Market Volume (Million Units) Analysis, by Capacity, 2020 to 2035
  • Table 54: East Asia Market Value (US$ million) Analysis, by Capacity, 2020 to 2035
  • Table 55: East Asia Market Volume (Million Units) Analysis, by Cap Type, 2020 to 2035
  • Table 56: East Asia Market Value (US$ million) Analysis, by Cap Type, 2020 to 2035
  • Table 57: East Asia Market Volume (Million Units) Analysis, by End Use, 2020 to 2035
  • Table 58: East Asia Market Value (US$ million) Analysis, by End Use, 2020 to 2035
  • Table 59: East Asia Market Volume (Million Units) Analysis, by Country, 2020 to 2035
  • Table 60: East Asia Market Value (US$ million) Analysis, by Country, 2020 to 2035
  • Table 61: South Asia Market Volume (Million Units) Analysis, by Product Type, 2020 to 2035
  • Table 62: South Asia Market Value (US$ million) Analysis, by Product Type, 2020 to 2035
  • Table 63: South Asia Market Volume (Million Units) Analysis, by Capacity, 2020 to 2035
  • Table 64: South Asia Market Value (US$ million) Analysis, by Capacity, 2020 to 2035
  • Table 65: South Asia Market Volume (Million Units) Analysis, by Cap Type, 2020 to 2035
  • Table 66: South Asia Market Value (US$ million) Analysis, by Cap Type, 2020 to 2035
  • Table 67: South Asia Market Volume (Million Units) Analysis, by End Use, 2020 to 2035
  • Table 68: South Asia Market Value (US$ million) Analysis, by End Use, 2020 to 2035
  • Table 69: South Asia Market Volume (Million Units) Analysis, by Country, 2020 to 2035
  • Table 70: South Asia Market Value (US$ million) Analysis, by Country, 2020 to 2035
  • Table 71: Oceania Market Volume (Million Units) Analysis, by Product Type, 2020 to 2035
  • Table 72: Oceania Market Value (US$ million) Analysis, by Product Type, 2020 to 2035
  • Table 73: Oceania Market Volume (Million Units) Analysis, by Capacity, 2020 to 2035
  • Table 74: Oceania Market Value (US$ million) Analysis, by Capacity, 2020 to 2035
  • Table 75: Oceania Market Volume (Million Units) Analysis, by Cap Type, 2020 to 2035
  • Table 76: Oceania Market Value (US$ million) Analysis, by Cap Type, 2020 to 2035
  • Table 77: Oceania Market Volume (Million Units) Analysis, by End Use, 2020 to 2035
  • Table 78: Oceania Market Value (US$ million) Analysis, by End Use, 2020 to 2035
  • Table 79: Oceania Market Volume (Million Units) Analysis, by Country, 2020 to 2035
  • Table 80: Oceania Market Value (US$ million) Analysis, by Country, 2020 to 2035

List of Figures

  • Figure 01: Global Market Share Analysis, by Product Type, 2025 & 2035
  • Figure 02: Global Y-o-Y Analysis, by Product Type, 2020 to 2035
  • Figure 03: Global Market Attractiveness Analysis, by Product Type, 2025 to 2035
  • Figure 04: Global Market Share Analysis, by Capacity, 2025 & 2035
  • Figure 05: Global Y-o-Y Analysis, by Capacity, 2020 to 2035
  • Figure 06: Global Market Attractiveness Analysis, by Capacity, 2025 to 2035
  • Figure 07: Global Market Share Analysis, by Cap Type, 2025 & 2035
  • Figure 08: Global Y-o-Y Analysis, by Cap Type, 2020 to 2035
  • Figure 09: Global Market Attractiveness Analysis, by Cap Type, 2025 to 2035
  • Figure 10: Global Market Share Analysis, by End Use, 2025 & 2035
  • Figure 11: Global Y-o-Y Analysis, by End Use, 2020 to 2035
  • Figure 12: Global Market Attractiveness Analysis, by End Use, 2025 to 2035
  • Figure 13: Global Market Share Analysis, by Region 2025 & 2035
  • Figure 14: Global Y-o-Y Analysis, by Region, 2020 to 2035
  • Figure 15: Global Market Attractiveness Analysis, by Region, 2025 to 2035
  • Figure 16: North America Market Share Analysis, by Product Type, 2025 & 2035
  • Figure 17: North America Market Attractiveness Analysis, by Product Type, 2025 to 2035
  • Figure 18: North America Market Share Analysis, by Capacity, 2025 & 2035
  • Figure 19: North America Market Attractiveness Analysis, by Capacity, 2025 to 2035
  • Figure 20: North America Market Share Analysis, by Cap Type, 2025 & 2035
  • Figure 21: North America Market Attractiveness Analysis, by Cap Type, 2025 to 2035
  • Figure 22: North America Market Share Analysis, by End Use, 2025 & 2035
  • Figure 23: North America Market Attractiveness Analysis, by End Use, 2025 to 2035
  • Figure 24: North America Market Share Analysis, by Country, 2025 & 2035
  • Figure 25: North America Market Attractiveness Analysis, by Country, 2025 to 2035
  • Figure 26: Latin America Market Share Analysis, by Product Type, 2025 & 2035
  • Figure 27: Latin America Market Attractiveness Analysis, by Product Type, 2025 to 2035
  • Figure 28: Latin America Market Share Analysis, by Capacity, 2025 & 2035
  • Figure 29: Latin America Market Attractiveness Analysis, by Capacity, 2025 to 2035
  • Figure 30: Latin America Market Share Analysis, by Cap Type, 2025 & 2035
  • Figure 31: Latin America Market Attractiveness Analysis, by Cap Type, 2025 to 2035
  • Figure 32: Latin America Market Share Analysis, by End Use, 2025 & 2035
  • Figure 33: Latin America Market Attractiveness Analysis, by End Use, 2025 to 2035
  • Figure 34: Latin America Market Share Analysis, by Country, 2025 & 2035
  • Figure 35: Latin America Market Attractiveness Analysis, by Country, 2025 to 2035
  • Figure 36: Europe Market Share Analysis, by Product Type, 2025 & 2035
  • Figure 37: Europe Market Attractiveness Analysis, by Product Type, 2025 to 2035
  • Figure 38: Europe Market Share Analysis, by Capacity, 2025 & 2035
  • Figure 39: Europe Market Attractiveness Analysis, by Capacity, 2025 to 2035
  • Figure 40: Europe Market Share Analysis, by Cap Type, 2025 & 2035
  • Figure 41: Europe Market Attractiveness Analysis, by Cap Type, 2025 to 2035
  • Figure 42: Europe Market Share Analysis, by End Use, 2025 & 2035
  • Figure 43: Europe Market Attractiveness Analysis, by End Use, 2025 to 2035
  • Figure 44: Europe Market Share Analysis, by Country, 2025 & 2035
  • Figure 45: Europe Market Attractiveness Analysis, by Country, 2025 to 2035
  • Figure 46: Middle East and Africa Market Share Analysis, by Product Type, 2025 & 2035
  • Figure 47: Middle East and Africa Market Attractiveness Analysis, by Product Type, 2025 to 2035
  • Figure 48: Middle East and Africa Market Share Analysis, by Capacity, 2025 & 2035
  • Figure 49: Middle East and Africa Market Attractiveness Analysis, by Capacity, 2025 to 2035
  • Figure 50: Middle East and Africa Market Share Analysis, by Cap Type, 2025 & 2035
  • Figure 51: Middle East and Africa Market Attractiveness Analysis, by Cap Type, 2025 to 2035
  • Figure 52: Middle East and Africa Market Share Analysis, by End Use, 2025 & 2035
  • Figure 53: Middle East and Africa Market Attractiveness Analysis, by End Use, 2025 to 2035
  • Figure 54: Middle East and Africa Market Share Analysis, by Country, 2025 & 2035
  • Figure 55: Middle East and Africa Market Attractiveness Analysis, by Country, 2025 to 2035
  • Figure 56: East Asia Market Share Analysis, by Product Type, 2025 & 2035
  • Figure 57: East Asia Market Attractiveness Analysis, by Product Type, 2025 to 2035
  • Figure 58: East Asia Market Share Analysis, by Capacity, 2025 & 2035
  • Figure 59: East Asia Market Attractiveness Analysis, by Capacity, 2025 to 2035
  • Figure 60: East Asia Market Share Analysis, by Cap Type, 2025 & 2035
  • Figure 61: East Asia Market Attractiveness Analysis, by Cap Type, 2025 to 2035
  • Figure 62: East Asia Market Share Analysis, by End Use, 2025 & 2035
  • Figure 63: East Asia Market Attractiveness Analysis, by End Use, 2025 to 2035
  • Figure 64: East Asia Market Share Analysis, by Country, 2025 & 2035
  • Figure 65: East Asia Market Attractiveness Analysis, by Country, 2025 to 2035
  • Figure 66: South Asia Market Share Analysis, by Product Type, 2025 & 2035
  • Figure 67: South Asia Market Attractiveness Analysis, by Product Type, 2025 to 2035
  • Figure 68: South Asia Market Share Analysis, by Capacity, 2025 & 2035
  • Figure 69: South Asia Market Attractiveness Analysis, by Capacity, 2025 to 2035
  • Figure 70: South Asia Market Share Analysis, by Cap Type, 2025 & 2035
  • Figure 71: South Asia Market Attractiveness Analysis, by Cap Type, 2025 to 2035
  • Figure 72: South Asia Market Share Analysis, by End Use, 2025 & 2035
  • Figure 73: South Asia Market Attractiveness Analysis, by End Use, 2025 to 2035
  • Figure 74: South Asia Market Share Analysis, by Country, 2025 & 2035
  • Figure 75: South Asia Market Attractiveness Analysis, by Country, 2025 to 2035
  • Figure 76: Oceania Market Share Analysis, by Product Type, 2025 & 2035
  • Figure 77: Oceania Market Attractiveness Analysis, by Product Type, 2025 to 2035
  • Figure 78: Oceania Market Share Analysis, by Capacity, 2025 & 2035
  • Figure 79: Oceania Market Attractiveness Analysis, by Capacity, 2025 to 2035
  • Figure 80: Oceania Market Share Analysis, by Cap Type, 2025 & 2035
  • Figure 81: Oceania Market Attractiveness Analysis, by Cap Type, 2025 to 2035
  • Figure 82: Oceania Market Share Analysis, by End Use, 2025 & 2035
  • Figure 83: Oceania Market Attractiveness Analysis, by End Use, 2025 to 2035
  • Figure 84: Oceania Market Share Analysis, by Country, 2025 & 2035
  • Figure 85: Oceania Market Attractiveness Analysis, by Country, 2025 to 2035
  • Figure 86: United States Market Value Share Analysis, by Product Type, 2025 & 2035
  • Figure 87: United States Market Value Share Analysis, by Capacity, 2025 & 2035
  • Figure 88: United States Market Value Share Analysis, by Cap Type, 2025 & 2035
  • Figure 89: United States Market Value Share Analysis, by End Use, 2025 & 2035
  • Figure 90: Canada Market Value Share Analysis, by Product Type, 2025 & 2035
  • Figure 91: Canada Market Value Share Analysis, by Capacity, 2025 & 2035
  • Figure 92: Canada Market Value Share Analysis, by Cap Type, 2025 & 2035
  • Figure 93: Canada Market Value Share Analysis, by End Use, 2025 & 2035
  • Figure 94: Brazil Market Value Share Analysis, by Product Type, 2025 & 2035
  • Figure 95: Brazil Market Value Share Analysis, by Capacity, 2025 & 2035
  • Figure 96: Brazil Market Value Share Analysis, by Cap Type, 2025 & 2035
  • Figure 97: Brazil Market Value Share Analysis, by End Use, 2025 & 2035
  • Figure 98: Mexico Market Value Share Analysis, by Product Type, 2025 & 2035
  • Figure 99: Mexico Market Value Share Analysis, by Capacity, 2025 & 2035
  • Figure 100: Mexico Market Value Share Analysis, by Cap Type, 2025 & 2035
  • Figure 101: Mexico Market Value Share Analysis, by End Use, 2025 & 2035
  • Figure 102: Germany Market Value Share Analysis, by Product Type, 2025 & 2035
  • Figure 103: Germany Market Value Share Analysis, by Capacity, 2025 & 2035
  • Figure 104: Germany Market Value Share Analysis, by Cap Type, 2025 & 2035
  • Figure 105: Germany Market Value Share Analysis, by End Use, 2025 & 2035
  • Figure 106: Italy Market Value Share Analysis, by Product Type, 2025 & 2035
  • Figure 107: Italy Market Value Share Analysis, by Capacity, 2025 & 2035
  • Figure 108: Italy Market Value Share Analysis, by Cap Type, 2025 & 2035
  • Figure 109: Italy Market Value Share Analysis, by End Use, 2025 & 2035
  • Figure 110: France Market Value Share Analysis, by Product Type, 2025 & 2035
  • Figure 111: France Market Value Share Analysis, by Capacity, 2025 & 2035
  • Figure 112: France Market Value Share Analysis, by Cap Type, 2025 & 2035
  • Figure 113: France Market Value Share Analysis, by End Use, 2025 & 2035
  • Figure 114: The United Kingdom Market Value Share Analysis, by Product Type, 2025 & 2035
  • Figure 115: The United Kingdom Market Value Share Analysis, by Capacity, 2025 & 2035
  • Figure 116: The United Kingdom Market Value Share Analysis, by Cap Type, 2025 & 2035
  • Figure 117: The United Kingdom Market Value Share Analysis, by End Use, 2025 & 2035
  • Figure 118: Spain Market Value Share Analysis, by Product Type, 2025 & 2035
  • Figure 119: Spain Market Value Share Analysis, by Capacity, 2025 & 2035
  • Figure 120: Spain Market Value Share Analysis, by Cap Type, 2025 & 2035
  • Figure 121: Spain Market Value Share Analysis, by End Use, 2025 & 2035
  • Figure 122: Russia Market Value Share Analysis, by Product Type, 2025 & 2035
  • Figure 123: Russia Market Value Share Analysis, by Capacity, 2025 & 2035
  • Figure 124: Russia Market Value Share Analysis, by Cap Type, 2025 & 2035
  • Figure 125: Russia Market Value Share Analysis, by End Use, 2025 & 2035
  • Figure 126: Turkey Market Value Share Analysis, by Product Type, 2025 & 2035
  • Figure 127: Turkey Market Value Share Analysis, by Capacity, 2025 & 2035
  • Figure 128: Turkey Market Value Share Analysis, by Cap Type, 2025 & 2035
  • Figure 129: Turkey Market Value Share Analysis, by End Use, 2025 & 2035
  • Figure 130: South Africa Market Value Share Analysis, by Product Type, 2025 & 2035
  • Figure 131: South Africa Market Value Share Analysis, by Capacity, 2025 & 2035
  • Figure 132: South Africa Market Value Share Analysis, by Cap Type, 2025 & 2035
  • Figure 133: South Africa Market Value Share Analysis, by End Use, 2025 & 2035
  • Figure 134: GCC Countries Market Value Share Analysis, by Product Type, 2025 & 2035
  • Figure 135: GCC Countries Market Value Share Analysis, by Capacity, 2025 & 2035
  • Figure 136: GCC Countries Market Value Share Analysis, by Cap Type, 2025 & 2035
  • Figure 137: GCC Countries Market Value Share Analysis, by End Use, 2025 & 2035
  • Figure 138: Japan Market Value Share Analysis, by Product Type, 2025 & 2035
  • Figure 139: Japan Market Value Share Analysis, by Capacity, 2025 & 2035
  • Figure 140: Japan Market Value Share Analysis, by Cap Type, 2025 & 2035
  • Figure 141: Japan Market Value Share Analysis, by End Use, 2025 & 2035
  • Figure 142: South Korea Market Value Share Analysis, by Product Type, 2025 & 2035
  • Figure 143: South Korea Market Value Share Analysis, by Capacity, 2025 & 2035
  • Figure 144: South Korea Market Value Share Analysis, by Cap Type, 2025 & 2035
  • Figure 145: South Korea Market Value Share Analysis, by End Use, 2025 & 2035
  • Figure 146: India Market Value Share Analysis, by Product Type, 2025 & 2035
  • Figure 146: India Market Value Share Analysis, by Capacity, 2025 & 2035
  • Figure 148: India Market Value Share Analysis, by Cap Type, 2025 & 2035
  • Figure 149: India Market Value Share Analysis, by End Use, 2025 & 2035
  • Figure 150: China Market Value Share Analysis, by Product Type, 2025 & 2035
  • Figure 151: China Market Value Share Analysis, by Capacity, 2025 & 2035
  • Figure 152: China Market Value Share Analysis, by Cap Type, 2025 & 2035
  • Figure 153: China Market Value Share Analysis, by End Use, 2025 & 2035
  • Figure 154: Australia Market Value Share Analysis, by Product Type, 2025 & 2035
  • Figure 155: Australia Market Value Share Analysis, by Capacity, 2025 & 2035
  • Figure 156: Australia Market Value Share Analysis, by Cap Type, 2025 & 2035
  • Figure 157: Australia Market Value Share Analysis, by End Use, 2025 & 2035

Frequently Asked Questions

What is the future of global laminated tubes industry?

The global laminated tubes industry is projected to witness CAGR of 3.9% between 2025 and 2035.

What was the worth of the global laminated tubes industry in 2024?

The global laminated tubes industry stood at USD 3.40 billion in 2024.

What will the worth of global laminated tubes industry by 2035 end?

Global laminated tubes industry is anticipated to reach USD 5.09 billion by 2035 end.

Which region to showcase the highest CAGR during forecast period?

South Asia & Pacific is set to record a CAGR of 6.0% in assessment period.

Who are the key players of global laminated tubes industry?

The key players operating in the global laminated tubes industry include CCL Industries, Inc., Berry Global Group, Inc., Albéa S.A. and Hoffman Neopac AG.

Explore Packaging Formats Insights

Future Market Insights

Laminated Tubes Market