Phytosterols Market Outlook (2022 to 2032)

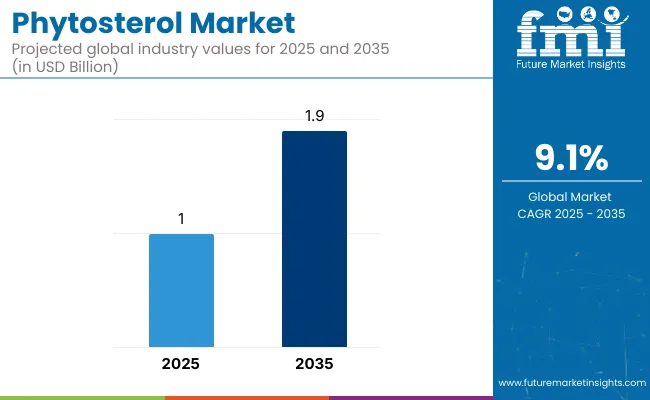
The global phytosterols market is expected to be valued at US$ 0.8 Billion in 2022 and is projected to grow at a CAGR of 9.1% during the forecast period (2022 to 2032). The market is likely to reach a valuation of US$ 2.0 Billion by 2032. The global phytosterols market is anticipated to showcase year-on-year (Y-o-Y) growth of 8.4% in 2022.

Attributes Key Statistics
Phytosterols Market Estimated Size (2022E) US$ 0.8 Billion
Projected Market Valuation (2032F) US$ 2.0 Billion
Value-based CAGR (2022 to 2032) 9.1%
Collective Value Share: Top 3 Countries (2021A) 34.5%

Phytosterols, also known as plant sterols, are found in plant cell membranes and are considered to be a group of naturally occurring compounds. Though phytosterols are similar to the cholesterol found in the human body in terms of structure, when consumed, they can block the absorption of body cholesterol in the digestive system. As a result, bad cholesterol absorption gets blocked in the body, thereby reducing blood cholesterol levels.

A few commercially prepared food items, including yogurt, juices, salad dressings, breakfast bars, and margarine can be fortified with phytosterols during manufacturing processes. Various phytosterols supplements are widely available in many grocery stores, health foods stores, and retail pharmacies across the globe.

If taken as a supplement, phytosterols may help lower LDL, as well as total cholesterol levels in the body. It can also help an individual to lose weight and prevent colorectal cancer.

Don't pay for what you don't need

Customize your report by selecting specific countries or regions and save 30%!

2017 to 2021 Phytosterols Demand Outlook Compared to 2022 to 2032 Forecast

Demand for phytosterols grew at 8.2% CAGR between 2017 and 2021. Phytosterols production is increasing across the globe as more consumers are including the product in their diet. The rising shift of consumers towards heart-healthy meal plans is expected to drive the market in the evaluation period.

Numerous research studies in the field of phytosterols have revolutionized the industry. Surging demand for dietary supplements supporting cardiovascular health is expected to boost the market. High per capita expenditure on pharmaceuticals and healthcare is another crucial factor that would propel growth. Spurred by the aforementioned factors, the global phytosterols market is projected to grow at a CAGR of 9.1% in the forecast period of 2022 to 2032.

Phytosterol Market

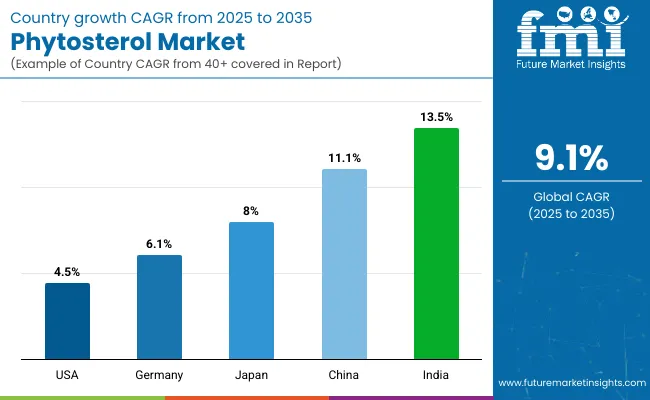
Country-wise Insights

How is the USA Phytosterols Market Progressing?

Government Agencies Recommend Use of Phytosterols Supplements

In the USA, the National Cholesterol Education Program has recommended people with high cholesterol levels consume 2 grams of phytosterols every day. The organization found strong evidence of the product’s effectiveness through Research and Development activities. It has further generated lucrative demand for phytosterol supplements in the USA

Also, the USA Food and Drug Administration (FDA) declared that foods containing 0.65 grams per serving of plant sterol esters may be taken twice per day with meals as part of a diet with a daily intake of a total of 1.3 grams, to maintain a low cholesterol level and saturated fat, to reduce risks of heart disease.

What is the Netherlands Phytosterols Market Outlook?

Demand for Non-GMO Phytosterols to Surge in the Future

Phytosterols, which are non-GMO in nature, are exhibiting high demand in the Netherlands for their ability to lower the risks of cardiovascular disease. The Federal Institute for Risk Assessment has evaluated the unwanted effects of plant sterol on human retinal microvessels for early diagnosis of cardiovascular risks in the Netherlands. According to findings, plant sterol can be consumed by children, as well as by individuals with moderate cholesterol levels.

Why is Japan's Phytosterols Market Showcasing Lucrative Growth?

Availability of Plant Sterol in Numerous Forms to Drive Growth

Plant sterol is a type of plant lipid, which acts as a natural cholesterol blocker. It is present in fruits, vegetables, and grains and has a similar structure as that of body cholesterol. Plant sterol helps in blocking the absorption of the body’s cholesterol level in the blood during the meal digestion process, thereby lowering LDL cholesterol significantly.

Various renowned brands like Cargill are offering innovative products which are stable across a wide range of pH levels and temperatures in Japan. Also, key companies are providing unique supplements that are available in numerous forms to suit a wide range of applications, which is further increasing phytosterols production in the country.

Nandini Roy Choudhury

Principal Consultant

Talk to Analyst

Find your sweet spots for generating winning opportunities in this market.

Category-wise Insights

Which Type of Phytosterols is the Most Preferred?

Pharmaceutical Industry to Adopt Beta-sitosterol Worldwide

Based on product type, the beta-sitosterol segment is projected to remain at the forefront in the global phytosterols market during the forthcoming years. Sales of beta-sitosterol are growing in the pharmaceutical industry worldwide.

Increasing the use of the product for the manufacturing of medicines to treat prostate disorders is expected to push the segment. It is also set to be used for lowering cholesterol levels and treating urinary tract infection symptoms, allergies, heart disease symptoms, colon cancer, and migraine.

Which is the Leading Source of Phytosterols?

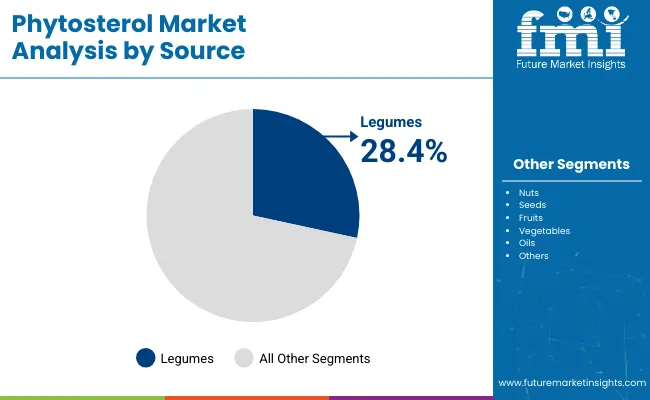
Legumes Containing Essential Phytosterols to Gain Traction

Many healthy plants contain natural phytosterols in considerable amounts, including nuts (macadamia nuts, pistachios, cashews, almonds, hazelnuts, and peanuts), seeds (sunflower seeds, pumpkin seeds, and watermelon seeds), fruits (oranges, pineapples, bananas, berries, apricots, and apples), vegetables (broccoli, artichokes, cabbage, green beans, sweet potatoes, asparagus, cauliflower, and celery), plant oils (argan oil, olive oil, canola oil, and sunflower oil), and legumes (lentils, chickpeas, adzuki beans, mung beans, and soybeans).

Among all the above-mentioned sources, the content of essential phytosterols is high in legumes. For instance, 170 grams or 1 cup of chickpeas may contain approximately 206 mg of plant sterol, which is greater than that of any other whole grain. Legumes as a natural source of phytosterols and are thus gaining momentum in the market.

Which is the Chief Application in the Phytosterols Market?

Consumers Are Looking for Plant Stanols and Sterols Supplements

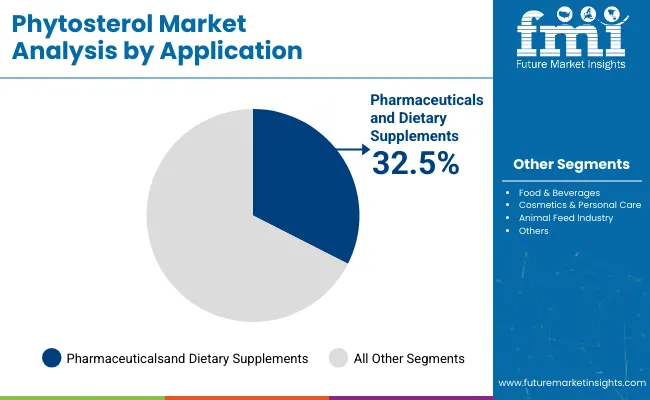
Phytosterols can compete with dietary cholesterol in the human gut with the help of certain enzymes needed for increasing metabolism and reducing cholesterol absorption by 30% to 50% in the body. According to research, consuming 2 grams of plant sterol per day may reduce LDL or bad cholesterol in blood levels by approximately 8% to 10%.

Rising concerns about the negative effects of conventional chemical ingredients on health are encouraging consumers to look for natural dietary supplements. Thus, renowned manufacturers are producing new dietary supplements with plant-based ingredients like phytosterols to attract more health-conscious consumers.

Competitive Landscape

Key phytosterols manufacturers are striving to withstand competition in the global market by adopting various business strategies, including acquisitions, partnerships, and agreements. Some of the top phytosterols brands are mainly focusing on new product launches to generate more shares and attract a large consumer base.

For instance,

  • In June 2019, Raisio Plc invested US$ 55 Million in the field of plant sterol, as well as healthy food-based value-added products to strengthen its position as a reputed brand in the Europe market. The company also filed for an LDL cholesterol-lowering plant sterol ester patent, which will be applicable internationally for dietary supplements- right from spreads to convenient pill options.

Get the data you need at a Fraction of the cost

Personalize your report by choosing insights you need
and save 40%!

Scope of the Report

Attributes Details
Estimated Market Size (2022) US$ 0.8 Billion
Projected Market Valuation (2032) US$ 2.0 Billion
Value-based CAGR (2022 to 2032) 9.1%
Forecast Period 2022 to 2032
Historical Data Available for 2017 to 2021
Market Analysis Value (US$ Billion) and Volume (MT)
Key Regions Covered North America; Latin America; Europe; East Asia; South Asia; Oceania; and Middle East and Africa
Key Countries Covered United States of America, Canada, Brazil, Mexico, Argentina, Chile, Peru, Germany, France, Italy, Spain, UK, Netherlands, Belgium, Nordic, Russia, China, Japan, South Korea, India, Thailand, Malaysia, Indonesia, Singapore, Australia, New Zealand, GCC Countries, South Africa, Central Africa, and North Africa
Key Segments Covered Product Type, Source, Application, and Region
Key Companies Profiled Bunge Limited; Cargill Inc.; BASF SE; Archer Daniels Midland Company; DuPont De Nemours; Pharmachem Laboratories Inc.; Unilever Plc; Arboris LLC; Gustav Parmentier GmbH; Raisio Plc; Others
Report Coverage Market forecast, company share analysis, competition intelligence, Drivers, Restraints, Opportunities and Threats analysis, market dynamics and challenges, and strategic growth initiatives

Phytosterols Market Outlook by Category

By Product Type:

  • Campesterol
  • Beta-Sitosterol
  • Stigmasterol
  • Others

By Source:

  • Nuts
  • Seeds
  • Fruits
  • Vegetables
  • Legumes
  • Oils
  • Others

By Application:

  • Food & Beverages
  • Pharmaceuticals and Dietary Supplements
  • Cosmetics & Personal Care
  • Animal Feed Industry
  • Others

By Region:

  • North America
  • Latin America
  • Europe
  • East Asia
  • South Asia
  • Oceania
  • Middle East and Africa

Frequently Asked Questions

How much is the global phytosterols market worth?

The global phytosterols market is estimated to reach nearly US$ 0.8 Billion by 2022.

At what CAGR is the phytosterols market set to expand through 2032?

The phytosterols market is expected to grow at a CAGR of 9.1% during the forecast period (2022 to 2032).

At what CAGR did the phytosterols market grow over the past half-decade?

The phytosterols market exhibited a CAGR of around 8.2% over the past half-decade.

What will be the global phytosterols market size in 2032?

The global phytosterols market size is set to be valued at US$ 2.0 Billion in 2032.

Who are the key players operating in the phytosterols market?

Bunge Limited, Cargill Inc., BASF SE, Archer Daniels Midland Company, and DuPont De Nemours are the key players operating in the phytosterols market.

Which are the top countries driving the phytosterols market?

The top countries driving demand for phytosterols are the USA, Japan, Netherlands, India, and the UK

What are the key factors propelling growth in the phytosterols market?

The increasing prevalence of high cholesterol and the rising number of new product launches by key players are propelling growth in the phytosterols market.

Table of Content
1. Executive Summary | Phytosterol Market

    1.1. Global Market Outlook

    1.2. Demand-side Trends

    1.3. Supply-side Trends

    1.4. Technology Roadmap Analysis

    1.5. Analysis and Recommendations

2. Market Overview

    2.1. Market Coverage / Taxonomy

    2.2. Market Definition / Scope / Limitations

3. Market Background

    3.1. Market Dynamics

        3.1.1. Drivers

        3.1.2. Restraints

        3.1.3. Opportunity

        3.1.4. Trends

    3.2. Scenario Forecast

        3.2.1. Demand in Optimistic Scenario

        3.2.2. Demand in Likely Scenario

        3.2.3. Demand in Conservative Scenario

    3.3. Product Launches & Recent Developments

    3.4. Product Life Cycle Analysis

    3.5. Value Chain Analysis

        3.5.1. Supply Side Participants and Their Roles

            3.5.1.1. Producers

            3.5.1.2. Mid-Level Participants (Traders/ Agents/ Brokers)

            3.5.1.3. Wholesalers and Distributors

        3.5.2. % of Operating Margin Analysis

        3.5.3. List of Raw Material Suppliers

        3.5.4. List of Existing and Potential Buyers

    3.6. Global Market - Pricing Analysis

        3.6.1. Price Point Assessment by Region

        3.6.2. Price Point Assessment by Product Type

        3.6.3. Price Forecast till 2032

        3.6.4. Factors affecting pricing

    3.7. Forecast Factors - Relevance & Impact

    3.8. Regulatory Landscape

        3.8.1. Packaging & Labelling Regulations

        3.8.2. Certifications and Certifying Agency Overview

        3.8.3. Import/Export Policies

    3.9. Regional Parent Market Outlook

    3.10. Production and Consumption Statistics

    3.11. Import and Export Statistics

    3.12. Consumers Survey Analysis

    3.13. Macro-Economic Factors

4. Global Market Analysis 2017 to 2021 and Forecast, 2022 to 2032

    4.1. Historical Market Size Value (US$ Billion) & Volume (MT) Analysis, 2017 to 2021

    4.2. Current and Future Market Size Value (US$ Billion) & Volume (MT) Projections, 2022 to 2032

        4.2.1. Y-o-Y Growth Trend Analysis

        4.2.2. Absolute $ Opportunity Analysis

5. Global Market Analysis 2017 to 2021 and Forecast 2022 to 2032, By Product Type

    5.1. Introduction / Key Findings

    5.2. Historical Market Size Value (US$ Billion) & Volume (MT) Analysis By Product Type, 2017 to 2021

    5.3. Current and Future Market Size Value (US$ Billion) & Volume (MT) Analysis and Forecast By Product Type, 2022 to 2032

        5.3.1. Campesterol

        5.3.2. Beta-Sitosterol

        5.3.3. Stigmasterol

        5.3.4. Others

    5.4. Y-o-Y Growth Trend Analysis By Product Type, 2017 to 2021

    5.5. Absolute $ Opportunity Analysis By Product Type, 2022 to 2032

6. Global Market Analysis 2017 to 2021 and Forecast 2022 to 2032, By Source

    6.1. Introduction / Key Findings

    6.2. Historical Market Size Value (US$ Billion) & Volume (MT) Analysis By Source, 2017 to 2021

    6.3. Current and Future Market Size Value (US$ Billion) & Volume (MT) Analysis and Forecast By Source, 2022 to 2032

        6.3.1. Nuts

        6.3.2. Seeds

        6.3.3. Fruits

        6.3.4. Vegetables

        6.3.5. Legumes

        6.3.6. Oils

        6.3.7. Others

    6.4. Y-o-Y Growth Trend Analysis By Source, 2017 to 2021

    6.5. Absolute $ Opportunity Analysis By Source, 2022 to 2032

7. Global Market Analysis 2017 to 2021 and Forecast 2022 to 2032, By Application

    7.1. Introduction / Key Findings

    7.2. Historical Market Size Value (US$ Billion) & Volume (MT) Analysis By Application, 2017 to 2021

    7.3. Current and Future Market Size Value (US$ Billion) & Volume (MT) Analysis and Forecast By Application, 2022 to 2032

        7.3.1. Food & Beverages

        7.3.2. Pharmaceuticals and Dietary Supplements

        7.3.3. Cosmetics & Personal Care

        7.3.4. Animal Feed Industry

        7.3.5. Others

    7.4. Y-o-Y Growth Trend Analysis By Application, 2017 to 2021

    7.5. Absolute $ Opportunity Analysis By Application, 2022 to 2032

8. Global Market Analysis 2017 to 2021 and Forecast 2022 to 2032, By Region

    8.1. Introduction

    8.2. Historical Market Size Value (US$ Billion) & Volume (MT) Analysis By Region, 2017 to 2021

    8.3. Current Market Size Value (US$ Billion) & Volume (MT) Analysis and Forecast By Region, 2022 to 2032

        8.3.1. North America

        8.3.2. Latin America

        8.3.3. Europe

        8.3.4. East Asia

        8.3.5. South Asia

        8.3.6. Oceania

        8.3.7. Middle East and Africa

    8.4. Market Attractiveness Analysis By Region

9. North America Market Analysis 2017 to 2021 and Forecast 2022 to 2032, By Country

    9.1. Historical Market Size Value (US$ Billion) & Volume (MT) Trend Analysis By Market Taxonomy, 2017 to 2021

    9.2. Market Size Value (US$ Billion) & Volume (MT) Forecast By Market Taxonomy, 2022 to 2032

        9.2.1. By Country

            9.2.1.1. USA

            9.2.1.2. Canada

        9.2.2. By Product Type

        9.2.3. By Source

        9.2.4. By Application

    9.3. Market Attractiveness Analysis

        9.3.1. By Country

        9.3.2. By Product Type

        9.3.3. By Source

        9.3.4. By Application

    9.4. Key Takeaways

10. Latin America Market Analysis 2017 to 2021 and Forecast 2022 to 2032, By Country

    10.1. Historical Market Size Value (US$ Billion) & Volume (MT) Trend Analysis By Market Taxonomy, 2017 to 2021

    10.2. Market Size Value (US$ Billion) & Volume (MT) Forecast By Market Taxonomy, 2022 to 2032

        10.2.1. By Country

            10.2.1.1. Brazil

            10.2.1.2. Mexico

            10.2.1.3. Argentina

            10.2.1.4. Chile

            10.2.1.5. Peru

            10.2.1.6. Rest of Latin America

        10.2.2. By Product Type

        10.2.3. By Source

        10.2.4. By Application

    10.3. Market Attractiveness Analysis

        10.3.1. By Country

        10.3.2. By Product Type

        10.3.3. By Source

        10.3.4. By Application

    10.4. Key Takeaways

11. Europe Market Analysis 2017 to 2021 and Forecast 2022 to 2032, By Country

    11.1. Historical Market Size Value (US$ Billion) & Volume (MT) Trend Analysis By Market Taxonomy, 2017 to 2021

    11.2. Market Size Value (US$ Billion) & Volume (MT) Forecast By Market Taxonomy, 2022 to 2032

        11.2.1. By Country

            11.2.1.1. Germany

            11.2.1.2. Italy

            11.2.1.3. France

            11.2.1.4. United Kingdom

            11.2.1.5. Spain

            11.2.1.6. Russia

            11.2.1.7. BENELUX

            11.2.1.8. Poland

            11.2.1.9. Nordic Countries

            11.2.1.10. Rest of Europe

        11.2.2. By Product Type

        11.2.3. By Source

        11.2.4. By Application

    11.3. Market Attractiveness Analysis

        11.3.1. By Country

        11.3.2. By Product Type

        11.3.3. By Source

        11.3.4. By Application

    11.4. Key Takeaways

12. East Asia Market Analysis 2017 to 2021 and Forecast 2022 to 2032, By Country

    12.1. Historical Market Size Value (US$ Billion) & Volume (MT) Trend Analysis By Market Taxonomy, 2017 to 2021

    12.2. Market Size Value (US$ Billion) & Volume (MT) Forecast By Market Taxonomy, 2022 to 2032

        12.2.1. By Country

            12.2.1.1. China

            12.2.1.2. Japan

            12.2.1.3. South Korea

        12.2.2. By Product Type

        12.2.3. By Source

        12.2.4. By Application

    12.3. Market Attractiveness Analysis

        12.3.1. By Country

        12.3.2. By Product Type

        12.3.3. By Source

        12.3.4. By Application

    12.4. Key Takeaways

13. South Asia Market Analysis 2017 to 2021 and Forecast 2022 to 2032, By Country

    13.1. Historical Market Size Value (US$ Billion) & Volume (MT) Trend Analysis By Market Taxonomy, 2017 to 2021

    13.2. Market Size Value (US$ Billion) & Volume (MT) Forecast By Market Taxonomy, 2022 to 2032

        13.2.1. By Country

            13.2.1.1. India

            13.2.1.2. Thailand

            13.2.1.3. Malaysia

            13.2.1.4. Indonesia

            13.2.1.5. Singapore

            13.2.1.6. Rest of South Asia

        13.2.2. By Product Type

        13.2.3. By Source

        13.2.4. By Application

    13.3. Market Attractiveness Analysis

        13.3.1. By Country

        13.3.2. By Product Type

        13.3.3. By Source

        13.3.4. By Application

    13.4. Key Takeaways

14. Oceania Market Analysis 2017 to 2021 and Forecast 2022 to 2032, By Country

    14.1. Historical Market Size Value (US$ Billion) & Volume (MT) Trend Analysis By Market Taxonomy, 2017 to 2021

    14.2. Market Size Value (US$ Billion) & Volume (MT) Forecast By Market Taxonomy, 2022 to 2032

        14.2.1. By Country

            14.2.1.1. Australia

            14.2.1.2. New Zealand

        14.2.2. By Product Type

        14.2.3. By Source

        14.2.4. By Application

    14.3. Market Attractiveness Analysis

        14.3.1. By Country

        14.3.2. By Product Type

        14.3.3. By Source

        14.3.4. By Application

    14.4. Key Takeaways

15. Middle East and Africa Market Analysis 2017 to 2021 and Forecast 2022 to 2032, By Country

    15.1. Historical Market Size Value (US$ Billion) & Volume (MT) Trend Analysis By Market Taxonomy, 2017 to 2021

    15.2. Market Size Value (US$ Billion) & Volume (MT) Forecast By Market Taxonomy, 2022 to 2032

        15.2.1. By Country

            15.2.1.1. GCC Countries

            15.2.1.2. South Africa

            15.2.1.3. Central Africa

            15.2.1.4. North Africa

        15.2.2. By Product Type

        15.2.3. By Source

        15.2.4. By Application

    15.3. Market Attractiveness Analysis

        15.3.1. By Country

        15.3.2. By Product Type

        15.3.3. By Source

        15.3.4. By Application

    15.4. Key Takeaways

16. Key Countries Market Analysis

    16.1. USA

        16.1.1. Pricing Analysis

        16.1.2. Market Share Analysis, 2021

            16.1.2.1. By Product Type

            16.1.2.2. By Source

            16.1.2.3. By Application

    16.2. Canada

        16.2.1. Pricing Analysis

        16.2.2. Market Share Analysis, 2021

            16.2.2.1. By Product Type

            16.2.2.2. By Source

            16.2.2.3. By Application

    16.3. Brazil

        16.3.1. Pricing Analysis

        16.3.2. Market Share Analysis, 2021

            16.3.2.1. By Product Type

            16.3.2.2. By Source

            16.3.2.3. By Application

    16.4. Mexico

        16.4.1. Pricing Analysis

        16.4.2. Market Share Analysis, 2021

            16.4.2.1. By Product Type

            16.4.2.2. By Source

            16.4.2.3. By Application

    16.5. Argentina

        16.5.1. Pricing Analysis

        16.5.2. Market Share Analysis, 2021

            16.5.2.1. By Product Type

            16.5.2.2. By Source

            16.5.2.3. By Application

    16.6. Chile

        16.6.1. Pricing Analysis

        16.6.2. Market Share Analysis, 2021

            16.6.2.1. By Product Type

            16.6.2.2. By Source

            16.6.2.3. By Application

    16.7. Peru

        16.7.1. Pricing Analysis

        16.7.2. Market Share Analysis, 2021

            16.7.2.1. By Product Type

            16.7.2.2. By Source

            16.7.2.3. By Application

    16.8. Germany

        16.8.1. Pricing Analysis

        16.8.2. Market Share Analysis, 2021

            16.8.2.1. By Product Type

            16.8.2.2. By Source

            16.8.2.3. By Application

    16.9. Italy

        16.9.1. Pricing Analysis

        16.9.2. Market Share Analysis, 2021

            16.9.2.1. By Product Type

            16.9.2.2. By Source

            16.9.2.3. By Application

    16.10. France

        16.10.1. Pricing Analysis

        16.10.2. Market Share Analysis, 2021

            16.10.2.1. By Product Type

            16.10.2.2. By Source

            16.10.2.3. By Application

    16.11. Spain

        16.11.1. Pricing Analysis

        16.11.2. Market Share Analysis, 2021

            16.11.2.1. By Product Type

            16.11.2.2. By Source

            16.11.2.3. By Application

    16.12. United Kingdom

        16.12.1. Pricing Analysis

        16.12.2. Market Share Analysis, 2021

            16.12.2.1. By Product Type

            16.12.2.2. By Source

            16.12.2.3. By Application

    16.13. Russia

        16.13.1. Pricing Analysis

        16.13.2. Market Share Analysis, 2021

            16.13.2.1. By Product Type

            16.13.2.2. By Source

            16.13.2.3. By Application

    16.14. Poland

        16.14.1. Pricing Analysis

        16.14.2. Market Share Analysis, 2021

            16.14.2.1. By Product Type

            16.14.2.2. By Source

            16.14.2.3. By Application

    16.15. BENELUX

        16.15.1. Pricing Analysis

        16.15.2. Market Share Analysis, 2021

            16.15.2.1. By Product Type

            16.15.2.2. By Source

            16.15.2.3. By Application

    16.16. Nordic Countries

        16.16.1. Pricing Analysis

        16.16.2. Market Share Analysis, 2021

            16.16.2.1. By Product Type

            16.16.2.2. By Source

            16.16.2.3. By Application

    16.17. China

        16.17.1. Pricing Analysis

        16.17.2. Market Share Analysis, 2021

            16.17.2.1. By Product Type

            16.17.2.2. By Source

            16.17.2.3. By Application

    16.18. Japan

        16.18.1. Pricing Analysis

        16.18.2. Market Share Analysis, 2021

            16.18.2.1. By Product Type

            16.18.2.2. By Source

            16.18.2.3. By Application

    16.19. South Korea

        16.19.1. Pricing Analysis

        16.19.2. Market Share Analysis, 2021

            16.19.2.1. By Product Type

            16.19.2.2. By Source

            16.19.2.3. By Application

    16.20. India

        16.20.1. Pricing Analysis

        16.20.2. Market Share Analysis, 2021

            16.20.2.1. By Product Type

            16.20.2.2. By Source

            16.20.2.3. By Application

    16.21. Thailand

        16.21.1. Pricing Analysis

        16.21.2. Market Share Analysis, 2021

            16.21.2.1. By Product Type

            16.21.2.2. By Source

            16.21.2.3. By Application

    16.22. Indonesia

        16.22.1. Pricing Analysis

        16.22.2. Market Share Analysis, 2021

            16.22.2.1. By Product Type

            16.22.2.2. By Source

            16.22.2.3. By Application

    16.23. Malaysia

        16.23.1. Pricing Analysis

        16.23.2. Market Share Analysis, 2021

            16.23.2.1. By Product Type

            16.23.2.2. By Source

            16.23.2.3. By Application

    16.24. Singapore

        16.24.1. Pricing Analysis

        16.24.2. Market Share Analysis, 2021

            16.24.2.1. By Product Type

            16.24.2.2. By Source

            16.24.2.3. By Application

    16.25. Australia

        16.25.1. Pricing Analysis

        16.25.2. Market Share Analysis, 2021

            16.25.2.1. By Product Type

            16.25.2.2. By Source

            16.25.2.3. By Application

    16.26. New Zealand

        16.26.1. Pricing Analysis

        16.26.2. Market Share Analysis, 2021

            16.26.2.1. By Product Type

            16.26.2.2. By Source

            16.26.2.3. By Application

    16.27. GCC Countries

        16.27.1. Pricing Analysis

        16.27.2. Market Share Analysis, 2021

            16.27.2.1. By Product Type

            16.27.2.2. By Source

            16.27.2.3. By Application

    16.28. South Africa

        16.28.1. Pricing Analysis

        16.28.2. Market Share Analysis, 2021

            16.28.2.1. By Product Type

            16.28.2.2. By Source

            16.28.2.3. By Application

    16.29. North Africa

        16.29.1. Pricing Analysis

        16.29.2. Market Share Analysis, 2021

            16.29.2.1. By Product Type

            16.29.2.2. By Source

            16.29.2.3. By Application

    16.30. Central Africa

        16.30.1. Pricing Analysis

        16.30.2. Market Share Analysis, 2021

            16.30.2.1. By Product Type

            16.30.2.2. By Source

            16.30.2.3. By Application

17. Market Structure Analysis

    17.1. Competition Dashboard

    17.2. Competition Benchmarking

    17.3. Market Share Analysis of Top Players

        17.3.1. By Regional

        17.3.2. By Product Type

        17.3.3. By Source

        17.3.4. By Application

18. Competition Analysis

    18.1. Competition Deep Dive

        18.1.1. Bunge Limited

            18.1.1.1. Overview

            18.1.1.2. Product Portfolio

            18.1.1.3. Profitability by Market Segments (Product Type/Source/Application/Region)

            18.1.1.4. Sales Footprint

            18.1.1.5. Strategy Overview

                18.1.1.5.1. Marketing Strategy

                18.1.1.5.2. Product Strategy

                18.1.1.5.3. Channel Strategy

        18.1.2. Cargill Inc.

            18.1.2.1. Overview

            18.1.2.2. Product Portfolio

            18.1.2.3. Profitability by Market Segments (Product Type/Source/Application/Region)

            18.1.2.4. Sales Footprint

            18.1.2.5. Strategy Overview

                18.1.2.5.1. Marketing Strategy

                18.1.2.5.2. Product Strategy

                18.1.2.5.3. Channel Strategy

        18.1.3. BASF SE

            18.1.3.1. Overview

            18.1.3.2. Product Portfolio

            18.1.3.3. Profitability by Market Segments (Product Type/Source/Application/Region)

            18.1.3.4. Sales Footprint

            18.1.3.5. Strategy Overview

                18.1.3.5.1. Marketing Strategy

                18.1.3.5.2. Product Strategy

                18.1.3.5.3. Channel Strategy

        18.1.4. Archer Daniels Midland Company

            18.1.4.1. Overview

            18.1.4.2. Product Portfolio

            18.1.4.3. Profitability by Market Segments (Product Type/Source/Application/Region)

            18.1.4.4. Sales Footprint

            18.1.4.5. Strategy Overview

                18.1.4.5.1. Marketing Strategy

                18.1.4.5.2. Product Strategy

                18.1.4.5.3. Channel Strategy

        18.1.5. DuPont De Nemours 

            18.1.5.1. Overview

            18.1.5.2. Product Portfolio

            18.1.5.3. Profitability by Market Segments (Product Type/Source/Application/Region)

            18.1.5.4. Sales Footprint

            18.1.5.5. Strategy Overview

                18.1.5.5.1. Marketing Strategy

                18.1.5.5.2. Product Strategy

                18.1.5.5.3. Channel Strategy

        18.1.6. Pharmachem Laborties Inc.

            18.1.6.1. Overview

            18.1.6.2. Product Portfolio

            18.1.6.3. Profitability by Market Segments (Product Type/Source/Application/Region)

            18.1.6.4. Sales Footprint

            18.1.6.5. Strategy Overview

                18.1.6.5.1. Marketing Strategy

                18.1.6.5.2. Product Strategy

                18.1.6.5.3. Channel Strategy

        18.1.7. Unilever Plc

            18.1.7.1. Overview

            18.1.7.2. Product Portfolio

            18.1.7.3. Profitability by Market Segments (Product Type/Source/Application/Region)

            18.1.7.4. Sales Footprint

            18.1.7.5. Strategy Overview

                18.1.7.5.1. Marketing Strategy

                18.1.7.5.2. Product Strategy

                18.1.7.5.3. Channel Strategy

        18.1.8. Arboris LLC

            18.1.8.1. Overview

            18.1.8.2. Product Portfolio

            18.1.8.3. Profitability by Market Segments (Product Type/Source/Application/Region)

            18.1.8.4. Sales Footprint

            18.1.8.5. Strategy Overview

                18.1.8.5.1. Marketing Strategy

                18.1.8.5.2. Product Strategy

                18.1.8.5.3. Channel Strategy

        18.1.9. Gustav Parmentier GmbH

            18.1.9.1. Overview

            18.1.9.2. Product Portfolio

            18.1.9.3. Profitability by Market Segments (Product Type/Source/Application/Region)

            18.1.9.4. Sales Footprint

            18.1.9.5. Strategy Overview

                18.1.9.5.1. Marketing Strategy

                18.1.9.5.2. Product Strategy

                18.1.9.5.3. Channel Strategy

        18.1.10. Raisio Plc

            18.1.10.1. Overview

            18.1.10.2. Product Portfolio

            18.1.10.3. Profitability by Market Segments (Product Type/Source/Application/Region)

            18.1.10.4. Sales Footprint

            18.1.10.5. Strategy Overview

                18.1.10.5.1. Marketing Strategy

                18.1.10.5.2. Product Strategy

                18.1.10.5.3. Channel Strategy

        18.1.11. Others on Additional Request

            18.1.11.1. Overview

            18.1.11.2. Product Portfolio

            18.1.11.3. Profitability by Market Segments (Product Type/Source/Application/Region)

            18.1.11.4. Sales Footprint

            18.1.11.5. Strategy Overview

                18.1.11.5.1. Marketing Strategy

                18.1.11.5.2. Product Strategy

                18.1.11.5.3. Channel Strategy

19. Assumptions & Acronyms Used

20. Research Methodology
Recommendations

Food and Beverage

Plant-based Milk Market

September 2021

REP-GB-13818

April 2024

315 pages

Food and Beverage

Plant Based Pork Market

November 2020

REP-GB-12707

March 2023

333 pages

Food and Beverage

Plant-based Hot Dogs Market

November 2020

REP-GB-12767

February 2023

337 pages

Explore Food and Beverage Insights

View Reports